
불행히도 "ON Trade Channels"은 더 이상 구매할 수 없습니다.
이전에 이 제품을 구입 한 경우 제한 사항없이 계속 사용할 수 있습니다. 그리고 새로운 사본의 설치는 활성화 회수가 남아있을 때까지 가능합니다.
- Metatrader 4 터미널을 엽니다.
- 설정에서 MQL5.Community 계정 자격 증명을 지정하십시오. 메뉴 도구 \ 옵션 \ 커뮤니티.
- "시장" 탭으로 이동 한 다음 "구매" 탭으로 이동합니다.
- 제품 이름의 오른쪽에있는 "설치"버튼을 클릭하십시오.
자세한 내용은 문서를 참조하십시오.
다른 metatrader 4 앱을 확인하십시오

$399에 10개 중 3개만 남았습니다! 그 후 가격은 $499로 인상됩니다.
- REAL SIGNAL(6개월 이상 활성화된 Real Signal): 기본 설정: https://www.mql5.com/en/signals/2276213 Gold Scalping AI는 EA입니다. 인공 지능 기술을 사용하여 많은 지표의 데이터를 분석합니다. 거기에서 EA는 주문을 입력하는 가장 좋은 옵션을 갖게 됩니다. Gold Scalping AI의 가장 큰 차이점은 EA가 다른 EA보다 위험:보상 비율을 훨씬 더 잘 제어할 수 있다는 것입니다. 진입점을 제어하고 미결 주문을 관리하는 도구 세트 덕분에 가능합니다. EA는 모든 주문에 손절매를 사용하고 위험한 거래 방법을 사용하지 않습니다. 그리드 없음, 마팅게일 없음,... Gold Scalping AI는 제가 사용해 본 EA 중 하나입니다. 수년간 펀드 관리 계좌를 사용하고 거래했습니다. 저는 공식적으로 EA의 가장 최적화된 버전을 출시했습

소개 Quantum Emperor EA는 유명한 GBPUSD 쌍을 거래하는 방식을 변화시키는 획기적인 MQL5 전문 고문입니다! 13년 이상의 거래 경험을 가진 숙련된 트레이더 팀이 개발했습니다.
IMPORTANT! After the purchase please send me a private message to receive the installation manual and the setup instructions. ***Quantum Emperor EA를 구매하시면 Quantum Wizard 또는 Quantum StarMan 또는 Quantum Gold Emperor를 무료로 받으실 수 있습니다!*** 자세한 내용은 비공개로 문의하세요.
새로운 Live Signal V5: 여기를 클릭하세요
MT5 버전 : 여기를 클릭하세요 Quantum EA 채널: 여기를 클릭하세요
10개 구매 시마다 가격이 $50씩 인상됩니다. 최종 가격 $1999

Introducing our advanced Scalping Forex Robot. The scalping algorithm is built to spot high-probability entry and exit points, ensuring that every trade is executed with the highest chance of success within the M1 timeframe . The best pair to use with the Scalping Robot is XAUUSD . This robot is perfect for traders who prefer the scalping method and want to take advantage of rapid price movements without having to manually monitor the charts. It is suitable for both beginners looking fo

The GBPUSD Robot MT4 is an advanced automated trading system meticulously designed for the specific dynamics of the GBP/USD currency pair. Utilizing advanced technical analysis, the robot assesses historical and real-time data to identify potential trends , key support and resistance levels, and other relevant market signals specific to GBP/USD. The Robot opens positions every day, from Monday to Friday, and all positions are secured with Take Profit, Stop Loss, Trailing Stop, Break-Even

The Bitcoin Robot MT4 is engineered to execute Bitcoin trades with unparalleled efficiency and precision . Developed by a team of experienced traders and developers, our Bitcoin Robot employs a sophisticated algorithmic approach (price action, trend as well as two personalized indicators) to analyze market and execute trades swiftly with M5 timeframe , ensuring that you never miss out on lucrative opportunities. No grid, no martingale, no hedging, EA only open one position at the sa

EA Gold Stuff 는 금 거래를 위해 특별히 고안된 전문가 고문입니다. 작업에 기반의 개방의 주문 금을 사용하여 물건의 표시는,그래서 고문 작품에 따라"트렌드를 따라"전략을 의미,다음과 같은 추세이다.
중요! 구매 후 즉시 저에게 연락하여 지침과 보너스를 받으십시오! 강력한 지원 및 트렌드 스캐너 표시기의 무료 사본을 받으실 수 있습니다. 메시지를 보내주세요. 나! 실시간 결과는 여기에서 볼 수 있습니다
매개 변수
새로운 시리즈 열기-주문의 새로운 시리즈의 온/오프 시작. 시작 로트-시작 로트. 무역 구매-전문가 고문이 구매할 수 있도록하십시오. 무역 판매-전문가 고문이 판매 할 수있게하십시오. 사용하지면서 기능을 사용한 고문이 무역은 모두 구매 및 판매하는 방향,기능 장애인,고문관이 무역에 단 하나의 방향이다. 돈 Manadgement 를 사용-온/오프 자동 로트 계산의 사용. 오토롯. 각 0.01 로트에 대한 자유 마진-각 0.01 로트 단위의 개방을위한

The EUR/USD Multi-Strategy Trading Robot MT4 is an advanced tool designed to optimize trading by combining 3 key systems: daily trading, volume analysis, and Fibonacci retracement levels. This robot works by integrating these different approaches to create a more dynamic and adaptable strategy for trading the EUR/USD pair . EA adapts to different market conditions, this makes it an ideal solution for traders looking to enhance their trading strategy with a powerful, multi-faceted approach.

공급과 수요의 원칙을 기반으로 한 완전 자동화된 EA입니다 . 완전 자동화된 공급 및 수요 자문 서비스를 제공하는 최초의 기업입니다 . 이제 거래가 쉬워졌고, 귀하는 거래 전략을 완벽하게 제어할 수 있습니다. 편리한 거래 차트 패널을 통해. 15,000줄이 넘는 코드가 포함된 고품질 알고리즘 거래 소프트웨어를 얻을 수 있습니다. Prop Firm Challenge에 참여하는 가장 좋은 방법은 자격을 갖춘 트레이더가 되기 위한 모든 단계를 따르는 것입니다.
ProBot 공급 및 수요 EA 가이드 || 거래 패널을 사용하는 방법 || 자동 조종 장치
구매 후 메시지를 보내주세요. 눈가리개 를 보내드릴게요. 가격은 199달러지만, 구매 후에는 완전히 무료로 제공됩니다.
공급 및 수요 거래 모드 EA ProBot
수동 거래: 공급 및 수요 영역 옆에 있는 범위 라벨을 클릭하여 수동으로 거래를 표시/제한할 수 있습니다. 이를 위해서는 입력 매개변수에서 수동 거래를 활성화하고 거래 패

We proudly present our cutting-edge robot, the Big Forex Players EA designed to maximize your trading potential, minimize emotional trading, and make smarter decisions powered by cutting-edge technology. The whole system in this EA took us many months to build, and then we spent a lot of time testing it. This unique EA includes three distinct strategies that can be used independently or in together. The robot receives the positions of the biggest Banks (p ositions are sent from our databa

출시 프로모션: 현재 가격에 남은 수량은 몇 개밖에 없습니다! 최종 가격: 1,700$ 1 EA 무료 제공 (2개의 거래 계좌에 해당) -> 구매 후 저에게 연락해주세요 Instruction Blog Link to Channel
ZenFlow에 오신 것을 환영합니다! ZenFlow는 변화하는 시장 트렌드에 정밀하고 신속하게 적응하도록 설계된 고급 EA입니다. XAUUSD( or GOLD) 기호로 거래할 수 있도록 최적화되어 있으며, 오직 하나의 차트에서만 실행해야 합니다. 이 EA는 정교한 추세 추종 전략과 최적의 진입점을 식별하면서 잘못된 신호를 걸러내는 모멘텀 기반 지표를 결합하여 사용합니다. 트레일링 손절매 기능은 이익을 확보하면서 효과적으로 리스크를 관리하는 데 도움을 줍니다. 최첨단 기술로 제작된 이 EA는 특히 추세가 있는 시장에서 효율적이며, 거래 실행의 높은 정확성을 보장합니다. 내장된 리스크 관리 시스템에는 동적 로트 크기 조정, 손절매, 이익 실현 및 트레일링

Aura Neuron은 Aura 시리즈 거래 시스템을 이어가는 독특한 전문가 자문입니다. 고급 신경망과 최첨단 클래식 거래 전략을 활용하여 Aura Neuron은 뛰어난 잠재적 성과를 가진 혁신적인 접근 방식을 제공합니다. 완전 자동화된 이 전문가 자문은 및 XAUUSD(GOLD)와 같은 통화 쌍을 거래하도록 설계되었습니다. 1999년부터 2023년까지 이러한 쌍에서 일관된 안정성을 입증했습니다. 이 시스템은 마팅게일, 그리드 또는 스캘핑과 같은 위험한 자금 관리 기술을 피하므로 모든 브로커 조건에 적합합니다. Aura Neuron은 다층 퍼셉트론(MLP) 신경망으로 구동되어 시장 추세와 움직임을 예측하는 데 활용합니다. MLP는 피드포워드 인공 신경망(ANN)의 한 유형으로, 특히 단일 숨겨진 계층으로 구성될 때 "바닐라" 신경망이라고도 합니다. MLP에는 입력 계층, 숨겨진 계층 및 출력 계층이라는 세 가지 필수 계층이 포함됩니다. 입력 노드를 제외한 각 뉴런은 비선형 활성화

1 copies left for $225 Next price --> $299 Diamond PRO is enhanced powerful version of Diamond for advanced traders. Pro version includes optimized cores, new impoved entry points filters, new multistage profit closure algorithm and сontains number of external control parameter that allows build and fine tune own tradind decisions and algorithms. The system provides more accurate market entries, analyzes and filters upcoming economic news, contains spread protection and an advanced position

Gann Made Easy 는 mr.의 이론을 사용하여 최고의 거래 원칙을 기반으로 하는 전문적이고 사용하기 쉬운 Forex 거래 시스템입니다. W.D. 간. 이 표시기는 Stop Loss 및 Take Profit Levels를 포함하여 정확한 BUY 및 SELL 신호를 제공합니다. PUSH 알림을 사용하여 이동 중에도 거래할 수 있습니다. 구매 후 연락주세요! 내 거래 팁과 훌륭한 보너스 지표를 무료로 공유하겠습니다! 아마도 Gann 거래 방법에 대해 이미 여러 번 들었을 것입니다. 일반적으로 Gann의 이론은 초보자 거래자뿐만 아니라 이미 거래 경험이 있는 사람들에게도 매우 복잡한 것입니다. Gann의 거래 방식은 이론적으로 적용하기 쉽지 않기 때문입니다. 나는 그 지식을 연마하고 Forex 지표에 최고의 원칙을 적용하기 위해 몇 년을 보냈습니다. 표시기는 적용하기가 매우 쉽습니다. 차트에 첨부하고 간단한 거래 권장 사항을 따르기만 하면 됩니다. 지표는 지속적으로 시장 분석 작업
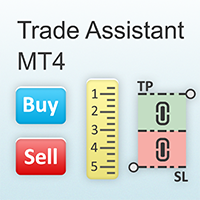
거래당 위험 계산, 라인을 사용한 손쉬운 신규 주문, 부분 청산 기능을 통한 주문 관리, 7가지 유형의 트레일링 스탑 및 기타 유용한 기능을 제공합니다.
추가 자료 및 지침
설치 지침 - 애플리케이션 지침 - 데모 계정용 애플리케이션 평가판
라인 기능 - 차트에 개시선, 손절매, 차익실현을 표시합니다. 이 기능을 사용하면 새로운 주문을 쉽게 하고 개봉 전에 추가 특성을 볼 수 있습니다.
위기 관리 - 위험 계산 기능은 설정된 위험과 손절매 주문의 크기를 고려하여 새 주문의 볼륨을 계산합니다. 이를 통해 손절매 크기를 설정하고 동시에 설정된 위험을 존중할 수 있습니다. 로트 계산 버튼 - 위험 계산을 활성화/비활성화합니다. 필요한 위험 값은 위험 필드에 0에서 100 사이의 백분율 또는 예금 통화로 설정됩니다. 설정 탭에서 위험 계산 옵션을 선택합니다. $ 통화, % 잔액, % 지분, % 자유 마진, % 사용자 정의, % AB 이전 일, % AB

Golden Rhythm - 내장 뉴스 보호 기능을 갖춘 적응형 거래 Golden Rhythm - 손쉽게 변동성 마스터하기 Access the expert details here . Please join our channel here .
최첨단 기술을 활용하여 Golden Rhythm와 함께하세요! 이 EA는 변동성 있는 시장에 적응하도록 최적화되어, 거래자에게 성과를 극대화하면서 위험을 관리할 수 있는 도구를 제공합니다. 당신이 초보자든, 고급 기능을 찾는 프로 거래자이든, Golden Rhythm는 일관된 수익을 위한 여정을 지원할 수 있습니다.
Golden Rhythm 사용 시작하기: Gold (XAUUSD)와 같은 최고의 거래 심볼 중에서 선택하세요. 추천된 시간대: H1 를 사용하여 단일 Gold (XAUUSD) 차트에 Golden Rhythm를 적용하세요. 시작할 때 기본 입력값 을 사용하여 EA에 익숙해지고, 원하는 대로 위험 설정을 조정하세요.
Golden Rhy

EA Gold Isis – 안전하고 효과적인 금 거래 솔루션
출시 프로모션 현재 가격으로 남은 1개만 판매! 다음 가격: $498 최종 가격: $1998 라이브 신호 MT5 버전
안녕하세요! 저는 EA Gold Isis, Diamond Forex Group 가족의 두 번째 EA로, 금(XAU/USD) 거래를 위해 특별히 설계되었습니다. 뛰어난 기능과 안전 우선 접근 방식을 통해 트레이더들에게 지속 가능하고 효과적인 금 거래 경험을 제공합니다.
EA Gold Isis의 특징
- 동적 스톱로스(SL): EA는 최근 캔들의 가격 범위에 기반한 스톱로스를 사용합니다. 이를 통해 SL이 시장 상황에 유연하게 적응하고 시장 변화에 따라 계좌를 더 효과적으로 보호할 수 있습니다.
- 다양한 거래 전략: EA는 3개의 거래 전략을 탑재하고 있으며, 각 전략은 최대 3개의 거래를 동시에 열 수 있어 총 9개의 거래를 동시에 실행할 수 있습니다.
- 유연한 트

SPECIAL BIG DISCOUNT! ->> Buy Forex GOLD Investor with -60% OFF! NOTE: Promo price: $197 (Regular Price: $497) - The offer ends soon! Live Signal Account: https://www.mql5.com/en/signals/2276118 Forex GOLD Investor is one of the best expert advisors developed to trade on GOLD(XAUUSD) in the forex market. Forex GOLD Investor consists of 2 trading systems . The first one is based on scalping trading strategy and the second system has time based dependency which opens up to 2 trades at a time. I

EA Black Dragon은 Black Dragon 표시기에서 작동합니다. Expert Advisor는 지표의 색상으로 거래를 연 다음 주문 네트워크를 구축하거나 손절매로 작업할 수 있습니다.
실제 작업 및 기타 개발 모니터링은 여기에서 찾을 수 있습니다. https://www.mql5.com/en/users/mechanic/seller
여기에서 모든 설정을 찾을 수 있습니다! 권장 사항
통화 쌍 EURUSD GBPUSD 타임 프레임 M15 권장 보증금 1000달러 또는 센트 권장 설정 기본 설정 입력 매개변수 초기 로트 - 초기 로트 로트 승수 - 후속 주문에 대한 로트 승수. Autolot - 자동 로트 계산을 활성화/비활성화합니다. 자동 로트 크기 - 자동 로트가 활성화된 경우 어드바이저가 로트를 사용할 예치금. 거리 - 주문 사이의 거리. 최대 로트 - 어드바이저가 열 수 있는 최대 로트. 이익을 취하십시오 - 이익을 취하십시오. 손절매 - 손절매 포인트;

ChatGPT Turbo를 통한 AI 기반 기술 Infinity EA는 GBPUSD 및 XAUUSD를 위해 설계된 고급 거래 전문가 자문가입니다. 안전성, 일관된 수익률 및 무한한 수익성에 중점을 둡니다. 마팅게일 또는 그리드 거래와 같은 고위험 전략에 의존하는 다른 많은 EA와 달리 Infinity EA는 최신 ChatGPT 버전에서 제공하는 기계 학습, 데이터 분석 AI 기반 기술에 내장된 신경망을 기반으로 하는 규율 있고 수익성 있는 스캘핑 전략을 사용하여 전반적인 거래 경험을 탁월하게 만듭니다. 6,000명 이상의 멤버로 구성된 MQL5 커뮤니티에 가입하여 다른 트레이더와 소통하세요. 최신 제품 업데이트, 팁, 독점 콘텐츠로 최신 정보를 받아보세요. MT5 버전 Infinity EA 설정 방법 특징
Infinity EA는 AI 기반 스캘핑 전략을 활용합니다. EA는 실시간 데이터 분석을 위해 ChatGPT-4 Turbo와 통합되어 있습니다. Infinity EA는 머

Trade Manager EA에 오신 것을 환영합니다. 이 도구는 거래를 보다 직관적이고 정확하며 효율적으로 만들기 위해 설계된 궁극적인 리스크 관리 도구 입니다. 단순한 주문 실행 도구가 아닌, 원활한 거래 계획, 포지션 관리 및 리스크 제어를 위한 종합 솔루션입니다. 초보자부터 고급 트레이더, 빠른 실행이 필요한 스캘퍼에 이르기까지 Trade Manager EA는 외환, 지수, 상품, 암호화폐 등 다양한 시장에서 유연성을 제공합니다. Trade Manager EA를 사용하면 복잡한 계산은 이제 과거의 일이 됩니다. 시장을 분석하고 진입, 손절 및 익절 수준을 차트의 수평선으로 표시한 후 리스크를 설정하면, Trade Manager가 이상적인 포지션 크기를 즉시 계산하고 SL 및 TP 값을 실시간으로 표시합니다. 모든 거래가 간편하게 관리됩니다. 주요 기능: 포지션 크기 계산기 : 정의된 리스크에 따라 거래 크기를 즉시 결정합니다. 간단한 거래 계획 : 진입, 손절, 익절을 위한
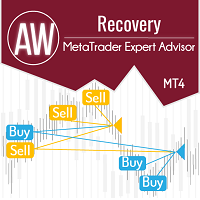
Expert Advisor는 수익성이 없는 포지션을 회수하도록 설계된 시스템입니다. 작성자의 알고리즘은 손실 위치를 잠그고 여러 부분으로 분할하고 각 부분을 별도로 닫습니다. 손쉬운 설정, 하락 시 지연된 시작, 다른 Expert Advisors 잠금, 비활성화, 추세 필터링을 통한 평균화 및 손실 위치의 부분 마감이 하나의 도구에 내장되어 있습니다. 전체 그룹에서만 주문을 마감하는 그리드 전략과 달리 더 낮은 예금 부하로 손실을 줄일 수 있는 부분에서 마감 손실을 사용하여 손실과 함께 더 안전한 작업을 보장합니다. 주문이 복원되는 방법: 1 EA는 선택한 상품의 다른 창을 닫아 수익성이 없는 EA를 끕니다(선택 사항). 2 EA는 처리된 모든 주문에 대해 TakeProfit 및 StopLoss 수준을 재설정하고 해당 식별자가 있는 보류 주문을 삭제합니다. 3 EA는 수익성이 없는 주문의 일부를 충당하고 총 포지션 볼륨을 줄이기 위해 이익을 사용하기 위해 처리된 모든 수익성 있

Local Trade Copier EA MT4 를 사용하여 매우 빠른 거래 복사 경험을 해보세요. 1분 안에 간편하게 설정할 수 있으며, 이 거래 복사기를 사용하면 Windows 컴퓨터 또는 Windows VPS에서 여러 개의 MetaTrader 터미널 간에 거래를 0.5초 미만의 초고속 복사 속도로 복사할 수 있습니다.
초보자든 전문가든 Local Trade Copier EA MT4 는 다양한 옵션을 제공하여 사용자의 특정 요구에 맞게 맞춤 설정할 수 있습니다. 이는 수익 잠재력을 높이려는 모든 사람을 위한 최고의 솔루션입니다. 지금 사용해보시고 이것이 왜 시장에서 가장 빠르고 쉬운 무역용 복사기인지 알아보세요! 팁: 여기 에서 데모 계정에서 Local Trade Copier EA MT4 데모 버전을 다운로드하여 사용해 볼 수 있습니다. 다운로드한 무료 데모 파일을 MT4 >> File >> Open Data Folder >> MQL4 >> Experts 폴더에 붙여넣고 터미널

Titan Gold AI Titan Gold AI — XAU/USD를 위한 강력한 전문가 어드바이저 많은 Aurum AI 사용자들의 요청에 따라 Titan Gold AI 를 개발했습니다. 이는 금(XAU/USD) 거래를 위한 혁신적인 로봇입니다. Titan Gold AI는 검증된 전략과 첨단 인공지능 기술을 결합하여 신뢰할 수 있고 효과적인 거래 도구로 자리 잡았습니다. Titan Gold - 중요한 정보 중요한 정보 Titan Gold 는 2025년 1월 1일 에 출시되었습니다. 솔직히 말씀드리겠습니다. 모든 거래 시스템은 불리한 시장 상황을 경험할 수 있습니다. 1월과 2월은 이 전문가 자문(Expert Advisor, EA)에게 어려운 시기였지만, 가장 큰 장점은 안정성과 알고리즘의 보안성 입니다. 이 EA는 거의 동일한 수준의 스톱로스(Stop Loss)와 테이크 프로핏(Take Profit)을 사용 하여 지난 두 달 동안 단 한 푼도 손실이 발생하지 않았습니다 . 이는 신뢰

HFT Prop Firm EA는 고유한 로고로 인해 Green Man으로도 알려져 있으며, 고빈도 거래(HFT) 전략을 허용하는 독점 트레이딩 회사(prop firms)의 도전 과제나 평가를 극복하기 위해 특별히 제작된 전문가 자문(EA)입니다. 한정 기간: HFT Prop Firm EA를 구매하면 $198 상당의 무료 유틸리티 제공 MT5 버전: https://www.mql5.com/en/market/product/117386 HFT 챌린지 성능 모니터(시작가 $200): 브로커: IC Markets 계좌 번호: 66603384 서버: ICmarketsSC-Demo06 비밀번호: Greenman 브로커: IC Markets 계좌 번호: 21718043 서버: ICmarketsSC-Demo02 비밀번호: Greenman 결과 1: https://c.mql5.com/31/1055/hft-prop-firm-ea-screen-4333.gif 결과 2: https://c.mql5.com/3

The Gold AI EA for gold trading in the MetaTrader 4 (MT4) platform is an automated trading system specifically designed for gold (XAU/USD) trading.
Such advisors typically use algorithms to execute trades based on technical analysis and other market data.
Its ability to interact contagiously with market volatility gives confidence to even the most cautious traders, opening up new horizons for them to achieve success. Regardless of the level of experience, this tool, capable of quickly adapting

Goldex AI: 오늘의 성공이 내일의 결실이 될 것입니다. 실시간 신호 > IC 마켓 리얼: Goldex AI 고위험 세트 매뉴얼 및 구성 파일: 매뉴얼 및 구성 파일을 받으려면 구매 후 저에게 연락하세요. 가격: 시작 가격은 $499이며 10회 판매할 때마다 $199씩 인상됩니다. 사용 가능한 사본 수: 8 Goldex AI - 신경망, 추세 및 가격 행동을 갖춘 고급 트레이딩 로봇. Goldex AI는 금의 지지선과 저항선을 돌파하는 가격 행동을 사용하여 뉴욕 시장의 움직임을 최대한 활용하여 가능한 최고의 수익을 얻는 고성능 트레이딩 로봇입니다. 이 로봇은 지능형 복구라는 전략을 가지고 있으, 손실이 발생한 후 활성화되고 더 큰 로타제를 열어 가능한 손실을 단시간에 복구하지만 사용자가 원할 경우 승수를 줄일 수 있습니다. Goldex AI에는 스마트 뉴스 필터가 내장되어 있어 중대형 뉴스가 없는 날을 걸러내어 거래를 비활성화하는데, 이는 요즘 시장이 매우 느리고 지지와 저항

Last copy at 399$ -> next price 499$ Dark Algo is a fully automatic Expert Advisor for Scalping Trading on Eurusd . This Expert Advisor is based on the latest generation of algorithm and is highly customizable to suit your trading needs. If you Buy this Expert Advisor you can write a feedback at market and get a second EA for Free , for More info contact me The basic strategy of this EA is built on a sophisticated algorithm that allows it to identify and follow market trends .
T

개요 CoreX G EA는 외환 시장의 복잡성을 해결하기 위해 특별히 설계된 고급 거래 시스템입니다. 최첨단 신경망, 정교한 머신 러닝 기술, 통합된 빅데이터 전략을 활용하여 CoreX G는 거래에서 탁월한 정확성과 보안을 제공합니다. 이 전문가 고문(EA)은 기술적 우수성과 프리미엄 고객 지원으로 차별화되며, 사용자가 질문이나 우려 사항에 대해 항상 도움을 받을 수 있도록 합니다.
신호: Live Signal Live Signal 2 Blog: CoreX G EA 이 전략은 매우 독특하기 때문에 라이선스의 수를 제한하여 판매하고 싶습니다. 따라서 판매를 제한하기 위해 가격이 점차 상승할 것입니다. 다음 가격은 790 달러입니다. 브로커 모든 브로커, ECN/제로 스프레드 선호 레버리지 1:20부터 입금 최소 200$ 심볼 XAUUSD 타임프레임 H1
빅데이터 통합 및 거래 전략 빅데이터는 CoreX G 전략의 핵심입니다. 이 시스템은 방대한 양의 역사적 및 실시간

Aurum AI – 금 거래(XAU/USD)를 위한 인공지능의 힘 거래에서 기술의 모든 가능성을 경험하세요! Aurum AI 는 금 시장에서 안정적이고 안전한 성과를 위해 설계된 혁신적인 전문가 어드바이저입니다. 인공지능의 힘, 정확한 트렌드 분석 및 엄격한 리스크 관리를 결합하여 모든 거래가 최대한 효과적으로 이루어지도록 합니다. 프로모션 Discount - 50%. 3 copies available at a price of $225 고위험 실시간 신호
(최대 손실 20%까지) Aurum AI 보너스 – 프랙탈 시스템을 기반으로 작동하는 독점 GoldPrime AI 어드바이저
(테스트 보기) Aurum AI를 구매하고 시장에 없는 유일한 어드바이저인 GoldPrime AI를 선물로 받으세요!
Aurum AI 구매자만 이용 가능합니다. 보너스를 받는 방법? 구매 후 저에게 연락해 주시면 선물을 보내드립니다.
Aurum AI의 주요 장점: 글로벌 트렌드 분석: 트렌드 방향에 엄격히

시장의 두 가지 기본 원칙에 기반한 일중 전략. 알고리즘은 추가 필터를 사용하여 거래량 및 가격 파동 분석을 기반으로 합니다. 지표의 지능형 알고리즘은 두 가지 시장 요인이 하나로 결합될 때만 신호를 제공합니다. 지표는 더 높은 시간 프레임의 데이터를 사용하여 M1 차트에서 특정 범위의 파도를 계산합니다. 그리고 파동을 확인하기 위해 지표는 볼륨 분석을 사용합니다. 이 표시기는 준비된 거래 시스템입니다. 트레이더가 필요로 하는 모든 것은 신호를 따르는 것입니다. 또한 지표는 자신의 거래 시스템의 기초가 될 수 있습니다. 거래는 분 차트에서만 수행됩니다. 지표가 MTF 원리를 사용한다는 사실에도 불구하고 지표 알고리즘은 가능한 한 안정적입니다. 구매 후 반드시 저에게 편지를 보내주세요! 내 거래 설정 및 권장 사항을 공유하겠습니다!

Bitcoin Smart EA는 고유한 MAFilling Trend 지표와 함께 작동합니다. 매우 간단하지만 효율적인 전략이며 고유하고 유연한 설정으로 이 EA는 매우 다재다능하며 거래에 최적의 결과를 만드는 데 도움이 됩니다. m15 또는 m30 시간 프레임에서 암호화폐와 모든 통화 및 금에서 매우 잘 작동합니다. 실시간 결과는 여기에서 볼 수 있습니다. 개인 보너스를 받으려면 구매 후 즉시 저에게 연락하십시오! 설정 및 매뉴얼은 여기 설정 Open new series - on/off 새로운 일련의 주문 시작 Trade Buy - 조언자가 구매하도록 허용 Trade Sell - 조언자가 판매하도록 허용 Support manual orders - 수동 주문 지원 참 또는 거짓 Max Orders - 최대 허용 주문 Order Comment - 주문 코멘트 이름 Start lots - 초기 시작 로트 Use Money Management - 자동 로트 계산 on/off 사용 Aut

ENIGMERA: 시장의 핵심 중요: MQL5.com의 데모는 Strategy Tester에서 실행되며 Enigmera의 기능을 완전히 반영하지 못할 수 있습니다. 설명, 스크린샷 및 비디오를 확인하여 자세한 내용을 확인하십시오. 질문이 있으면 언제든지 메시지를 보내주세요! 인디케이터의 코드는 완전히 다시 작성되었습니다. 버전 3.0은 새로운 기능을 추가하고 인디케이터가 처음 출시된 이후 누적된 버그를 수정했습니다.
소개
이 인디케이터 및 거래 시스템은 금융 시장에 대한 주목할 만한 접근 방식입니다. ENIGMERA는 프랙탈 주기를 사용하여 정확하게 지원 및 저항 수준을 계산합니다. 실제 축적 단계를 보여주고 방향과 목표를 제공합니다. 트렌드와 수정 모두에서 작동하는 시스템입니다. 작동 방식
인디케이터의 대부분의 기능은 차트 왼쪽에 있는 버튼을 통해 제어되며, 이를 통해 다양한 시장 상황에 빠르게 대응할 수 있습니다. 버튼 ON/OFF – 인디케이터 전체를 표시하거나 숨깁니다.

Eternal Engine은 여러 지표를 결합하고 그리드와 마틴게일 전략을 채택한 고급 EA입니다. 이 EA의 핵심 특징은 진입 지점을 정밀하게 제어하는 능력으로, 복잡한 시장 환경에서도 뛰어난 성과를 유지할 수 있습니다. Eternal Engine EA는 많은 거래 기회를 제공하며, 스프레드에 민감하지 않고 엄격한 진입 지점 관리로 모든 거래를 정확하게 실행합니다. 이 전략은 실거래에서 입증되어 1년 이상의 낮은 손실률 실시간 신호를 제공합니다. 초보자든 숙련된 거래자든 Eternal Engine EA는 탁월한 거래 경험을 제공합니다. 위의 내용은 기계 번역입니다, 죄송합니다.궁금하신 점이 있으시면 사용설명서를 읽어보시거나 연락주시기 바랍니다. MT5 사용 설명서
signal: https://www.mql5.com/en/signals/2281073 signal: https://www.mql5.com/en/signals/2220467 다음 가격: $699 setfi

비트코인 봇
Btc 봇은 확률적 테이프 지표를 사용하며 비트코인 거래를 위해 특별히 설계되었지만, 원하는 경우 다른 통화 쌍도 거래할 수 있습니다. 테이프가 빨간색에서 녹색으로 교차하면 EA가 매수를 시작하고 녹색에서 빨간색으로 교차하면 EA가 매도를 시작합니다. 거래는 이익 실현에 도달할 때까지 마팅게일/그리드 스타일로 제어됩니다. EA에는 설정에 따라 뉴스가 나오기 전에 특정 시간에 새로운 포지션을 입력하는 것을 막는 뉴스 필터가 내장되어 있습니다.
통화 쌍 및 시간 프레임: m15의 btcusd에서 사용 m15의 xauusd 또는 eurusd와 같은 주요 통화 쌍, gbpusd, usdcad, audusd에서 사용할 수 있습니다.
뉴스 설정: "도구", "옵션", "전문가 자문가"로 이동하여 "나열된 URL에 대한 웹 요청 허용" 확인란을 선택하세요. 다음 URL을 추가합니다. https://sslecal2.investing.com/ https://www.worldt

Gold Stuff는 금을 위해 특별히 설계된 추세 지표이며 모든 금융 상품에서도 사용할 수 있습니다. 표시기가 다시 그려지지 않고 지연되지 않습니다. 권장 기간 H1.
표시기에서 완전 자동 Expert Advisor EA Gold Stuff를 작동합니다. 내 프로필에서 찾을 수 있습니다.
설정 및 개인 보너스를 받으려면 구매 후 즉시 저에게 연락하십시오! 강력한 지원 및 트렌드 스캐너 표시기의 무료 사본을 받으실 수 있습니다. 메시지를 보내주세요. 나!
설정
화살표 그리기 - 켜기 끄기. 차트에 화살표 그리기. 경고 - 가청 경고를 끕니다. 이메일 알림 - 켜기 끄기. 이메일 알림. Puch-notification - 켜기 끄기. 푸시 알림. 다음으로 색 영역을 조정합니다. Gold Stuff는 금을 위해 특별히 설계된 추세 지표이며 모든 금융 상품에서도 사용할 수 있습니다. 표시기가 다시 그려지지 않고 지연되지 않습니다. 권장 기간 H1.
표시기에서 완전 자동
Introducing the DS Gold Robot, your ultimate companion in navigating the intricate world of XAUUSD trading. Developed with precision and powered by cutting-edge algorithms, DS Gold is a forex robot meticulously crafted to optimize your trading performance with XAUUSD pairs . With its advanced analytical capabilities, DS Gold Robot constantly monitors the gold market, identifying key trends , patterns, and price movements with lightning speed. The DS Gold Robot opens positions every day from

The XG Gold Robot MT4 is specially designed for Gold. We decided to include this EA in our offering after extensive testing . XG Gold Robot and works perfectly with the XAUUSD, GOLD, XAUEUR pairs. XG Gold Robot has been created for all traders who like to Trade in Gold and includes additional a function that displays weekly Gold levels with the minimum and maximum displayed in the panel as well as on the chart, which will help you in manual trading. It’s a strategy based on Price

CyNera: 귀하의 거래, 우리의 기술
신호 >400%: CyNera 신호 >500%: CyNera Turbo
매뉴얼 및 설정 파일: 구매 후 저에게 연락하면 매뉴얼과 설정 파일을 받으실 수 있습니다 가격: 가격은 판매된 라이선스 수에 따라 상승합니다 사용 가능한 복사본: 4 금은 시장에서 가장 변동성이 큰 금융 상품 중 하나로, 정확한 거래, 심도 있는 분석 및 강력한 리스크 관리가 요구됩니다. CyNera 전문가 조언자는 이러한 요소들을 통합하여, 최적의 금 거래를 위한 정교한 시스템으로 설계되었습니다. CyNera의 고급 전략과 기술은 경험이 풍부한 트레이더는 물론, 초보자도 금 거래에서 직면하는 독특한 도전과 기회를 극복할 수 있도록 지원합니다. CyNera는 금 시장의 복잡성에 맞춰 신뢰할 수 있는 솔루션을 제공합니다. 적응적이고 지능적인 전략과 다중 시간대 분석, 자동 거래 조정, 정밀한 리스크 관리 등 고급 기능을 결합합니다. 이러한 적응성 덕분에 CyNera는

Forex trading bot ai is an artificial intelligence-based robot with self-learning capabilities. This robot initiates its first trades based on the input parameters specified in the settings. Each trade executed by the robot is recorded in a file (memorized). The robot then analyzes all the closed trades and the conditions under which they were closed. If the overall profit of the closed trades is negative, the robot examines the parameters with which they were opened and adjusts them to improve

!SPECIAL SALE! An exclusive indicator that utilizes an innovative algorithm to swiftly and accurately determine the market trend. The indicator automatically calculates opening, closing, and profit levels, providing detailed trading statistics. With these features, you can choose the most appropriate trading instrument for the current market conditions. Additionally, you can easily integrate your own arrow indicators into Scalper Inside Pro to quickly evaluate their statistics and profitability

Bonus: By purchasing this Expert, get 1 Expert as a gift (Only for the next 7 buyers) To receive the bonus, send a message after purchase A fully automatic expert
Designed and produced 100% by artificial intelligence, with the world's most advanced technology
All trades have profit and loss limits, with the best and least risky market strategy, without using dangerous strategies such as Martingale and hedges, etc.
A specialist who has been trained by artificial intelligence for years to correct

Important: Please use in accounts with lower swap or swap-free accounts. Real monitoring signals: Signal 1 Contact me after payment to send you the user manual PDF file See the real monitoring signal in my profile. Use only on gold and on the BUY direction. Trading gold is attractive to many traders due to the high volatility and depth of the market. Should we invest in gold or just scalp it? Answering this question is a big challenge for many traders. X trading robot is the answer to this cha

Kamikaze Trading is the latest generation of automated trading robots for the Forex and Gold markets. The EA is programmed with premium algorithms and unique trading strategies that deliver stable performance and low risk. The strategy analyzes price action and price tick patterns, combines scalpers and smart position management and has available risk management options such as Max Stop Loss, Close all at Friday, Trailing, in which Max Stop Loss is often large so that the price has space to mov

Gold Scalping Expert는 지정학적 뉴스, 전염병, 경제 변화 등 영향력이 큰 다양한 사건이 진행되는 동안 금의 반응을 활용하는 매우 지능적인 스마트 알고리즘입니다. 이 시스템은 인기 있는 지그재그 표시기를 사용하여 전환점에 지정가 주문을 배치하고 가격이 이 수준을 넘어설 때 주문이 실행되는 브레이크아웃을 거래합니다. EA는 마틴게일 기술을 사용하지 않고도 귀하의 계정을 보호하고 위험을 적절하게 관리하기 위해 매우 스마트한 추적 중지 및 동적 중지 손실을 사용하고 있습니다. 실시간 결과는 여기에서 볼 수 있습니다. 개인 보너스를 받으려면 구매 후 즉시 저에게 연락하십시오! 설정 및 매뉴얼은 여기 설정 Open new series - on/off 새로운 일련의 주문 시작 Trade Buy - 조언자가 구매하도록 허용 Trade Sell - 조언자가 판매하도록 허용 Support manual orders - 수동 주문 지원 참 또는 거짓 Max Orders - 최대 허용

Prop Hunter Pro EA는 HFT와 Scalping 을 포함하여 6개의 정교하게 개발된 전략을 갖춘 고급 Expert Advisor (EA)입니다. 이 중 세 가지 전략은 Prop 회사의 도전에 대응하기 위해 설계되었으며, 나머지 세 가지 전략은 개인 거래 계좌에서 사용할 수 있도록 설계되었습니다.
원래 가격 399$ —> 40% 할인 단독 $229 (4개 복사본 사용 가능 )
실시간 작동을 보려면 아래 계좌 정보를 사용하여 MT4에 로그인하십시오:
계좌 번호: 12634479 | 비밀번호: PropHunterPro | 서버: ICmarketsSC-Demo01 | 전략: PassProp1-HFT
주요 기능
HFT 도전 과제를 위한 세 가지 전략: Prop 회사의 도전을 효과적으로 통과할 수 있도록 설계된 세 가지 전략, 낮은 드로우다운과 스톱 로스를 갖추고 있습니다. 개인 및 자금 지원 계좌를 위한 세 가지 전략: 나머지 세 가지 전략은 실제 수익을

Dynamic Forex28 Navigator - 차세대 외환 거래 도구. 현재 49% 할인.
Dynamic Forex28 Navigator는 오랫동안 인기 있는 지표의 진화형으로, 세 가지의 힘을 하나로 결합했습니다. 고급 통화 Strength28 지표(695개 리뷰) + 고급 통화 IMPULSE with ALERT(520개 리뷰) + CS28 콤보 신호(보너스).
지표에 대한 자세한 정보 https://www.mql5.com/en/blogs/post/758844
차세대 Strength 지표는 무엇을 제공합니까? 원래 지표에서 좋아했던 모든 것이 새로운 기능과 더 높은 정확도로 강화되었습니다.
주요 기능: 독점적인 통화 Strength 공식. 모든 시간대에 걸쳐 부드럽고 정확한 강도선. 추세와 정확한 진입을 식별하는 데 이상적입니다.
역동적인 시장 피보나치 수준(시장 피보나치). 이 지표에만 있는 고유한 기능. 가격 차트가 아닌 통화 강도에 피보나치가 적용됩니다.

탁월한 기술적 지표인 Grabber를 소개합니다. 이 도구는 즉시 사용 가능한 “올인원(All-Inclusive)” 트레이딩 전략으로 작동합니다.
하나의 코드 안에 강력한 시장 기술 분석 도구, 매매 신호(화살표), 알림 기능, 푸시 알림이 통합되어 있습니다. 이 인디케이터를 구매하신 모든 분들께는 다음의 항목이 무료로 제공됩니다: Grabber 유틸리티: 오픈 포지션을 자동으로 관리하는 도구 단계별 영상 매뉴얼: 설치, 설정, 그리고 실제 거래 방법을 안내 맞춤형 세트 파일: 인디케이터를 빠르게 자동 설정하여 최고의 성과를 낼 수 있도록 도와줍니다 다른 전략은 이제 잊어버리세요! Grabber만이 여러분을 새로운 트레이딩의 정점으로 이끌어 줄 수 있습니다. Grabber 전략의 주요 특징: 거래 시간 프레임: M5부터 H4까지 거래 가능한 자산: 어떤 자산이든 사용 가능하지만, 제가 직접 테스트한 종목들을 추천드립니다 (GBPUSD, GBPCAD, GBPCHF, AUDCAD

EA(Expert Advisor)은 뉴욕 세션 동안 시장이 움직이기 시작할 때(거래량 증가) 포지션을 엽니다. 이를 통해 모멘텀은 거래량에 의해 유지되며, 높은 확률로 즉시 테이크 프로핏(Take Profit)에 도달할 수 있습니다. 신호 (292%, 10% DD): https ://www .mql5 .com /en /signals /2274145 뉴욕 세션 모멘텀 기반 진입 EA는 낮은 타임프레임에서 FVG(Fair Value Gap)를 통해 숨겨진 충격을 감지합니다. 뉴욕 세션 직전 또는 세션 도중에 충격이 감지되면 EA는 포지션을 엽니다. 시장 동향에 따른 포지션 관리 모멘텀이 즉시 사라질 경우, EA는 다음 세 가지 전략 중 하나를 적용합니다: 특정 가격 수준에서 스톱로스를 실행하고 거래를 중단합니다. 스톱로스를 실행한 후 반대 방향으로 새로운 포지션을 엽니다. 초기 포지션을 추가하거나 제거하며 수익이 발생할 때까지 관리합니다. 사용 방법 구매 후, 자세한 설정 지침을 받

Recovery Manager Pro는 다른 조언자 또는 수동으로 개설된 주문에서 손실된 금액을 복구하기 위한 시스템입니다. RM Pro에는 자동으로 동적으로 조정하는 기능이 있습니다. 거래자는 위험 수준을 선택해야 하며 고문은 완전 자동 모드에서 작동합니다. 감소 복구 모드 및 대기 모드에서 작동 가능! 다른 자문가가 하락을 생성하는 경우 RM Pro는 이를 비활성화하고 포지션을 잠근 후 부분 청산을 사용하여 예치금을 복원하는 프로세스를 시작합니다. 거래에서 고문은 스마트 평균화, 잠금 및 부분 청산을 사용합니다. 고문은 모든 구매자가 선물로 받게 될 맞춤형 추세 지표를 연구합니다. Advisor의 주요 기능은 대기 모드에서 작동하는 기능입니다. 다른 자문가가 하락을 생성하는 즉시 RM Pro가 주문 관리를 인계받고 평균 주문을 공개한 후 부분적으로 마감합니다. 설정 지침: 링크 MT5 버전: 링크
조언자 기능: 수익성이 없는 포지션에서 손실

체험판 다운로드 EA Budak Ubat 채널 한정된 시간 가격! 10개의 구매마다 가격이 10 USD 상승합니다!
작동 방식 EA가 활성화되면 실행 모드 매개변수에 따라 차트를 분석합니다. 차트에 기존 포지션이 없으면 EA는 매개변수에 따라 거래를 시작합니다. 추세가 상승세이면 매수 거래를 시작하고 하락세이면 매도 거래를 시작합니다. 또한 손절매 변수가 0보다 클 경우 개설된 거래 가격에서 일정 거리만큼 손절매 주문을 설정합니다. 0은 손절매가 없음을 의미합니다. 차트에 기존 포지션이 있고 마지막 포지션이 손실인 경우, EA는 현재 시장 가격과 주문 간의 거리가 사용자가 설정한 최소 거리 이상인지 확인한 후, 캔들에 따라 거래를 시작합니다. 로트 크기는 마틴게일 방법을 사용하여 계산되며, 손절매 변수가 0보다 클 경우 개설된 거래 가격에서 일정 거리만큼 손절매 주문을 설정합니다. 헤징이 false로 설정된 경우, EA는 한 번에 한 방향으로만 거래를 시작합니다. 첫 번째 포지션
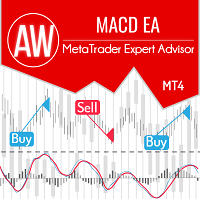
완전 자동화된 거래 시스템. 신호로 사용되는 고전적인 표시기 MACD 는 진입점을 감지하기 위해 오실레이터와 추세 표시기를 결합합니다. 평균화, 첫 번째 및 마지막 바구니 주문을 마감하는 기능 및 자동 로트 계산 기능을 사용합니다. 고급 대시보드와 세 가지 유형의 알림이 있습니다. Problem solving -> HERE / MT5 version -> HERE / Instruction -> HERE 이익:
완전 자동화된 거래 시스템 쉬운 설정과 직관적인 패널 인터페이스 캔들당 하나의 주문만 열 수 있는 기능 자동 로트 계산 내장 첫 번째 및 마지막 장바구니 주문을 마감하는 내장 시스템 세 가지 유형의 알림: 푸시, 이메일, 알림 전략: EA는 표시기에서 신호를 수신할 때 위치를 엽니다. - 제로 레벨: "0" 표시의 빠른 선이 아래에서 위로 교차할 때 - 구매 신호, BUY 주문 시작. 위에서 아래로 "0" 표시를 넘을 때 - 매도 신호, 매

Scalper Vault 는 성공적인 스캘핑에 필요한 모든 것을 제공하는 전문 스캘핑 시스템입니다. 이 표시기는 외환 및 바이너리 옵션 거래자가 사용할 수 있는 완전한 거래 시스템입니다. 권장 시간 프레임은 M5입니다. 시스템은 추세 방향으로 정확한 화살표 신호를 제공합니다. 또한 상단 및 하단 신호와 Gann 시장 수준을 제공합니다. 이 시스템은 사용하기가 매우 쉽습니다. 원하는 시장 지역의 화살표만 따라가면 됩니다. 엑시트는 가격이 적정 수준에 도달하거나 시장의 고점 또는 저점 신호가 나타날 때 수행됩니다. 표시기는 PUSH 알림을 포함한 모든 유형의 경고를 제공합니다. 인디케이터 구매 후 연락주세요. 내 개인 거래 권장 사항과 훌륭한 보너스 지표를 무료로 공유합니다! 나는 당신에게 행복하고 유익한 거래를 기원합니다!

AI Golden Jet Fighter GTX MT4는 Meta Trader 4 플랫폼에서 금 거래를 위한 간단하고 효율적인 전문가 자문(EA)입니다. 신경망을 활용한 이 EA는 금 시장(XAU/USD)에서 스캘핑을 위해 설계되었습니다. AI Golden Jet Fighter GTX의 주요 전략은 작은 가격 변동을 파악하고 포지션을 개설하여 단시간 내에 수익을 창출하는 데 중점을 둡니다. EA는 실시간으로 시장 상황을 분석하고 사전 정의된 손절매 및 이익 실현 수준으로 거래를 자동으로 실행합니다. 또한 트레일링 손절매 기능을 지원하여 시장이 유리하게 움직일 때 수익을 확보할 수 있습니다. 정확성을 보장하기 위해 EA는 스프레드 필터를 사용하여 불리한 조건에서 거래를 방지하고 슬리피지 보호 메커니즘을 사용하여 정확한 주문 실행을 수행합니다. AI Golden Jet Fighter GTX에는 위험 관리 기능이 포함되어 있어 거래자가 계좌 잔액의 백분율로 위험 수준을 설정할 수

LENA Scalp Lena Scalp 신호 라이브 버전 = https://www.mql5.com/en/signals/2295107 최첨단 스톱로스 기술과 인공지능을 활용한 Lena Expert Advisor는 혁신적인 거래 경험을 제공합니다. Lena의 로봇은 큰 스톱로스, 마틴게일 또는 그리드 거래를 사용하지 않습니다. 대신 시장 조건에 맞게 조정되는 동적 스톱로스 시스템을 사용합니다. 인공지능 기반 분석은 신중하게 설계된 전략에 따라 시장의 중요한 기회를 식별하는 데 도움을 줍니다. 이 자동화된 거래 솔루션은 경험이 풍부한 트레이더들이 개발한 견고하고 입증된 접근 방식을 바탕으로 신뢰성과 효율성을 제공합니다.
큰 손실 한도를 사용하지 않고 활성화가 유효하지 않다는 것을 감지할 때마다 가능한 가장 낮은 손실로 종료하고 라이브 계정에서 거래를 종료(인공 지능 감지)합니다. 전체 버전을 구매하면 Hijack 무료 버전이 제공됩니다. HiJack: https://

Gold One MT4 안녕하세요, 외환에서 금 거래를 좋아하는 모든 분들, 최고의 금 거래자들에 합류할 수 있는 로봇에 오신 것을 환영합니다. 20년 이상의 정확한 외환 시장 경험을 바탕으로, 최신 세대의 거래 로봇을 자랑스럽게 소개합니다.
특징: 프로프 회사의 도전에 적합합니다. 모든 계좌 크기에 적합하며, 소액 자본에도 사용 가능합니다. 그리드 없음과 마르팅게일 없음 100% 완전 자동화 이 로봇은 금에 특화된 최신, 혁신적, 그리고 최첨단 지표를 사용하여 매수 및 매도 지점을 식별하는 데 뛰어난 정확성을 자랑합니다. 이는 외환 시장 내 금 거래에서 혁신적인 돌파구를 의미합니다. 이 혁신은 10년 이상의 연구, 시도와 오류, 그리고 광범위한 테스트의 결과로, 금 거래의 전문가들로부터 얻은 통찰력을 통합하였습니다. 정교한 금 거래 패턴을 활용함으로써, 우리 로봇은 완전 자동화된 거래를 스트레스 없이 모니터링할 수 있도록 하여 마음의 평화를 보장합니다. 다년간의

"Grid Manual"은 주문 그리드 작업을 위한 거래 패널입니다. 이 유틸리티는 보편적이며 유연한 설정과 직관적인 인터페이스를 제공합니다. 그것은 손실을 평균화하는 방향뿐만 아니라 이익을 증가시키는 방향으로 주문 그리드와 함께 작동합니다. 거래자는 주문 그리드를 만들고 유지할 필요가 없으며 유틸리티에서 수행합니다. 거래자가 주문을 시작하는 것으로 충분하며 "Grid Manual"는 자동으로 그를 위한 주문 그리드를 생성하고 거래가 마감될 때까지 그와 동행할 것입니다. 전체 설명 및 데모 버전 여기 . 유틸리티의 주요 기능: 모바일 터미널을 포함하여 어떤 방식으로든 열린 주문과 함께 작동합니다. "제한" 및 "중지"의 두 가지 유형의 그리드와 함께 작동합니다. 고정 및 동적(ATR 표시기 기반)의 두 가지 유형의 그리드 간격 계산과 함께 작동합니다. 오픈 오더 그리드의 설정을 변경할 수 있습니다. 차트에서 각 주문 그리드의 손익분기점 수준을 표시합니다. 각 주문 그리드에 대한 이익

EvoTrade: 시장 최초의 자기 학습형 거래 시스템 EvoTrade를 소개합니다. 이는 최첨단 컴퓨터 비전 및 데이터 분석 기술을 활용하여 개발된 독창적인 거래 어드바이저입니다. EvoTrade는 시장 최초의 자기 학습형 거래 시스템으로, 실시간으로 작동합니다. EvoTrade는 시장 상황을 분석하고 전략을 조정하며 변화에 동적으로 적응하여 어떠한 환경에서도 탁월한 정확도를 제공합니다. EvoTrade는 Long Short-Term Memory(LSTM) 및 Gated Recurrent Units(GRU)와 같은 고급 신경망을 활용해 시간적 종속성을 분석하고, Convolutional Neural Networks(CNN)를 사용해 복잡한 시장 패턴을 감지합니다. 또한 Proximal Policy Optimization(PPO) 및 Deep Q-Learning(DQL)과 같은 강화 학습 알고리즘을 통해 실시간으로 전략을 적응시킵니다. 이러한 기술은 EvoTrade가 숨겨진 시장 신

트렌드 표시기, 트렌드 트레이딩 및 필터링을 위한 획기적인 고유 솔루션, 하나의 도구 안에 내장된 모든 중요한 트렌드 기능! Forex, 상품, 암호 화폐, 지수 및 주식과 같은 모든 기호/도구에 사용할 수 있는 100% 다시 칠하지 않는 다중 시간 프레임 및 다중 통화 표시기입니다. 기간 한정 특가: 지원 및 저항 스크리너 지표는 단 100달러에 평생 제공됩니다. (원래 가격 50 달러) (제안 연장)
Trend Screener는 차트에 점이 있는 화살표 추세 신호를 제공하는 효율적인 지표 추세 추종 지표입니다. 추세 분석기 표시기에서 사용할 수 있는 기능: 1. 트렌드 스캐너. 2. 최대 이익 분석이 있는 추세선. 3. 추세 통화 강도 측정기. 4. 경고가 있는 추세 반전 점. 5. 경고가 있는 강력한 추세 점. 6. 추세 화살표 Trend Screener Indicator가 있는 일일 분석 예, 일일 신호 성능...등은 여기에서 찾을 수 있습니다. 여기를 클릭하십시오.
L

Apollo Secret Trend는 모든 쌍과 시간대의 추세를 찾는 데 사용할 수 있는 전문적인 추세 지표입니다. 지표는 거래를 선호하는 쌍이나 기간에 관계없이 시장 동향을 감지하는 데 사용할 수 있는 주요 거래 지표가 될 수 있습니다. 표시기의 특수 매개변수를 사용하여 개인 거래 스타일에 맞게 신호를 조정할 수 있습니다. 표시기는 PUSH 알림을 포함한 모든 유형의 경고를 제공합니다. 표시기의 신호는 다시 칠하지 마십시오! 제공된 스크린샷에서 과매수/과매도 오실레이터 표시기와 함께 Apollo Secret Trend 표시기를 볼 수 있습니다. 이 표시기는 제가 절대적으로 무료로 제공합니다. 구매 후 두 번째 과매수 및 과매도 오실레이터 표시기를 무료로 받으려면 저에게 연락하십시오! 또한 시스템 사용 방법에 대한 지침도 제공합니다. 나는 또한 당신에게 큰 보너스를 공유 할 것입니다!

소개 Quantum Gold Emperor EA , 권위 있는 XAUUSD (GOLD )쌍 거래 방식을 변화시키는 획기적인 MQL5 전문 고문! 13년 이상의 거래 경험을 가진 숙련된 트레이더 팀이 개발했습니다.
중요한! 구매 후 개인 메시지를 보내 설치 매뉴얼과 설치 지침을 받으십시오. ***Quantum Gold Emperor EA를 구매하면 Quantum Trade EA를 무료로 받을 수 있습니다!*** 자세한 내용은 비공개로 문의하세요.
라이브 신호 : 여기를 클릭하세요
MT5 버전 : 여기를 클릭하세요 Quantum EA 채널: 여기를 클릭하세요
고급 알고리즘으로 구동되는 Expert Advisor는 모든 덧없는 기회를 활용하여 최적의 진입 및 퇴장을 보장합니다. 실시간 적응성: 금 시장의 역동적인 특성은 빠른 조정을 요구합니다. 당사의 어드바이저는 변화하는 시장 상황에 원활하게 적응하여 앞서 나갈 수 있도록 합니

PUMPING STATION – 당신만을 위한 올인원(All-in-One) 전략
PUMPING STATION은 당신의 외환 거래를 더욱 흥미롭고 효과적으로 바꿔줄 혁신적인 인디케이터입니다. 단순한 보조 도구가 아니라, 강력한 알고리즘을 갖춘 완전한 거래 시스템으로서 보다 안정적인 트레이딩을 시작할 수 있도록 도와줍니다. 이 제품을 구매하시면 다음의 혜택을 무료로 받으실 수 있습니다: 전용 설정 파일: 자동 설정으로 최대의 퍼포먼스를 제공합니다. 단계별 동영상 가이드: PUMPING STATION 전략으로 거래하는 법을 배워보세요. Pumping Utility: PUMPING STATION과 함께 사용하도록 설계된 반자동 거래 봇으로, 거래를 더욱 쉽고 편리하게 만들어줍니다. ※ 구매 후 바로 저에게 메시지를 보내주세요. 추가 자료에 대한 접근 권한을 제공해드립니다. PUMPING STATION은 어떻게 작동하나요? 트렌드 컨트롤: 시장의 추세 방향을 즉시 파악합니다. 추세는

After your purchase, feel free to contact me for more details on how to receive a bonus indicator called VFI, which pairs perfectly with Easy Breakout for enhanced confluence!
Easy Breakout is a powerful price action trading system built on one of the most popular and widely trusted strategies among traders: the Breakout strategy ! This indicator delivers crystal-clear Buy and Sell signals based on breakouts from key support and resistance zones. Unlike typical breakout indicators, it levera

거래 관리자는 위험을 자동으로 계산하는 동시에 거래를 빠르게 시작하고 종료하는 데 도움을 줍니다. 과잉 거래, 복수 거래 및 감정 거래를 방지하는 데 도움이 되는 기능이 포함되어 있습니다. 거래를 자동으로 관리할 수 있으며 계정 성과 지표를 그래프로 시각화할 수 있습니다. 이러한 기능은 이 패널을 모든 수동 거래자에게 이상적으로 만들고 MetaTrader 4 플랫폼을 향상시키는 데 도움이 됩니다. 다중 언어 지원. MT5 버전 | 사용자 가이드 + 데모 트레이드 매니저는 전략 테스터에서 작동하지 않습니다. 데모를 보려면 사용자 가이드로 이동하세요. 위기 관리 % 또는 $를 기준으로 위험 자동 조정 고정 로트 크기 또는 거래량과 핍을 기반으로 한 자동 로트 크기 계산을 사용하는 옵션 RR, Pips 또는 Price를 사용한 손익분기점 손실 설정 추적 중지 손실 설정 목표 달성 시 모든 거래를 자동으로 마감하는 최대 일일 손실률(%)입니다. 과도한 손실로부터 계정을 보호하고 과도한

트레이딩 어드바이저 아이스 큐브 스캘퍼 - 그것은 하루 스캘퍼입니다 , 매일 많은 거래를 하고 각 거래에 여러 포인트를 사용합니다. EA의 전략은 RSI 지표를 사용하여 추세에 따라 거래하는 것입니다. EA는 승수 로트와 함께 평균화를 사용하므로 EA를 사용하기 전에 이를 이해해야 하지만 백테스팅과 라이브 거래 모두에서 전략이 잘 수행되었습니다. 구매하기 전에 전략 테스터에서 어드바이저의 작업을 테스트하십시오. Expert Advisor에서 위험을 제어하기 위해 평균화를 위한 최대 주문 수와 자본 위험을 제한할 수 있습니다. 어드바이저가 작동하는 방식을 이해하기 위해 무료 신호를 구독할 수 있으므로 어드바이저가 작동하는 방식과 그 잠재력을 이해할 수 있습니다. 구매 후 반드시 연락 주시고, 항상 설정을 도와드리겠습니다. 또한 모든 구매자에게는 다른 고문의 형태로 귀중한 보너스가 제공됩니다. 고문의 온라인 모니터링 -