IQuantum
- 지표
- Evgeniy Scherbina
- 버전: 1.2
The indicator IQuantum shows trading signals for 10 symbols in the daily chart: AUDUSD, EURGBP, EURUSD, GBPCHF, GBPUSD, USDCAD, USDCHF, USDJPY, USDNOK, and USDSEK.
Signals of the indicator are produced by 2 neural models which were trained independently from one another. The inputs for the neural models are normalised prices of the symbols, as well as prices of Gold, Silver and markers of the current day.
Each neural model was trained in 2 ways. The Ultimate mode is an overfitted neural model which produces near-perfect signals in history and absolutely nonsensical rubbish in the unknown (future) period. Despite very precise signals in history, the forecast accuracy of the Ultimate mode is rarely over 20% in the uknown (future) period.
The Reliable mode is a neural model, for which the neural loss in the training period is similar to that in the uknown (future) period. Therefore, the Reliable mode is able to produce signals with the accuracy of over 50% in the uknown (future) period. It is this, and not the historical accuracy of the model, that should be considered as the most important advantage.
What does this indicator show?
The indicator shows signals which are calculated by 2 different neural models.
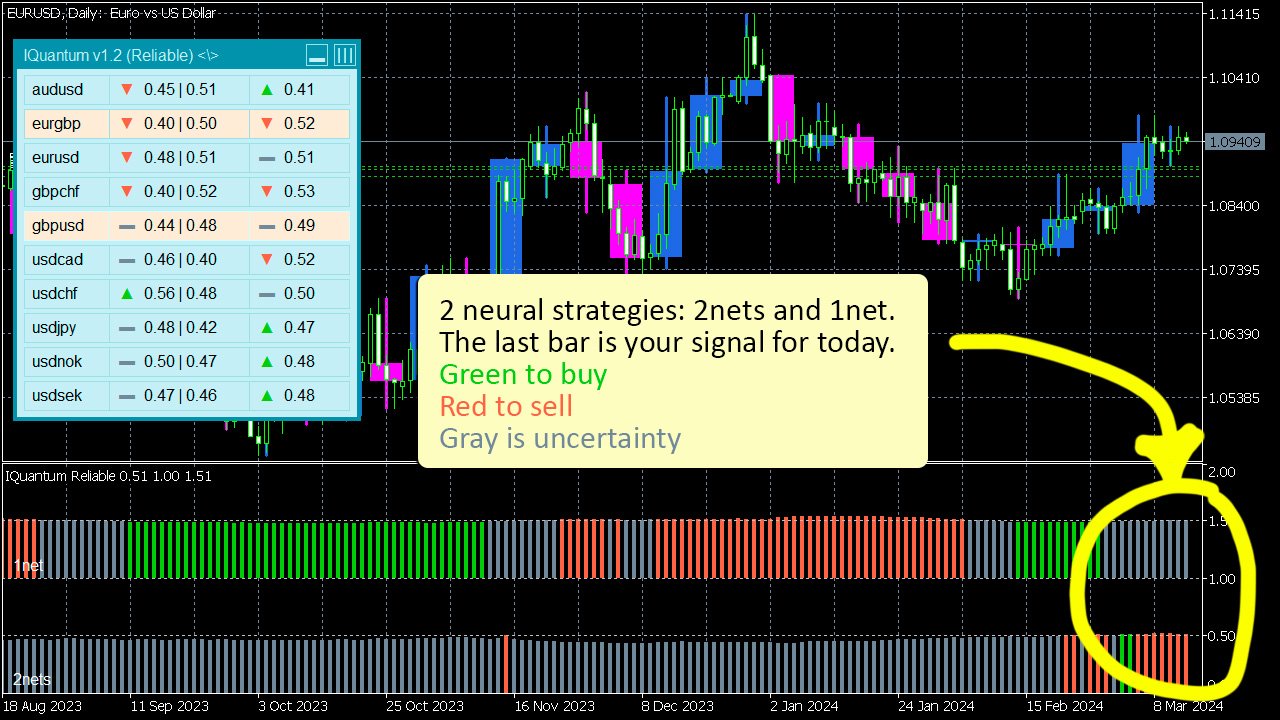
The indicator outputs 2 rows of bars (histograms) in the lower part of the chart. The lower row is the neural model with 2 networks (training according to the plan "buy or uncertainty" and "sell or uncertainty"). The upper row is the neural model with 1 network (training according to the plan "buy or sell").
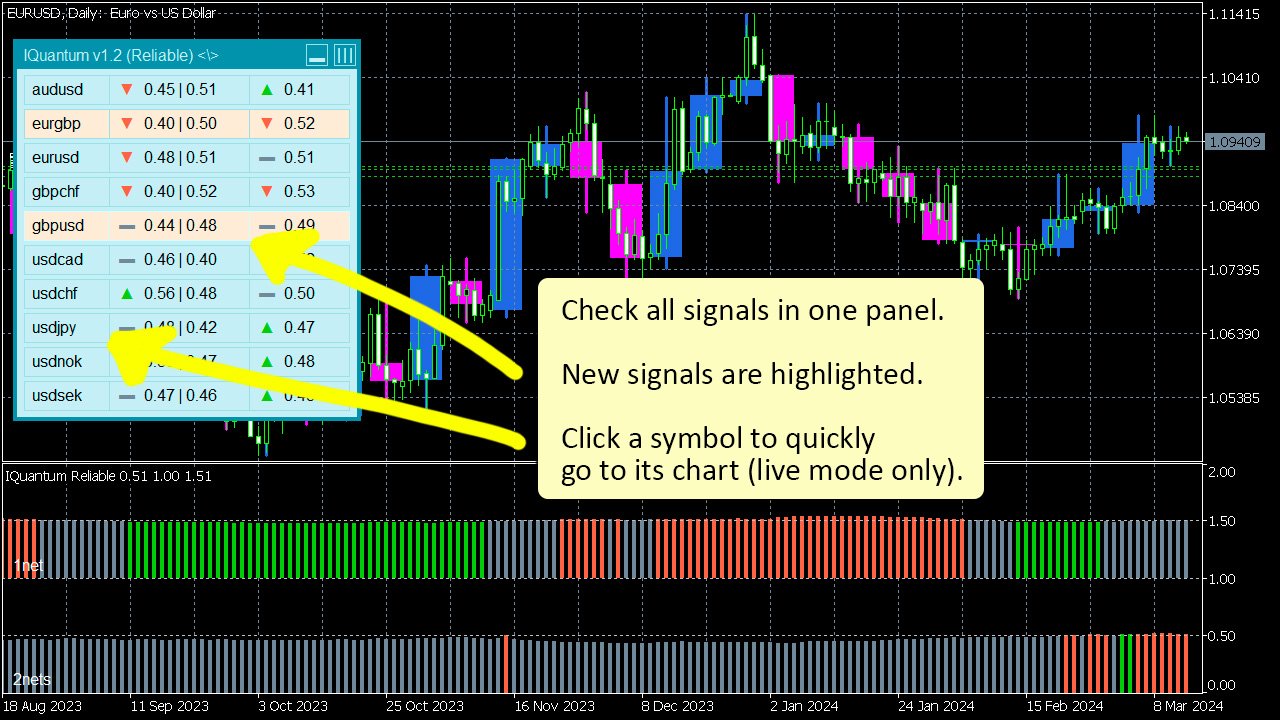
Both histograms show history of signals for the current symbol. You can also see all signals for the current day for all symbols. Click any signal in the panel to quickly go to its chart and see more details.
A correct reading of the indicator
Properties of the Indicator
The lower part of the chart has 2 histograms. I had to correct the numbers of the upper row so that the 2 histograms do not overlap due to the limitation of MetaTrader.
The 2nets histogram shows numbers from 0 to 1. The 1net histogram shows numbers from 1 to 2. That is, I simply added 1 to the numbers of the upper 1net row so that the 2 histograms do not push one another.
Why are the numbers different? For the 2nets model, the number 1 indicates the strongest signal and the number 0 - the weakest signal. This was the approach to train the model, and so the model shows exactly this. For the 1net model, the number 1 indicates the strong signal of sell, and the number 0 - the strong signal of buy. The 1net model was supposed to define weak signals by itself, that is without an external designation.
It is evident that the most important thing for both models is passing the middle value or 0.5. It turns out I corrected this value to 1.5 for the upper row.
Passing the middle value defines whether the signal is strong or weak.
Signals of the indicator are produced by 2 neural models which were trained independently from one another. The inputs for the neural models are normalised prices of the symbols, as well as prices of Gold, Silver and markers of the current day.
Each neural model was trained in 2 ways. The Ultimate mode is an overfitted neural model which produces near-perfect signals in history and absolutely nonsensical rubbish in the unknown (future) period. Despite very precise signals in history, the forecast accuracy of the Ultimate mode is rarely over 20% in the uknown (future) period.
The Reliable mode is a neural model, for which the neural loss in the training period is similar to that in the uknown (future) period. Therefore, the Reliable mode is able to produce signals with the accuracy of over 50% in the uknown (future) period. It is this, and not the historical accuracy of the model, that should be considered as the most important advantage.
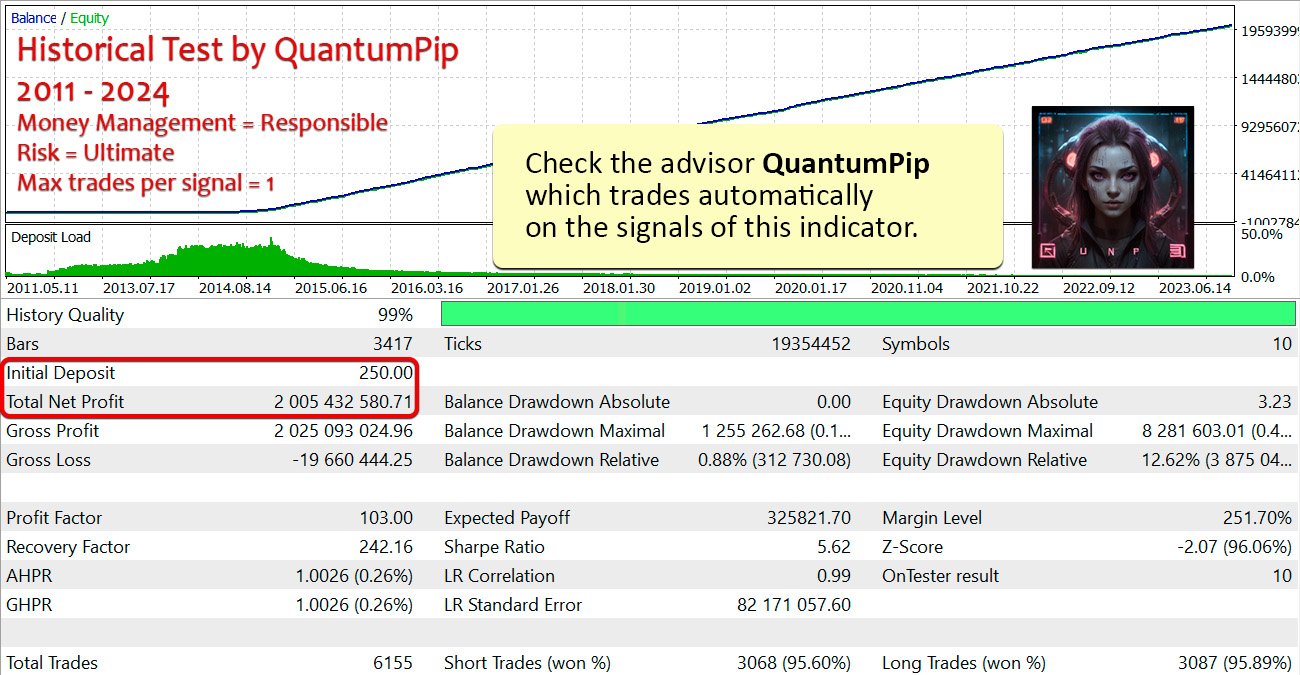
You can read more about machine learning and approaches to the training of this indicator in the description of the advisor which trades on the same signals. The advisor QuantumPip is a fully automated strategy that can open, trail and close its trades. Check it out, maybe it is what you have been looking for!
The indicator calculates a lot of data. So please allow 10-30 seconds on the first run to see all the numbers and forecasts. After the first loading, the indicator should work fast as expected. Calculations are slower at the start of the day and faster in the second half of the day (when prices refresh more often). What does this indicator show?
The indicator shows signals which are calculated by 2 different neural models.The indicator outputs 2 rows of bars (histograms) in the lower part of the chart. The lower row is the neural model with 2 networks (training according to the plan "buy or uncertainty" and "sell or uncertainty"). The upper row is the neural model with 1 network (training according to the plan "buy or sell").
Both histograms show history of signals for the current symbol. You can also see all signals for the current day for all symbols. Click any signal in the panel to quickly go to its chart and see more details.
| 2nets model | 1net model | |
|---|---|---|
| Value close to 0 | Weak signal of buy or sell | Strong signal of buy |
| Value close to 1 | Strong signal of buy or sell | Strong signal of sell |
A correct reading of the indicator
The indicator works in the daily chart. Signals do not change during the day. Each new day produces new signals. Check the signals in the panel or the last bars of the histograms at the start of the day or during the day.
Green signal is a buy. Red signal is a sell. Gray is uncertainty (neither buy nor sell signal is strong enough).
If one model signals a buy and the other signals a sell, it is not recommended to open new trades. You should wait till both models produce the same signal, or one model shows a strong signal and the other shows uncertainty.
Properties of the Indicator
- Name for Gold >> check the name for Gold in your terminal and put it in here. Both Gold and Silver are used for the calculation of inputs.
- Name for Silver >> check the name for Silver in your terminal and put it in here. Both Gold and Silver are used for the calculation of inputs.
- Risk >> Ultimate or Reliable. The Ultimate mode delivers more trades in history, while the Reliable mode has the highest chance of making money in the future period. The Ultimate mode uses a neural model which has perfectly memorized the history, which can entail a higher risk in the future (uknown) period. The Reliable mode uses a neural model, for which the value of loss is similar to the loss in the future period. Therefore, the Reliable mode's profitability can be substantially higher in the future period.
- Max bars >> less bars for a faster calculation.
- Suffix >> it can be handy for those who have symbols with different suffixes in their terminal. Most users can leave this field empty.
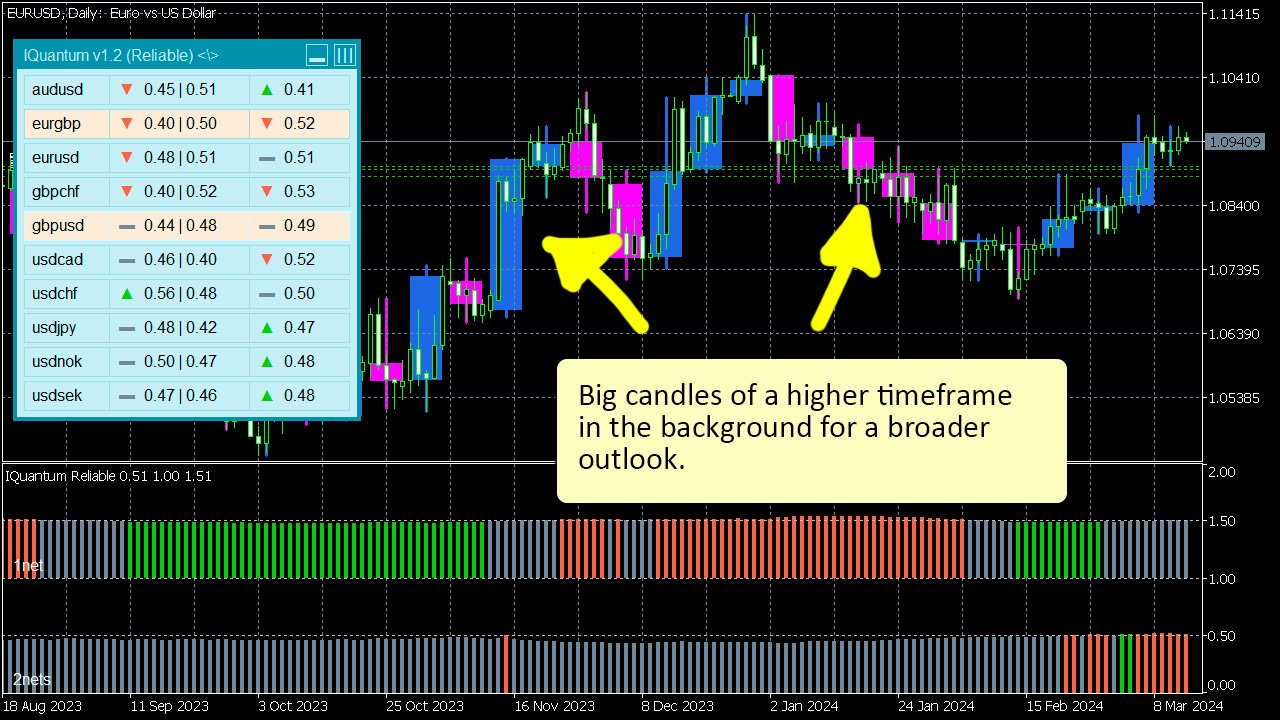
- Show big candles in the background >> it is a flag to show candles of a higher timeframe in the background. It is candles of 4-hour timeframe for all minute charts. It is candles of daily timeframe for all hour charts. And it is candles of weekly timeframe for the current daily chart.
- Show panel with symbols
- Fontsize >> change the fontsize value if rows in the panel do not show correctly.
- Bar color for buy
- Bar color for sell
- Bar color for uncertainty
- Bar width
- Candle color for buy >> it is for big candles in the background of the current chart.
- Candle color for sell >> similar to the previous property.
- AUDUSD, EURGBP, EURUSD, GBPCHF, GBPUSD, USDCAD, USDCHF, USDJPY, USDNOK, USDSEK >> flags to choose symbols, for which the indicator show signals in the panel.
More about the numbers shown by the indicator
The lower part of the chart has 2 histograms. I had to correct the numbers of the upper row so that the 2 histograms do not overlap due to the limitation of MetaTrader.The 2nets histogram shows numbers from 0 to 1. The 1net histogram shows numbers from 1 to 2. That is, I simply added 1 to the numbers of the upper 1net row so that the 2 histograms do not push one another.
Why are the numbers different? For the 2nets model, the number 1 indicates the strongest signal and the number 0 - the weakest signal. This was the approach to train the model, and so the model shows exactly this. For the 1net model, the number 1 indicates the strong signal of sell, and the number 0 - the strong signal of buy. The 1net model was supposed to define weak signals by itself, that is without an external designation.
It is evident that the most important thing for both models is passing the middle value or 0.5. It turns out I corrected this value to 1.5 for the upper row.
Passing the middle value defines whether the signal is strong or weak.