FST Mighty High and Low MT5
- 지표
- Benoit Dumont
- 버전: 1.1
- 활성화: 20
Introducing our revolutionary intra-day trading indicator, meticulously crafted to optimize your trading insights within the 24-hour market cycle.
Immerse yourself in historical data with precision using two distinctive modes - "All History" and "Last X Hours."
Key Features:
- All History Mode
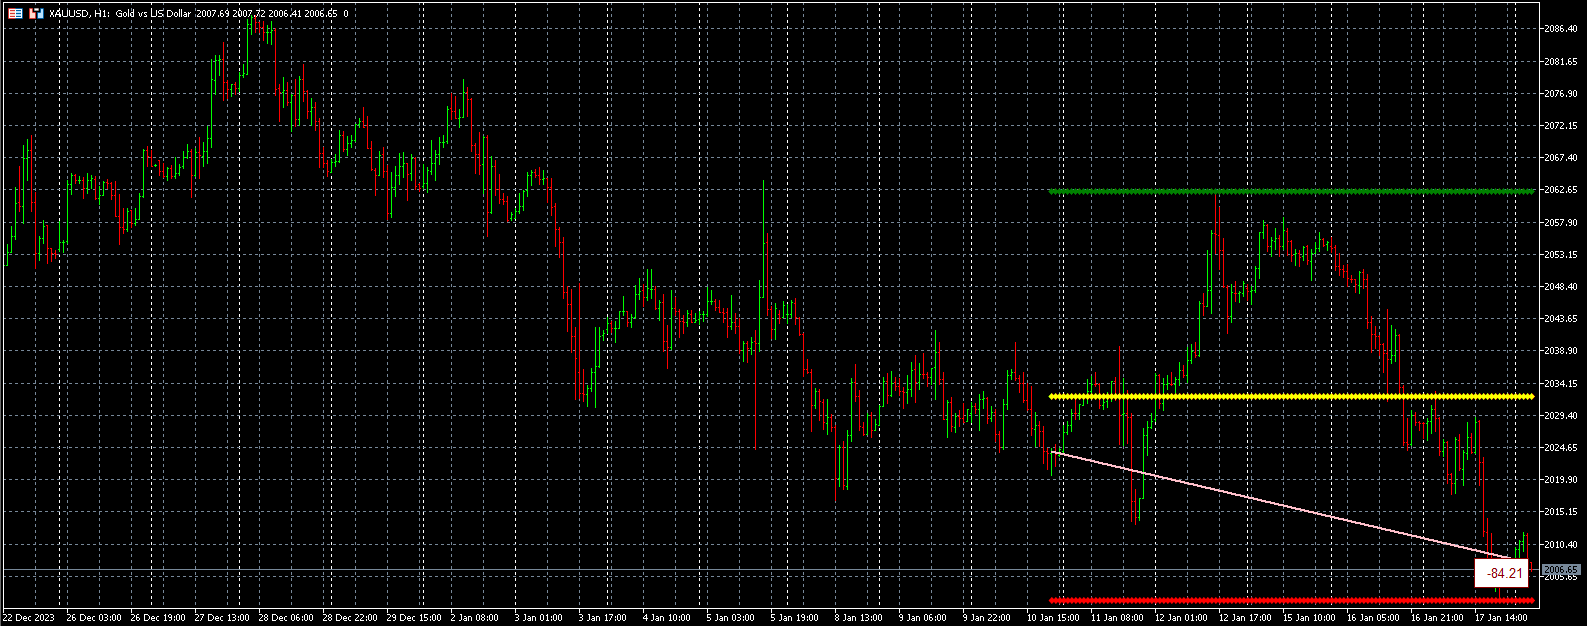
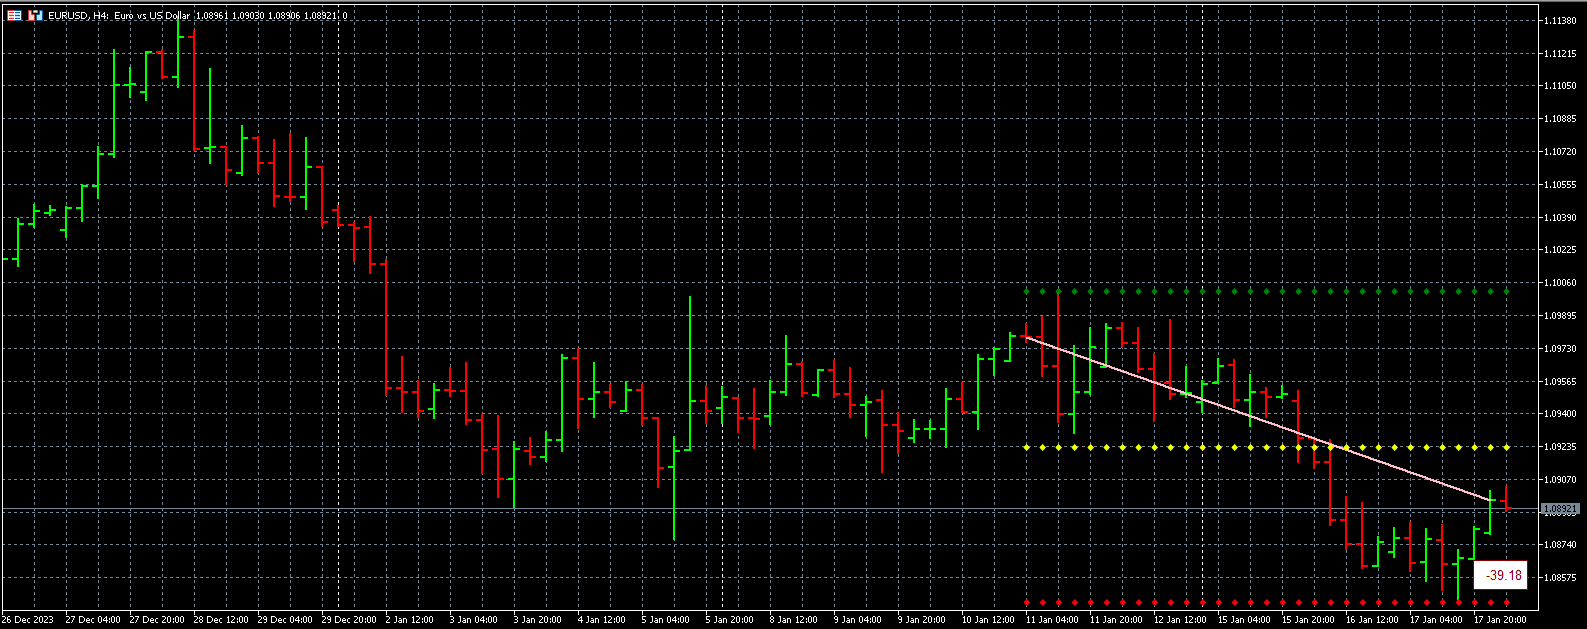
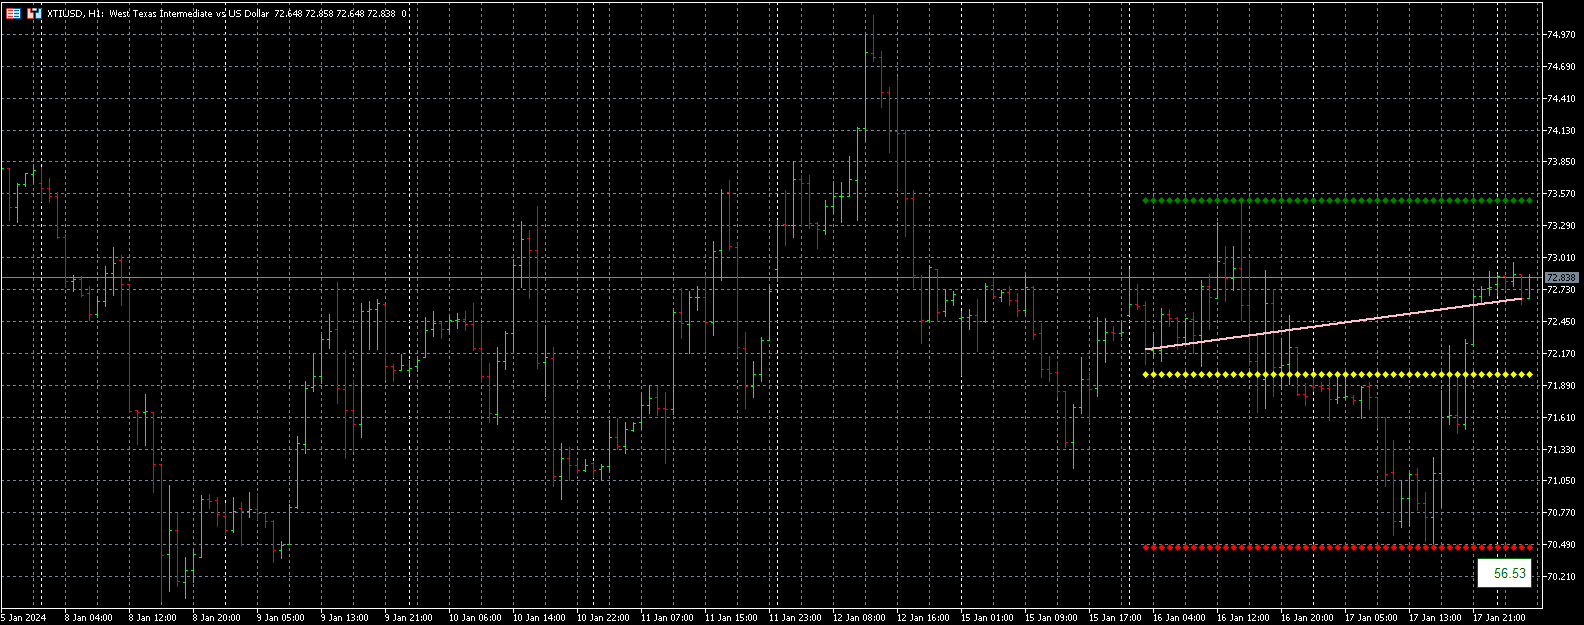
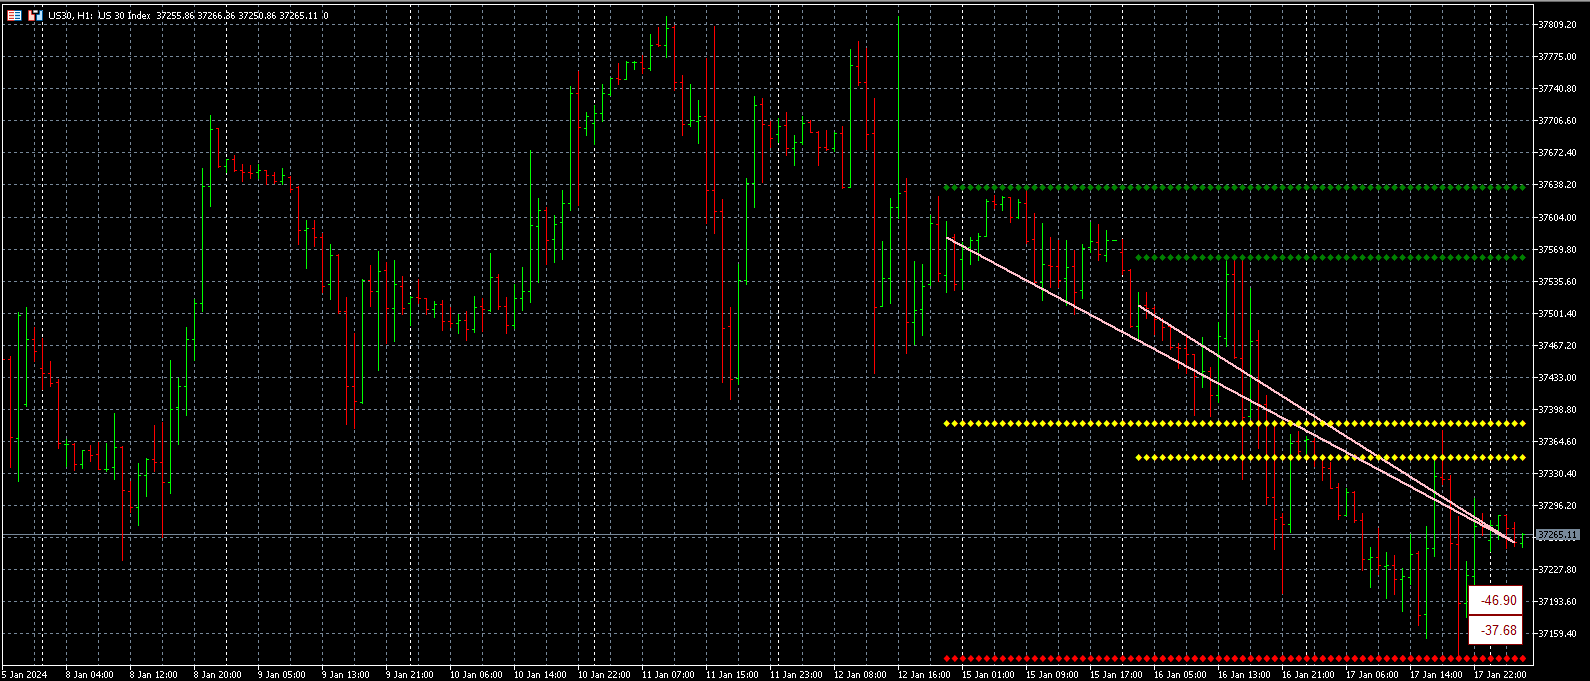
Uncover a comprehensive view of the day's dynamics. Instantly analyze the preceding day's high and low, 50% mid-point, and the open versus close price for the current day. Decode critical patterns to inform your trading decisions.
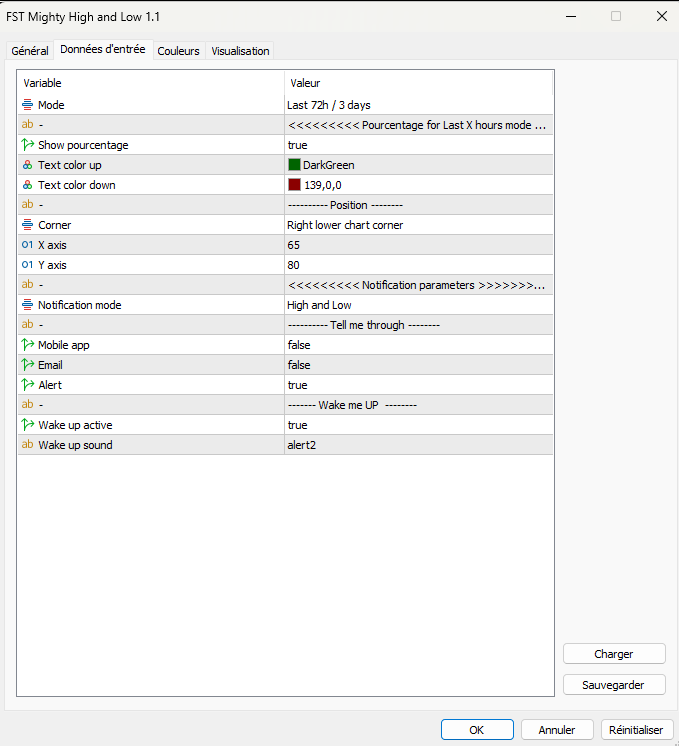
- Last X Hours Mode
Tailor your analysis with flexibility. Choose from 120, 96, 72, 48, 24, 12, 6 or 4 hours to focus on the most recent market trends. Dynamically move along each new bar, revealing high and low values of the selected time range, along with the opening and closing prices.
Experience a unique perspective as the indicator utilizes the middle-point as the 0 value. Witness a positive value when the live data is above the midpoint, and a negative value when below. Easily identify trend direction and horizontal movements for timely decision-making.
- Notification System for Timely Alerts
Stay ahead of market shifts with our robust notification system. Receive alerts through pop-ups, emails, or mobile notifications, ensuring you never miss crucial trading opportunities.
- Sound Alerts for Immediate Action
Enhance your responsiveness with customizable sound alerts. Set unique tones for different scenarios, including an alarm to wake you up for significant market movements.
This advanced indicator empowers intra-day traders with unparalleled precision, allowing for strategic analysis within the entire 24-hour trading cycle.
Effortlessly discern trend directions and horizontal movements, refining your trading strategy.
Elevate your intra-day trading experience with our innovative indicator, unlocking a new level of insight and adaptability.
MT4 version: https://www.mql5.com/en/market/product/110258