MetaTrader 5용 새 Expert Advisor 및 지표 - 195

The Thing is an Expert Advisor (EA) designed for the MetaTrader 5 platform, aimed at automating trading strategies across various financial instruments. It incorporates a range of configurable parameters to support different market conditions and user preferences, allowing for customization without requiring deep knowledge. This EA is structured as a high-frequency trading system, capable of generating frequent signals depending on the timeframe and instrument. Initial testing has indicated suit

Created by imjesstwoone and mickey1984, this trade model attempts to capture the expansion from the 10:00-14:00 EST 4h candle using just 3 simple steps. All of the information presented in this description has been outlined by its creators, all I did was translate it to MQL5. All core settings of the trade model may be edited so that users can test several variations, however this description will cover its default, intended behavior using NQ 5m as an example. Step 1 is to identify our Price Ra

3 Bulls and 3 Bears EA is an expert advisor that uses candlestick patterns and EMA indicator to trade the forex and crypto market with a grid system. The trading strategy of this expert advisor is based on the following logic: this expert buys or sells when a certain number of bear and bull candles with a specific body are formed. The expert advisor also uses a grid system to increase the profitability and reduce the risk of each trade. The grid system works by placing multiple orders at differ

Risk-o-meter is a Risk calculator Panel designed to help people who are new to trading, better understand how much they are risking for potential profit or loss. And also place future orders. Premium Fetaure: 1. Set pending order 2. Set Profit in Cash (RR)
Inputs: 1. Enter your Risk in % or currency 2. Enter your Return Ratio 3. Enter your Lot Size
Results: 1. SL line 2. TP Line
Features: 1. By moving the SL line, lot size will adjust to keep Risk fixed. 2. By moving the TP line, Risk Ration

BreakdownX — это передовой торговый робот для MT5. Он использует стратегию определения уровней поддержки и сопротивления, чтобы выявлять оптимальные точки входа и выхода на рынке. Особенности: Автоматизированная Стратегия Определения Уровней : Наш советник анализирует рынок, используя [заданное число] последних свечей, чтобы точно определить уровни поддержки и сопротивления. Динамический Расчет Размера Позиции : Встроенный механизм оптимизации размера лота на основе текущего баланса и уровня рис
FREE

This Expert Advisor uses a unique combination of trend filtering and price action signals to trade forex currency pairs on the H1 timeframe. NB!!! After purchase send me a private message to receive proper settings. Key Features Uses ATR to filter for long-term trends Places initial trade in direction of prevailing trend Scalps subsequent movements on a fixed time slot Parameters allow adjusting trade filters to suit market conditions Uses tight stop losses and partial profit taking for risk man

Trading Robot Description: 1. Scalping Nature: This trading robot is specifically designed for scalping the EUR/USD currency pair. It is programmed to operate during periods of extremely low volatility in the market. Scalping strategies aim to profit from small price movements, making them particularly sensitive to market conditions and execution speed. 2. Low Movement Emphasis: The robot primarily focuses on executing trades based on minor price fluctuations. Due to the nature of its strategy,

Expert Advisor trading RSI rebounds. The ea was designed and tested for indecies on the 5 minute chart (M5), different timeframes may have varying results. TP, SL and trailing stop are calculated on multiples of the current ATR. Risk is calculated based on the TP.
Quick recommendations for different indecies: GER40 TP:3.5 SL:2 Trail:true/0.1 Upper:80 Lower:20
GER40 TP:4 SL:4 Trail:true/0.1 Upper:68 Lower:24 US100 TP:4 SL:2 Trail:true/0.1 Upper:80 Lower:10
XAUUSD TP:2 SL:2 Trail:true/0.1 Upper:

SmaRT FX v1 - Simple Moving Average Robo Trading for Forex After the purchase, contact me for the full manual and support. SmaRT FX combines moving averages with price action, looking for an entry pattern. It works on all major forex pairs and on several minors. It use stop loss, and take profit, no betting (no grid, no martingale). Plus it is possible to restrict the working time, adding breakevn and manage a trailing stop. To use it with multiple cross, you need to attach an instance to a grap

이 라이브러리를 사용하면 EA를 사용하여 거래를 관리할 수 있으며 설명에 언급된 스크립트 코드와 전체 프로세스를 보여주는 비디오의 데모 예제를 사용하여 모든 EA에 통합하기가 매우 쉽습니다.
- Place Limit, SL Limit, Take Profit Limit 주문
- 플레이스 마켓, SL-마켓, TP-마켓 주문
- 지정가 주문 수정
- 주문 취소
- 쿼리 주문
- 레버리지, 마진 변경
- 위치 정보 얻기
그리고 더...
MT5에 바이낸스 차트가 없는 경우를 제외하고 암호화폐 차트 대여는 선택 사항입니다.
스크립트 데모를 보려면 여기를 클릭하세요.
트레이딩 패널과 거래하고 싶다면 이 제품에 관심이 있으실 것입니다.
이 제품은 Crypto Charting의 애드온입니다.
이 라이브러리를 사용하면 EA를 사용하여 거래를 관리할 수 있으며 설명에 언급된 스크립트 코드와 전체 프로세스를 보여주는 비디오의 데모 예제를 사용하여 모든 EA에 통합하기가 매우 쉽습니

시장 강세 및 심리지표로 매매 결정을 최적화하고 더 이상 추세에 역행하는 트레이딩을 하지 마세요!
정확하고 시기 적절한 정보를 중요시하는 진지한 트레이더를 위해 세심하게 설계된 이 지표는 28개 주요 통화쌍을 매우 간단한 방법으로 한눈에 볼 수 있습니다. 이 도구는 인기도, 강세 또는 약세 추세 강도, 매수자 및 매도자 비율 / MT5 버전을 기준으로 통화쌍의 순위를 매길 수 있습니다.
특징 실시간 추세 강도: 각 통화쌍의 추세 강도를 정확하게 평가하여 거래 기회를 파악할 수 있는 확실한 가이드를 제공합니다. 매수자 및 매도자 분석: 각 통화쌍에 대한 매수 및 매도자 강세 순위를 통해 시장 역학에 대한 즉각적인 통찰력을 얻고 중요한 움직임을 예측할 수 있습니다. 트레이더 관심도: 각 통화쌍에 대한 트레이더 관심도 및 활동 데이터에 액세스하여 새로운 추세와 잠재적 전환점을 더 잘 이해할 수 있습니다. 직관적이고 사용자 지정 가능한 대시보드: 사용하기 쉬운 대시보드를

Stratos Bora is a trading robot for the trading on forex. Designed to harness the power of the Ichimoku Kinko Hyo indicator, it offers 12 strategies to cater to every trader's style.
Whether you're a seasoned trader or just starting out, Stratos Bora provides a seamless trading experience, ensuring you're always at the forefront of market opportunities.
Important Information Revealed Leave a review and contact me via mql5 message to receive additional set files ! D o you want a powerful
FREE

이 제품은 표시기/신호 도구로부터 정보를 수신하고 특정 조건이 충족되면 화살표 또는 알림을 표시합니다.
예를 들어, MA25와 MA50이 교차할 때, SAR이 반전할 때, MACD가 플러스/마이너스를 변경하거나 종가가 볼린저 밴드를 교차할 때 화살표와 알림이 표시됩니다.
구체적인 구성은 샘플 설정 이미지를 참조하세요.
자세한 매뉴얼 및 구성 파일은 다음을 참조하세요.
https://www.mql5.com/en/blogs/post/755082
무료 버전도 다운로드할 수 있습니다.
화살표는 다양한 구성으로 표시될 수 있으며 조합은 상상만큼 무한합니다.
신호 도구 및 표시기에 대한 연결을 설정하는 데 문제가 있는 경우 당사에 문의하여 도움을 받으십시오.
또한 요청 시 스마트폰, 이메일, Slack, Line, Discord 등에 알림을 푸시하고, 최대 8개의 매개변수를 추가하거나 개별 지표에 연결할 수 있습니다. 신호 도구를 보완하거나 이벤트 알림 기능으로 사용할 수
FREE

Crypto Monkey는 비트코인 거래를 위해 특별히 개발된 저희 자동 거래 로봇 제품군의 최신 제품입니다. 미니멀한 디자인으로 기존 출시된 앱의 디자인과 완벽하게 어우러집니다. 이 온라인 스토어에서 Crypto Monkey는 매수 및 매도 시장가 주문을 생성할 수 있는 사전 정의된 진입 규칙을 제공합니다. 또한, 로봇에는 이익실현(TP), 손절매(SL), 추적 손절매(TS), 손익분기점(BE)과 같은 청산 신호 규칙도 포함되어 있습니다. 기본적으로 로봇은 BTCUSD 통화쌍을 거래하도록 설정되어 있으며, H1 시간대에서 작동하므로 해당 통화쌍에 대한 추가 작업이 필요하지 않습니다. 이 플랫폼에서 제공되는 다른 거래 로봇(Expert Advisors)과 함께 로봇을 더 광범위한 포트폴리오에 통합하려는 경우, 그렇게 할 수 있습니다. LINK의 경우 , 각 로봇에 고유 ID 또는 매직 넘버를 할당해야 합니다. 또한 로봇의 거래 빈도가 높지 않으

마를리 인디케이터: MT4 및 MT5에서의 정밀 트레이딩 MT4 및 MT5에서 뛰어난 신호 정확성을 제공하는 마를리 인디케이터로 트레이딩을 향상시키세요. 이 다재다능한 도구는 암호화폐와 외환 시장에 최적화되어 있으며, 귀하의 트레이딩 전략에 정밀함과 유연성을 제공합니다. MT4와의 원활한 통합: MT4 플랫폼 사용자를 위해, 마를리 인디케이터는 완벽하게 호환되며 여기 에서 접근할 수 있습니다. 암호화폐 및 외환 시장 최적화: 암호화폐 우수성 : 마를리 인디케이터는 동적인 암호화폐 시장에 맞춰 특별히 조정되어, 암호화폐 트레이딩을 탐색하는 데 필수적인 정확하고 시기적절한 신호를 제공합니다. 외환 친화적 기본 설정 : 외환 시장에서도 마찬가지로 효과적이며, 다양한 시장 조건에서의 다용도성과 신뢰성을 위해 조정되어 있습니다. 주요 기능: 유연한 표시 옵션 : 시각적으로 두드러지는 화살표 또는 정보가 풍부한 텍스트 라벨 중에서 선호하는 신호 표시 방법을 선택하세요. 조절 가능한 감도
피벗 포인트 다중 기호 스캐너는 Floor, Woodie, Camarilla, Demark 또는 Fibonacci 피벗 포인트에 대해 마켓워치에서 사용할 수 있는 모든 기호를 스캔합니다.
원하는 기간을 선택하여 피벗 포인트를 계산하고 가격이 이러한 지지 및 저항 수준에 도달하면 알림을 받을 수 있습니다.
시각적 피벗 포인트의 경우 이 제품에 관심이 있을 수 있습니다: https://www.mql5.com/en/market/product/110072
다양한 경고 유형을 선택하는 옵션이 있습니다.
밀리초 단위로 스캔할 빈도를 선택하고 설정할 수 있습니다.
1000은 시장 시계의 모든 기호를 매초마다 검색한다는 의미입니다.
제품 특징
1. 터미널 알림
2. 이메일 알림
3. 푸시 알림

거래 정밀도를 높이세요. Candlestick Pattern Alert MT5 지표는 주요 캔들 패턴을 신속히 감지하고 실시간 알림을 제공하는 강력한 도구로, 높은 확률의 설정에 트레이더가 대응할 수 있도록 합니다. 1990년대 스티브 니슨에 의해 대중화된 일본 캔들 차트 원리에 기반한 이 지표는 해머, 도지, 엔굴핑 같은 패턴을 통해 시장 심리를 해독하는 능력으로 시장, 외환, 암호화폐, 주식 트레이더들에게 사랑받습니다. 수동 분석을 간소화하여 시간을 절약하고, 정확성을 높이며, 기회 손실을 줄입니다—EURUSD, BTCUSD, XAUUSD 같은 변동성 시장에서 트렌드 반전이나 지속을 활용하려는 스캘퍼, 데이 트레이더, 스윙 트레이더에게 완벽합니다. Candlestick Pattern Alert MT5는 즉각적인 패턴 인식을 위해 차트에 녹색(매수)과 적색(매도) 화살표를 오버레이하며, 명확성을 위해 사용자 정의 텍스트 레이블(기본 크기7, 오프셋20%)을 제공합니다. 14가지 주
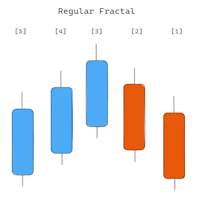
표시기는 더 높은 기간의 프랙탈을 표시합니다. 프랙탈에는 '일반 프랙탈'과 'BW 프랙탈'의 두 가지 유형을 표시할 수 있습니다. 프랙탈 'UP'의 형성을 고려하십시오. '일반 프랙탈'은 이후의 '고가'(중앙 막대의 왼쪽과 오른쪽)가 더 작은 매우 엄격한 프랙탈입니다. 반면 'BW Fractal'에는 단 하나의 조건이 있습니다. 중앙 막대(가격 '높음')가 가장 높아야 합니다. 시각적으로 이 두 모드의 차이점은 다이어그램 1에서 확인할 수 있습니다. '더 높은 기간' 매개변수는 현재 매개변수보다 커야 하며, 이 요구 사항이 충족되지 않으면 오류에 대한 설명이 포함된 경고가 발생하고 표시기가 작동하지 않습니다. 또한 최적화를 위해 새로운 바에서만 검색이 이루어집니다. 또한 '다운로드 기록 강제' 옵션도 무시할 수 없습니다. 이 옵션은 주말에 잘 작동합니다. 높은 시간대 기록을 강제로 다운로드합니다.

An ICT fair value gap is a trading concept that identifies market imbalances based on a three-candle sequence. The middle candle has a large body while the adjacent candles have upper and lower wicks that do not overlap with the middle candle. This formation suggests that there is an imbalance where buying and selling powers are not equal. Settings Minimum size of FVG (pips) -> FVGs less than the indicated pips will be not be drawn Show touched FVGs Normal FVG color -> color of FVG that hasn't
FREE

Blitz FX Swing Trader - Master the Markets with Precision Introducing Blitz FX Swing Trader, your go-to solution for mastering the art of swing trading on the Forex market. Engineered to perfection for the 1-hour timeframe, this expertly crafted MetaTrader 5 EA combines advanced algorithms with strategic precision to capture swing opportunities that align with your trading goals
*Set Files Available, Just send message or comment in the comment section*
Key Features: 1. **Optimized for 1-Hour

This is a simple order block locator. Searched for the existence of order blocks only at extremums. If you want multi criteria order block location check my other indicator which is more powerful here These order blocks are ICT order blocks without any buttering.
The indicator can be a useful tool for detecting reversals, continuations. You can also use the indicator as confluence with your other tools
FREE

One of the most powerful and important ICT concepts is the Power of 3. It explains the IPDA (Interbank Price Delivery Algorithm) phases. PO3 simply means there are 3 things that the market maker's algorithm do with price:
Accumulation, Manipulation and Distribution
ICT tells us how its important to identify the weekly candle expansion and then try to enter above or below the daily open, in the direction of the weekly expansion.
This handy indicator here helps you keep track of the weekly and

T rade all crypto pairs including BTCUSD BITCOIN BTCEUR LTC ETH etc (any pair with a spread over 100 including US100 )
CryptoHFT AI is not just another Expert Advisor. It's your gateway to a new era of intelligent, adaptive trading in the volatile world of cryptocurrencies. Powered by a 5-neuron AI engine, CryptoHFT learns from your chosen timeframe - days, weeks, months, or even years - to discover the optimal settings for any crypto pair
MT4 version can be found here
Unl

Introducing Mini Orders Executor , your powerful and efficient trading companion designed to seamlessly execute orders directly from a user-specified text file . This innovative trading tool streamlines your trading process, providing a convenient and automated solution for executing trades with precision and speed.
Key Features :
**Text File Integration:** Mini Orders Executor is designed to effortlessly read and interpret orders from a plain text file, eliminating the need
FREE

Multi-currency trading on one chart!
Creation and management of positions with trailing and breakeven, risk management and other useful functions. To fix profits, the Target profit parameter is provided; if it is greater than zero, all positions will be closed if the set value is exceeded. All positions and orders have set Stop Loss and Take profit. For multi-currency trading, taking into account the impact of news and switching symbols on the chart, it is useful to use the News impact indicato
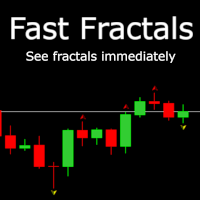
Info: It's like built in Fractals indicator but faster. Usually it shows the signal after 2 bars but FastFractals indicator shows signals immediately and that's is incredible. You can create scalp strategies with it or trade yourself. This indicator uses neural network to analyze price graph and predict. It was trained on 4 hours interval on EURUSD pair, but you can use it with different periods and instruments. There is only one minus in this indicator, it hasn't got 100% accuracy. See pictures

Do you believe that financial markets and celestial bodies operate in separate realms? Our indicator begs to differ! Based on the innovative theory of William Gann, which emphasizes the influence of celestial planet movements on financial market dynamics, we present to you the "Gann Planetary Lines Indicator". Features of the Indicator : Precision : Accurate projection of the 360 degrees of planetary orbits onto price charts. Advanced Customization : Ability to display or hide any planet line,

3 experts in 1 expert
Strategy based on price action
Made specifically for the best forex currency pairs
Can be used in the best time frame of the market
at a very reasonable price This expert is basically 3 different experts. But we have combined these 3 experts in 1 expert so that you can use 3 experts at the lowest price.
All three strategies are based on price action. But based on different trends. Long term, medium term and short term
Attributes : Can be used in the EURUSD , AUDUSD , USDC

AFRIBOLD QUANTUM OPULENCE
"Afribold Quantum Opulence, we are Pioneering a New Era of Innovative Creation through Intelligent Trading"
Introduction In the dynamic world of financial markets, staying ahead of the curve is essential for investors. Afribold Quantum Opulence emerges as a beacon of innovation, revolutionizing the landscape of automated trading. This cutting-edge trading robot has not only garnered attention but has also earned a reputation as one of best EA's, thanks to its remarkab

Discover a New Wave Trading Strategy - Suitable for Currency Pairs like AUDUSD.s Strategy Highlights : Specially Designed Trend Indicator Graphics : Our strategy offers a unique graphical interface to help traders identify and capitalize on market fluctuations. Backtesting Validation : Traders are encouraged to backtest currency pairs like AUDUSD.s to validate the effectiveness of our strategy. Flexible Time Frames : Default recommendation is to trade in the 15-minute (M15) time frame,

The " Pure View " indicator is designed to quickly display and hide indicators on the chart. Description
1. Currently Pure View works with Stochastic, MACD, RSI indicators 2. Displaying and hiding indicators occurs using hot keys 3. The key combination Shift + C will display or hide the "Stochastic" indicator on the chart 4. The key combination Shift + V will display or hide the "RSI" indicator on the chart 5. The key combination Shift + B will display or hide the "MACD" indicator on the chart
A
FREE

The trade strategy based on BeakOut Box Session Input Range Start, Range Duration and Range End Time Trading.
The BreakOut Mode:
ONE SIGNAL or TWO SIGNAL ->> Tutorial here
Automatic Calculation Lotsize Mode:
1.Fixed lotsize
2.Based on Money/trade
3.Based on Risk Percent
Day of Week Filter:
Input The Range Filter Based on What do you want to calculate.
Stop Loss and Take Profit Based on Range Size Percent (%) New Version 2.0
Input Stop Loss and Take Profit Based on Points (Risk Reward) -

The program is use to copy trading from MT5 to MT4 and MT5 on local PC or copy over the Internet . Now you can easy copy trades to any where or share to friends. Only run one Flash Server on VPS, also need allow the apps if you turn on Windows Firewall. Can not add more than 20 account copier to server at same time, include both MT4 and MT5 Get free Copier EA for MT4 and MT5 (only receive signal), download here Instants copy, speed smaller 0.1 seconds, easy to setup How to setup and guide

EA Break Session – Expert Advisor for Breakout & Retest Trading EA Break Session is a powerful Forex Expert Advisor (EA) designed to capture high-probability trading opportunities during breakout and retest setups in key market sessions (London, New York, and Asia). With advanced algorithms, EA Break Session automatically detects support & resistance levels , draws session boxes , and executes precise trades based on breakout and retest strategies.
Key Features of EA Break Session : Automate

PropTradeMaster mt5 Live signal
For additional in-depth details, kindly refer to the Manual Guide Revolutionize Your Trading with PropTradeMaster: A Precision Engineered Forex Robot Unleash the power of precision and innovation in your proprietary trading journey with PropTradeMaster, a cutting-edge Expert Advisor (EA) meticulously designed for MT4. Elevate your trading experience with this exceptional tool, tailored to exceed the stringent standards of prop trading firms. Embark on a

The "ZScore Quantum Edge" is based on an advanced algorithm that combines volume analysis and price movement, providing a clear and accurate representation of market trends. Key Features: In-Depth Trend Analysis : The indicator uses a configurable period for trend analysis, allowing traders to adjust the indicator's sensitivity according to their trading strategies. Data Smoothing : With an adjustable range for data smoothing, the "ZScore Quantum Edge" offers a clearer view of the market, minimi

Operating Principle: The "RSDForce" merges trading volume analysis and price movements to provide valuable market insights. Here's how it works: Volume and Price Analysis : The indicator examines the trading volume (quantity of traded assets) and price variations over time. Market Force Calculation : It calculates a value that reflects the market's 'force', indicating whether the price trend is strong and based on substantial trading volume. Simple Visualization : The result is displayed as a li

"Introducing Dynamic Supply and demand Pro – Your Ultimate Supply and Demand Trading Companion! Unleash the power of precision with this advanced indicator designed for traders seeking unparalleled market insights. Dynamic Supply and demand Pro dynamically identifies key reversal zones, showcasing the delicate dance between supply and demand forces.
This cutting-edge tool provides a comprehensive view of the market, highlighting potential turning points with pinpoint accuracy. Witness the ebb a
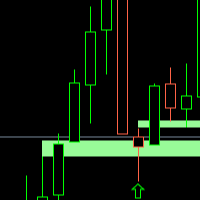
FVG WATCHER is an indicator that helps traders identify fair value gaps in the market. The indicator draws fair value gaps and alerts the user when the fair value gap has been swept. It allows users to specify how it should be swept, what time range to alert, and the size of the fair value gap to alert. It also allows the user to apply a moving average trend filter for better choice of alerts. The indicator also allows push mobile notifications. What makes FVG Watcher special is that it can be

The "Visa + Doji Strategy EA" is a concept in automated trading that combines the principles of Visa and Doji candlestick patterns in its algorithm. Here's a detailed description: Visa Component**: This part of the strategy utilizes an analogy to the Visa payment system, symbolizing fast, reliable, and global transactions. In trading terms, it represents swift entry and exit points in the market, identifying opportunities with high potential and minimal delay. The Visa component may use indicat
FREE

SterlingSniperBot is an advanced trading algorithm meticulously designed for the GBP/USD currency pair, specifically tailored to operate on 4-hour bars and synchronize seamlessly with brokers in the UTC+2 time zone. This sophisticated bot stands out as a precision instrument in the world of forex trading. Key Features: Timeframe Optimization: Operating exclusively on 4-hour bars, SterlingSniperBot focuses on capturing strategic trading opportunities within this specific time frame, aligning with
FREE

Blitz Trade Scalper - Precision Scalping Made Effortless Experience the next level of precision scalping with Blitz Trade Scalper, is a robust MetaTrader 5 Expert Advisor designed for the 15-minute timeframe. Embrace the world of high-frequency trading with an EA that requires no adjustments – simply activate, and watch as it navigates the markets with surgical precision.
IMPORTANT!! Bot works best on the EURUSD and GBPUSD chart. For other pairs you can back test to test the performance in
FREE
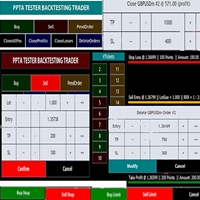
TESTER BACK TESTING AND TRADING MANAGER THE ONLY MT5 TOOL YOU CAN USE FOR BOTH LIVE TRADING AND BACKTESTING All functions can be used in both live trading and backtesting in MT5 Strategy Tester. This is one tool with many functionalities. Your ONLY tool for both trade management (live trading) and Backtesting in MQL5 Strategy Tester. The Tester Backtesting and Trading Manager can help you: 1. Trade Orders: a. Open Market Execution Orders (Buy or Sell)
b. Open Pending Orders (Buy Limit, Buy Stop

The EA supports closing orders based on the preset amount. It can close all orders on all pairs, or it can close orders based on Magic ID. Button "Close All" manual Input - Magic Number: Magic Number = 0: Close All pairs Magic Number diffrent 0: Close All with Magic - Money TP: Profitable in money. the EA will close all orders - Money SL: Loss in money. the EA will close all orders Contact: t.me/nguyenvanbo128
FREE

RsiGridEA ist ein vollautomatischer Handelsroboter (Expert Advisor) für den MT5.
Er handelt 24/5 ohne Nachrichtenfilter, er ist einfach einzurichten und funktioniert mit den meisten MT5 Forex Brokern.
Plattform: Metatrader 5 Währungspaare: Alle Währungspaare auch Indices Zeitrahmen: H1 Zeitrahmen und Alle anderen. Stunden: rund um die Uhr DD : bis zu 50% Einzahlung: ab 100 Euro für Lot 0,01 Strategie: RSI Grid - Strategie
Das System: Hauptsignal Rsi 70/30 Strategie Variable und

Description (strategy and features) The Apex is the ideal EA to add to your existing portfolio or if you are just starting with automatic trading. This EA trades both mean reversing and trend following strategies. With four strategies built into one EA you can create your own portfolio mix of strategies which best suit your trading style. Each strategy is based on basic reversal or trend following concepts. Recommended Time Frames: The strategies are designed for checking and taking trades at

Right hand очень точно воспроизводит колебания цены. Когда рынок растет, кривая Right hand идет вверх. Хотя иногда бывает так, что кривая идет вверх, в то время как цена консолидируется и нет тренда вверх. Аналогично, когда рынок падает, кривая тоже убивает, исключения возникают так же в зоне консолидация рынка. Анализ большого количества графиков Индекса Направленнрго Тренда ( DTI )позволяет выявить его специальные характеристики, полезные при отслеживании тренда. В положительной области т.е

Tatino Super Signals is Non Repaint Indicator for Binary Option trading and Forex trading. Recommendations:
Timeframe: All timeframes. For best results we recommend using it on M1, M5 and M15 timeframes. Currency pairs: All Pairs Account type: All Type Broker time: Any Brokers : Alls Binary Trading : Expired 1 Candle Buffer Buy=1, Sell=0, Entry Next Candle Recommended Forex trading stop loss : 15 pips Recommended Forex tradingTake profit levels : 15 pips
Specifications:
Does not repaint Pa

RFX5 Bull Bear Powers indicator shows the absolute power of bulls and bears controlling the market. Both powers are shown simultaneously with red and green colors for bear and bull powers respectively. When red line goes over the green line it means that bears are controlling the market. When green line goes over the red line it means that bulls are controlling the market. The green/red horizontal symbol line at the bottom of the indicators shows which party has more strength. Time Frame: M3

This is an Expert Advisor created based on trend analysis, both bull and bear trends With accurate trend analysis, it helps you to trade with the trendline system With a scalping strategy, you don't need to worry when trading forex
Recommended Settings: - 1000usd for 1 forex pair -1000 usd for 0.01 lot or 0.1% risk - Timeframe M15 and Higher
M15 mql5 live : https://www.mql5.com/en/signals/2161359 H1 mql5 live : https://www.mql5.com/en/signals/2221408

Hello everyone! I am a professional MQL programmer , Making EAs, Indicators and Trading Tools for my clients all over the world. I build 3-7 programs every week but I seldomly sell any ready-made Robots. Because I am fastidious and good strategy is so few... this EA is the only one so far I think its good enough to be published here.
As we all know, the Ichimoku indicator has become world popular for decades, but still, only few people knows the right way of using it, and if we check the clo

기본 공급 수요 지표는 시장 분석을 향상시키고 모든 차트에서 주요 기회 영역을 식별하는 데 도움이 되도록 설계된 강력한 도구입니다. 직관적이고 사용하기 쉬운 인터페이스를 갖춘 이 무료 메타트레이더 지표는 공급 및 수요 영역을 명확하게 볼 수 있어 보다 정보에 입각한 정확한 거래 결정을 내릴 수 있습니다 / 무료 MT4 버전 이 지표에 대한 대시보드 스캐너: ( Basic Supply Demand Dashboard )
특징
지표는 차트에서 공급 및 수요 영역을 자동으로 스캔하여 지루한 수동 분석이 필요하지 않습니다. 가장 가까운 공급 및 수요 구역까지의 남은 거리 그래픽 표시 공급 구역은 하나의 고유 한 색상으로 강조 표시되고 수요 구역은 다른 색상으로 표시되어 빠르고 정확한 해석이 용이합니다. 인디케이터는 가장 가까운 공급 또는 수요 구간과 차트상의 현재 가격 사이의 핍 단위 거리를 자동으로 계산하여 명확하고 정량화할 수 있는 기준을 제공합니다. 핍 단위의 거리가 차트에 명확하
FREE

MT5용 바이낸스 거래 도구
1. 이 제품은 웹소켓 실시간 차트, 과거 차트, 그리고 MT5 터미널 재시작 시 자동 업데이트 기능을 제공하여 수동 개입 없이 원활하게 작동하여 바이낸스 거래를 원활하게 진행할 수 있도록 지원합니다.
현물 및 선물 거래, 실시간 차트 및 과거 데이터 제공
차트 기능:
1. 웹소켓(WSS)을 통한 실시간 OHLC 차트
2. API를 통한 과거 데이터 업데이트
3. MT5를 열 때마다 차트에 과거 데이터 자동 업데이트
4. M1부터 MN1까지 모든 시간대 지원
5. 사용 가능한 데이터: 시가 고점, 저점, 종가, 실제 거래량 및 틱 거래량
6. 전략 테스터를 사용하여 암호화폐 데이터를 기반으로 모든 전략을 EA(Expert Advisor)로 백테스트할 수 있습니다.
차트 및 과거 데이터 지침:
1. MT5 옵션에 URL을 추가합니다.
2. 모든 차트에 유틸리티를 로드하고 모드를 라이브로 선택한 후, 거래소(예: 바이낸스 현물)를 선택하고, 최초

이 대시보드는 선택한 기호에 대한 거래 전략에 따라 스캘핑 모드와 장기 모드 모두에서 차트의 공급 및 수요 영역을 검색하고 표시합니다. 또한 대시보드의 스캐너 모드를 통해 원하는 모든 기호를 한눈에 확인하고 적합한 위치를 놓치지 않도록 도와줍니다 / MT4 버전 .
무료 보조지표: Basic Supply Demand
특징 여러 통화쌍에 대한 거래 기회를 볼 수 있으며, 공급 및 수요 영역에 대한 근접성에 따라 순위가 매겨진 모든 쌍을 명확하고 간결하게 볼 수 있습니다. 색상부터 감지 매개변수까지 특정 요구에 맞게 사용자 지정 설정 가능
주요 입력 Indicator mode : 표시기 모드 또는 새로운 기능이 포함된 패널 모드 중에서 선택 가능 Symbols : "28개 주요 통화쌍" 또는 "선택한 심볼" 중에서 선택 Selected Symbols : 쉼표로 구분하여 모니터링하려는 원하는 심볼("EURUSD, GBPUSD, XAUUSD")을 선택합니다. 브로

ATTENTION For a free trial version, visit my website. Manual QUANTUM RiskGuard Management — Your ultimate ally for uncompromising trading. Lot Calculator — Automatic lot size calculation. Quantum — Automatic risk to maximize profits and reduce drawdowns. Automatic Journal — Included and freely downloadable from my website. Automatic Screenshot — Two screenshots: one at entry and one at exit. Partial Profit — Smartly managed partial exits. Smartphone Trading — Place orders from your mobile, mana

This is the best Support and Resistance Indicator on the market, and it shows both confirmed Support and Resistance as well as Retests. Support & Resistance: Support marks where buying demand halts price declines, acting as a safety net. Resistance caps price surges, driven by selling pressure. Traders leverage these levels to predict reversals, plan entries, exits, and manage risks, making them trading's fundamental guideposts. Join To Learn Market Depth - https://www.mql5.com/en/channels/su
FREE

High Frequency Trader for Gold ! Meaning this EA can trade many times in a second to take advantage of news and fast movements while waiting patiently in slow markets for tiny moves to take advantage of .
MT4 version can be found here Introducing the future of XAUUSD trading: EA Gold HFT The AI-powered expert advisor that learns and adapts to the market EA Gold HFT is a new trading tool that uses artificial intelligence to help you take advantage of gold volatility , even if you're a beginne
DESCRIPTION:
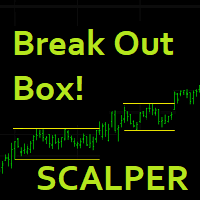
Break Out Box Scalper (ED) is an Expert Advisor that enters operations into the market by detecting the BREAKOUT of 'Boxes' made up of a certain number of candles on one side and a certain number of points on the other.
Once it enters the market, it will seek to reach the TP or exit through SL.
The EA has proven to be very effective, especially in the SYNTHETIC INDICES, achieving interesting returns in both Demo and Real with a controlled Drop Down (the author uses it daily in h

Cobra Pivot Points는 DEMO를 다운로드하여 직접 백테스트할 수 있는 가장 최적화된 피벗 포인트를 표시하는 지표입니다.
1. 두 가지 최고의 피벗 모드 선택: Cobra Pivots 또는 Camrilla Pivots
2. D1에 국한되지 않고 원하는 시간대를 사용할 수 있습니다.
3. Shift 매개변수를 사용하면 전일 고저 종가 값으로 플레이할 수 있습니다. 1 = 이전 막대, 2 = 이전 막대 앞의 막대 등. 이 매개변수는 피벗에 대한 연구 및 개발에 도움이 됩니다.
4. 레벨 터치 시 경고, 이메일 또는 푸시 알림을 한 번 누릅니다. 레벨을 터치하면 피벗 레벨이 완화된 것으로 간주되어 다시 경고하지 않습니다. 알림을 다시 받으려면 기간을 변경하여 알림을 재설정해야 합니다.
5. 선 색상, 선 스타일, 선 너비, 텍스트 색상 및 글꼴을 완전히 사용자 정의합니다.
Cobra Pivots는 LZone(스캘핑을 위해 매우 가까운 레벨), NZone(시장이 통
다중 통화 이전 캔들 또는 이전 막대 스캐너를 사용하면 지표 설정에서 선택한 사용자 정의 기간으로 다중 기호 차트를 스캔할 수 있습니다.
제품 기준 : https://www.mql5.com/en/market/product/78657
전날 고가, 전주 고가, 전월 고저 또는 사용자 정의 기간에 대한 다중 기호를 스캔하는 데 사용할 수 있습니다. 이전 4시간 차트 고저
노이즈를 필터링하고 가격이 고점 또는 저점에 도달할 때 방향 알림을 제공합니다.
전략은 간단합니다. 전날, 주 또는 월 최고가에 도달하면 5분과 같은 더 짧은 시간 내에 가격이 거부되는 것으로 보입니다.
다양한 경고 유형을 선택하는 옵션이 있습니다.
밀리초 단위로 스캔할 빈도를 선택하고 설정할 수 있습니다.
1000은 시장 시계의 모든 기호를 매초마다 검색한다는 의미입니다.
제품 특징
1. 터미널 알림
2. 이메일 알림
3. 푸시 알림

Ai teulendeu seupoteo(D Originals).
oehwan-ui mollag.
ulineun jongjong "beulokeolijiga eotteohge don-eul beonayo?"lago mudgo, jag-eun geolaeeseo seunglihan geos-eul chughahabnida.
hajiman (D Originals)leul sayonghago namyeon "naneun eotteohge haluachim-e bujaga dwaessji?"lago jamunhage doel geos-ibnida.
So Deep, Action-eun mogsoliboda deo keuge malhabnida.
Ai Trend Spotterleul sayonghamyeon da-eum-eul dulyeowohaji maseyo.
*sijang jojag
*sijang banjeon
* jeogyeogsu jin-ib mich jonjae
A news trading expert using deferred multi-directional stop orders. Prior to the release of significant news, the advisor places pending BuyStop and SellStop orders, closing the opposite one in case either is triggered by the market. The expert is integrated with an mql5 calendar for a year, allowing you to customize the advisor's parameters for any event from the calendar and test it on historical data. Features: Before starting the testing, attach the expert to the trading chart (The expert wi

Introducing Orders Executor , your powerful and efficient trading companion designed to seamlessly execute orders directly from a user-specified text file . This innovative trading tool streamlines your trading process, providing a convenient and automated solution for executing trades with precision and speed.
Key Features :
**Text File Integration:** Orders Executor is designed to effortlessly read and interpret orders from a plain text file, eliminating the need for manual input. Simpl

This is my latest Free version for Gold. With optimized parameters and user-friendly features, this version is likely very easy to use and highly effective. You can customize TP and SL parameters as you wish, but the default settings should work well for you without the need for further adjustments. This version is designed for the M5. This version does not require a large capital investment; only $100-$200 is sufficient for Golden Square X to run and generate profits for you. Based on backtest
FREE

Prop Challenger EA is based on candlestick formation and trading time. Prop Challenger EA's strategy is to recognize the candlestick formation and position yourself approximately 3 minutes after the New York Stock Exchange opens. The positions that are in plus are accompanied by additional purchases and tight traillingstop! EA was tested in the XAUUSD M5, H1 strategy tester and adapted to this symbol. Experience trading at the highest level. With very small draw-down and the certainty of large l
FREE

Fibonacci Master Pro is an advanced Fibonacci projection indicator designed to optimize your trading strategies. It incorporates the principles of Fibonacci technical analysis, providing precise projections and entry and exit opportunities in the market.
Fibonacci Master Pro draws upward and downward Fibonnaci Projections based on the maximum and minimum value of the candle you specify.
Key Features :
**Accurate Projections:** Using sophisticated algorithms, Fibonacci Master Pro calcula

An extended version of the indicator for visualizing the time ranges of key trading sessions: Asian, European and American. The main advantage of this indicator is the automatic construction of a price profile for a trading session. The indicator has the functionality to set the start and end time of each trading session, as well as automatically determine the time zone of the trading server. The indicators include the ability to work with minimal CPU usage and save RAM. In addition, the option
FREE

Big sale 50% OFF! Price $299. Regular price $599 Real signal: click here Unique set files and all recommendations are provided free of charge. All future updates of the adviser are included in the price. After the purchase, contact me and I will help you install and configure the robot correctly. I will also share with you information on how to get a free VPS from a reliable broker. Price Action FX is a professional strategy based on the analysis of price movements and market momentum at cu

This indicator presents an alternative approach to identify Market Structure. The logic used is derived from learning material created by DaveTeaches (on X)
Upgrade v1.10: + add option to put protected high/low value to buffer (figure 11, 12) + add Retracements value to buffer when Show Retracements
When quantifying Market Structure, it is common to use fractal highs and lows to identify "significant" swing pivots. When price closes through these pivots, we may identify a Market Structure S

This new time-based strategy enable you to schedule precise buy/sell orders at any predefined time , allowing you to execute trades based on timing rather than technical analysis. The system automatically can determines the order type (buy or sell) based on technical confirmations provided by RSI and moving averages. You have the freedom to adjust and customize all parameters related to Buy and Sell criteria, as well as enable or disable technical filters . Link to MT4 version : https://www.
FREE
MetaTrader 마켓은 과거 데이터를 이용한 테스트 및 최적화를 위해 무료 데모 거래 로봇을 다운로드할 수 있는 유일한 스토어입니다.
어플리케이션의 개요와 다른 고객의 리뷰를 읽어보시고 터미널에 바로 다운로드하신 다음 구매 전 트레이딩 로봇을 테스트해보시기 바랍니다. 오직 MetaTrader 마켓에서만 무료로 애플리케이션을 테스트할 수 있습니다.
트레이딩 기회를 놓치고 있어요:
- 무료 트레이딩 앱
- 복사용 8,000 이상의 시그널
- 금융 시장 개척을 위한 경제 뉴스
등록
로그인
계정이 없으시면, 가입하십시오
MQL5.com 웹사이트에 로그인을 하기 위해 쿠키를 허용하십시오.
브라우저에서 필요한 설정을 활성화하시지 않으면, 로그인할 수 없습니다.