MetaTrader 5용 유료 기술 지표 - 20

Indicator of the colour display of the zones of buyers and sellers in the bar with a change of colour as the volume increases.
From bar maximum to bar closing - this is the sellers' zone.
From bar closing to bar minimum - this is the buyers area.
As the bar volume increases in comparison to the previous bar, the respective zones are coloured in a different colour.
Input parameters volumes (tick or real)

The BodySizeHistogram analytical indicator is designed to monitor the actual movement of the exchange rate on the body of the candle. The candle body is a universal tool for analyzing the price chart without using indicators that use mathematical formulas. In my view, the body of the candle is almost all that is needed to understand what is happening with the price. This indicator displays the histogram of the bodies of the candles in the points. The higher the histogram, the larger the candle b

Indicator focusing on the market's ZigZag, also adding 2 other already established indicators: Book of Offers and Balance Aggressor (Time & Trades), this indicator allows to detect the best price trigger (buy or sell) in the aggressions to the Book of Offers including filters important as Aggression in Candle.
Recommended use on the Brazilian iBovespa B3, but it also serves in Forex as long as the assets have information from the Book, in the case of Forex it is not possible to use the Aggres
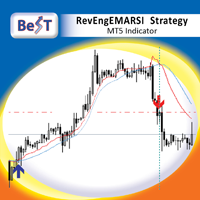
BeST_RevEngEMARSI Strategy is an MT5 Indicator that is based on the indicator RevEngEMARSI by Giorgos Siligardos that was presented in his article " Reverse Engineering RSI (II) " ( TASC_Aug 2003 ) as a new variation of his inverse-RSI indicator and which transforms the Exponential moving average of RSI into a curve in the price graph, simplifying the price projection method and improving its visual representation. BeST_RevEngEMARSI Strategy while implementing the crossings with its Moving Aver

The White's Candle Color indicator (by volume) will color the candles based on the current candle's volume compared to the moving average of the volume. This will allow you to see clearly if the volume (real or tick) is within the normal range, whether it is high or low and bring very important information about the market. I hope that this indicator can help in your operational. Success and good trades!

[DESCRIPTION] The Entry Point indicator shows up/down arrows as an entry point for buy/sell. The signal based on EMA, MACD and Price Action. A Red arrow means it is a good opportunity to Sell. A Green arrow means it is a good opportunity to Buy. [MAIN FEATURES] A Red arrow means it is a good opportunity to Sell. A Green arrow means it is a good opportunity to Buy. Easy to use and manage. The indicator is very simple and intuitive even for beginners. Works with any trading symbols: Forex pairs,
Lows Highs Finder
Трендовый индикатор, дающий точные сигналы для входа в сделки. Идеальные точки входа в сделки для валют, крипты, металлов, акций, индексов. Наилучшие результаты на таймфрейме M15\H1 и выше!
Бывает на бирже маркетмейкер, не пускает цену у какого то уровня. С точностью до пункта. Вы хотите увидеть где? Индикатор находит и показывает на каком уровне цена ударилась в одно и то же место 2 или 3 раза! После этого, на следующей свече стрелкой указывает вход. + Свечной GA
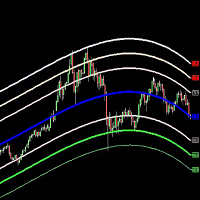
Belkhayate Gravity Center MT5 Custom
The Belkhayate center of gravity indicator is best used to confirm major turning points, and distinguish price extremes. Generally if price reaches the upper or lower levels one should expect a turn around coming soon, or at least a pull back towards the centre line if there is a strong trend. The upper and lower levels are red and green lines.
Our indicator use the same parameters as the well known trader M.Mostafa Belkhayate the inventor of the indi
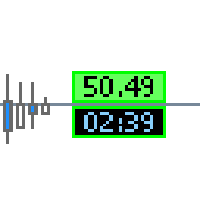
This tool gives you several informations about your broker and the current market events.
The top Infolabel shows the current spread price .
You can set whether the label should be displayed or hidden.
You can adjust price levels for automaticly change of background color.
The lower Infolabel shows the candle timer of the current time frame.
You can set whether the label should be displayed or hidden.
The bordercolor change to red if:
1. you have no connection to the tradeserver
2. y

Description
Range Detector is an indicator that identifies impulses in the market and displays their slope angles on the chart.
Recommendations
You can use this indicator to determine a trend and, accordingly, to determine the direction of opening a position or closing an opposite position.
Parameters
===== _INDICATOR_SETTINGS_ ===== - indicator settings
Maximum History Bars - maximum number of history bars for calculating the indicator. Average True Range Period - ATR indicator peri
GG Signal Scanner ATR base on ATR, MA and RSI indicators to determine trade times and entry points. The indicator scans all currency pairs in Market Watch or according to the list of currency pairs. The entry points will be listed of alerts and sent to the phone or email. Indicators are for use on one chart only and should not be used in conjunction with other indicators. Indicator should be used for M15 - H1 - H4 timeframe. In the strategy tester, the indicator only checks for 1 currency pair
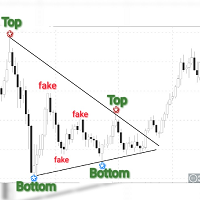
Obaforex Tops & Bottoms is a trading tool born out of a personal need to accurately filter tops and Bottoms and ensure consistency in the way tops and bottoms are picked for technical analysis. Mt4 version https://www.mql5.com/en/market/product/53637
It does not repaint (once top or bottom is printed, it don't disappear) It only prints tops and bottoms after a specified No of bars or candles to the right
This tool is expected to significantly improve the decision making of almost any form o
Индикатор Analytic Trade - это полноценная торговая система. Он состоит из 4 частей: Первая - это стрелочки, показывающие наиболее оптимальные точки открытия и закрытия ордеров. Стрелка вверх - сигнал на покупку, вниз - на продажу. Вторая - это информационная панель в правом верхнем углу. Крупным шрифтом обозначена текущая цена, над ней показаны: максимум дня, расстояние от текущей цены до него и разность максимума и минимума (в пунктах). Под ней расположены: минимум дня, расстояние до минимума,
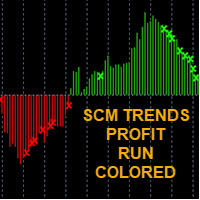
-EASY TO FOLLOW TRENDS -RED SELL / GREEN BUY -CROSS SIGNAL IS MEAN "TRENS WARNING" TO EXIT ORDER (WEAK TRENDS)
-WITH AUDIBLE ALERT ON/OFF
SCM indicator with different colors at levels 0, 100 and -100. The cross is a signal for " Exit" This exit signal is effective especially in short-term breakout trades, because it prevents early exiting at small corrections.
*****TIP EURUSD/BTC TF 10 min is work very Well****
****** GOLD TF15min is work very Well***** (after TF 15min show exit buy an
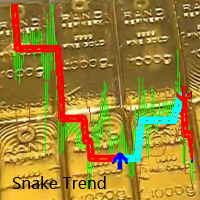
Index content: 1. The benchmark price, refer to the benchmark price. In the short term, the price fluctuates continuously and disorderly, and the short-term fate will appear unpredictable 2. Reference trend direction
Suggest: Weaken the short-term fluctuations of the K-line and follow the mid-to-long-term trend.
"Grow together!" "Cooperative QQ:556024" "Cooperation wechat:556024" "Cooperative email:556024@qq.com"
"The trend is forming or dying, and following the dancing snake

This plots Fibonacci deviation levels above and below a moving average of the price. Companion indicator to the " Golden Bull Wave Trader " expert advisor which uses volume\price trend to determine price reversals. https://www.mql5.com/en/market/product/56291 The expert advisor and this indicator were created in order to: Identify ideal and repeatable trade entries with high level of certainty Create a day trading strategy which doesn’t require a hard SL and TP Use alternate risk management me
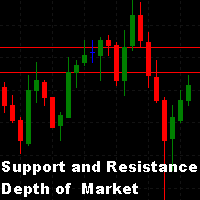
We often look for support and resistance points on the chart. One of the techniques that can be used is through the quantity of lots offered in the order book. This indicator searches for the largest lots in the order book and draws them on the graph in the form of lines, thereby obtaining where is the greatest concentration of lots offered on the centralized stock market at that time, thus configuring possible support and resistance lines.
- The number of lines to draw can be defined by the

VWAP is an intraday calculation used primarily by algorithms and institutional traders to assess where a stock is trading in relation to its weighted average volume for the day. Day traders also use VWAP to assess market direction and filter out trading signals. This indicator is used to analyze and calculate the Vwap from a certain point on the graph, which is widely used to analyze the beginning of a movement of the price relationship with the volume.
- Multi Vwaps on the same chart, placed
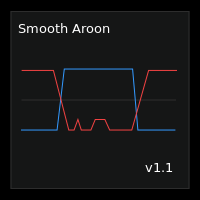
Smooth Aroon is a version of the Aroon Up and Down with smoothing and filtering.
Features :
Smoothing : You have smoothing from 0 to 99 . To smooth a signal, find the maximum value of the points in question then set the smoothing level above the maximum value. For example : If you want to smooth all signals below 30, then you should set the smoothing level above 30 This also smooths all signals above 70, since the Aroon Up and Down Oscillates between 0 and 100. Filtering : If you only
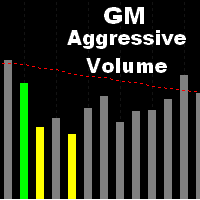
Volume is a resource used by analysts of various methodologies, precisely because it shows the confirmation of movements and the market's progress. It is an indicator that analyzes the financial quantity that was traded during a certain period.
This indicator analyzes the amount of volume for each candle, when there is an excessive increase in this, it differs from the others by a colored bar.
In addition to informing in the form of colored bars, this indicator allows you to emit an audible

Секвента Демарка (Sequential) - индикатор, демонстрирующий развитие тренда, его структуру. Довольно точно отображает начальную и конечную точки, важные точки перелома. Срабатывает по открытию свечи, поэтому перерисовок не будет никогда.
Здесь нет сложных формул, только статистика, отсчёт свечей, выбранных по определённым критериям. При этом индикатор может давать очень точные сигналы для входа, особенно при поддержке какого-нибудь индикатора уровней, например, этого . Алгоритм нахождения сигнал

GET THIS FULL COPY AND GET ANOTHER FREE INDICATOR ONE OF THE BEST AND USEFULL INDICATORS IN THE WORLD ..This is the one of the best usefull indicators which has chosen to be used by top traders in the world.
AUTOMATIC SUPPORT AND RESISTANCE This way of trading is also called Supply and demand, On this way of trading you can see auto colours appear where the market changes direction buying or selling Direction.
ALL KIND OF PAIRS METALS AND INDICIES ARE INCLUDED ALSO EXAMPLE, GBPUSD,GBPJPY,EU

Big summer sale. Save up to 40% on my products. SR dashboard - save 10$! With the SR Dashboard, you get a powerful tool to control some of the most important information in trading. Assemble a setup according to your strategy and get informed as soon as this setup is valid. Assign scores to defined conditions and let the Dashboard find them. Choose from Trend, Average Daily Range, RSI, Moving Averages, Pivot (Daily, Weekly, Monthly), Highs and Lows, Candlestick Patterns. What can you do with th

This Indicator adding power to traditional zigzag indicator. With High-Low numbers in vision it will be easier to estimate change of trend by knowing the depth of each wave. Information including points, pips, percentage%, and #bars can be displayed based on configuration. All information is real-time update. This indicator is especially useful in sideway market to buy low sell high.

Description
SuperCCI is an indicator based on the standard CCI indicator. It identifies and displays convergences/divergences in the market and forms the corresponding entry points. Also, using the trading channel index, it determines the direction of the trend and displays the levels of support and resistance .
Features Not repaint. Shows entry points. Shows the direction of the current trend and support/resistance levels. Has notifications. Recommendations
Use convergence/divergence to

Do you want to see the future lines of the ZigZag indicator? This indicator will help you do that because the indicator model is based on two indicators: Historical Memory and ZigZag. So it can forecast the ZigZag lines. Very useful as an assistant, acts as a key point to forecast the future price movement. The forecast is made using the method of searching the most similar part in the history (pattern) to the current one. The indicator is drawn as a line that shows the result of change of the
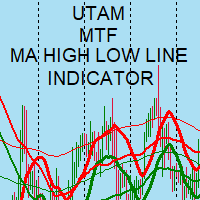
MTF Moving Average High Low line. I use it in my MT5 and MT4 robots in the round. Look at the robots and indicators I put up under my name. Good luck trading! :)
MTF Moving Average (Mozgó Átlag) High (felső) Low (alsó) line (vonala). MT5 és MT4 robotomban használom a fordulóban. Nézd meg a nevem alatt milyen robotokat és indikátort raktam fel . Sok sikert a kereskedéshez! :)

FXC iCCI-DivergencE MT5 Indicator
This is an advanced CCI indicator that finds trend-turn divergences on the current symbol. The indicator detects divergence between the CCI and the price movements as a strong trend-turn pattern.
Main features: Advanced divergence settings
Price based on Close, Open or High/Low prices Give Buy/Sell open signals PUSH notifications
E-mail sending Pop-up alert Customizeable Information panel Input parameters: CCI Period: The Period size of the CCI indicator.
C

FXC iDeM-DivergencE MT5 Indicator
This is an advanced DeMarker indicator that finds trend-turn divergences on the current symbol. The indicator detects divergence between the DeMarker and the price movements as a strong trend-turn pattern.
Main features: Advanced divergence settings
Price based on Close, Open or High/Low prices Give Buy/Sell open signals PUSH notifications
E-mail sending Pop-up alert Customizeable Information panel Input parameters: DeM Period: The Period size of the DeMarke

Koala Engulf Pattern Introduction
Professional MT5 indicator to detect engulf price action pattern. Useful in forex , cryptocurrency , CFD, Oil market. Some adjustable methods to separate qualified engulf patterns. Nice drawing on chart by fill engulf candles and draw stop loss and 3 different take profits on chart. Alert system contain pop up, mobile notification, email alert. Koala Engulf Pattern Advantages
Pure Price Action pattern, engulf is one of amazing price action patterns and very
Hi, I'm a Japanese EA developer.
I made an indicator for MT5. It can be used as a guide for trends and as a guide for entry / exit.
Please use it by pasting it on a chart of about 1 minute to 15 minutes.
If you like, please watch the video.
Various usages 1. It is used to recognize the environmental advantage of buying or selling with the color of the line. If the line is red, it is advantageous to buy. If it is blue, it is advantageous to sell. Neither if there is no line. 2. Used as

The Chaikin Money Flow (CMF) is an indicator created by Marc Chaikin in the 1980s to monitor the accumulation and distribution of a stock over a specified period. The default CMF period is 21 days. The indicator readings range between +1 and -1. Any crosses above or below 0 can be used to confirm changes in money flow, as well as buying or selling momentum, but many traders look for divergences to predict trend reversal based on volume. This indicator was developed not only to be used by man

trend view panel;
AutoSignals Trend
The indicator tracks the trend in 5 different chart times for the same asset, based on 6 signals for each chart time.
The main objective of the indicator is to show us the majority trend of the financial asset in which it was placed. The system transmits the information of the trends in different graphic times, in this way the user is able to have a wide view of the movement of the asset, this type of tool makes the user have a higher hit rate by

Size Bars – индикатор отображает на графике максимальный, минимальный, текущий и средний размер баров (свечей) за выбранный период.
Отображаемые параметры индикатора Size Bars: 1) Текущий размер бара в писах (по максимум/минимум, тело бара). 2) Максимальный, минимальный и средний размер свечей BUY . 3) Максимальный, минимальный, средний размер свечей SELL . 4) Количество свечей BUY и количество свечей SELL . 5) Среднее количество свечей подряд BUY и SELL . 6)

The 4 headed dragon is an indicator that has two functions. 1) Set the background trend. 2) Mark the predominant trend. By combining these two indicator signals, we will be able to trade for or against the trend, adapting the signals to your reading of the market.
You can download the demo and test it yourself.
1) Set the background trend.
Define four possibilities of trend that are the four heads of the dragon, marked by colors on the indicator, marking a) Powerful buying trend. b)

The Volume Heatmap indicator visually shows the INTENSITY of the volume taking into account the concept of standard deviation. Purpose of the Indicator: High volumes are common where there is a strong consensus that prices will increase. An increase in volume often occurs at the beginning of a new upward trend in the price of an asset. Some technical analysts do not rely on trend confirmations without a significant increase in volume. Low volumes usually occur when an asset is heading for a down

The algorithm of the Sup Trend indicator is to determine the dominant direction of price movement by algorithmic analysis of price values for a certain period of time. When calculating this indicator, logorithmic gains are first calculated at the closing price, which allows you to filter out the trend, seasonality and other inclusions that spoil the picture of volatility, then the standard deviation is plotted based on the data obtained. The algorithm takes into account the measurement of pri
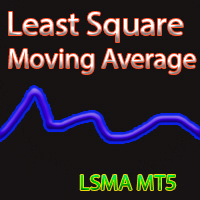
Least Square MA Description: The Least Square Moving Average indicator allows you to assess the direction of the market movement and its possible reversals. The indicator is a line that is displayed in the price window. Input parameters: LSMA_Period - the period for calculating the moving average using the least squares method; Prediction - the number of candles used to construct the predicted moving average using the least squares method, provided that its rate (falling or growing remains); Dis

Indicator LTS for MT5 (Level + Trends + Speed)
The LTS indicator was specially created for quick analysis of consolidations on the chart, which greatly facilitates decision-making when trading. LTS marks resistance and gives information about the forces affecting it, as well as the current speed and average travel. The indicator is easily customizable and can analyze any timeframe. LTS uses a unique trend analysis algorithm based on 4 parameters from global to local.

Description
Volume Magic is an indicator that shows the value of the relative volume in conjunction with the direction of the current trend. The ratio of the current volume relative to the average volume for a certain period is displayed in the lower window as an oscillator. The direction of the current trend is displayed as two-color trend lines.
How to use?
First, use two-color trend lines to determine the direction of the current trend. Then look for areas of low volume and open positi

The moving average applied to the price chart is one of the most used technical analysis methods. There are several ways to use averages, among them, through the analysis of crossings.
The method consists of using two moving averages, one fast period and one slow period. The concept is very simple, when there is a crossing of the fast moving average upwards it indicates a high market trend and when the fast moving average crosses downwards it indicates a low trend in the market, combining t

O indicador CoioteAverageSpreed é uma releitura do indicador AverageSpreed. Ele mostra a relação de esforço x resultado entre o volume e a volatilidade do preço. Com o volume heatmap é possível identificar visualmente se o preço foi deslocado com uma quantidade maior de volume e se o deslocamento do preço apresentou maior resultado ou não. É possível identificar momentos de ignição e exaustão do movimento, além de injeções de fluxo para dar continuidade a um movimento.
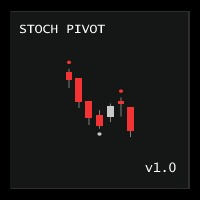
Stochastic Pivot draws a point on the chart at Stochastic overbought or oversold. During overbought periods, this indicator will draw the pivot point at the high of the highest candle and at the low of the lowest candle during oversold periods. NB : All pivots are updated 'on tick' and 'on any chart event' immediately Settings Name Description Upper Limit Set Stochastic Overbought Level
Lower Limit
Set Stochastic Oversold Level %KPeriod Set Stochastic K Period %DPeriod Set Stochastic D Per

CoioteWeisWave é uma releitura do indicador de VSA WeisWave com indicação do estouro de fractal, método de analise dos TradersPiolhos e implementado originalmente pelo Trader Dario Junqueira. A versão Coiote foi reprojetada para indicação da volatilidade do volume no fractal. A coloração adicional (azul e magenta) dão sinais de entrada, saída e pontos de gerenciamento, podendo ser usados também como suporte e resistência.
Existem 3 modos de exibição do weis wave, por volume total, por range e p

코알라 가격 행동 스캐너 - 가격 행동의 힘을 발휘하다 소개: 새로운 코알라 가격 행동 스캐너를 발견하세요 - 핵심 가격 행동 패턴을 감지하고 직관적인 스캐너 테이블로 표시할 수 있는 다재다능하고 다화폐, 다시간대 도구입니다. 요약: 이 지표는 보통을 넘어 사용자에게 여러 통화 및 시간대에서 주요 가격 행동 패턴을 식별할 수 있는 기능을 제공합니다. 특징: 흡수 패턴 핀바 패턴 도지 패턴 사용자 설정 가능한 설정: 흡수 패턴: 봉 2의 최소 바디 크기: 사용자는 2번째 닫힌 봉의 최소 바디 크기가 얼마나 되어야 하는지 조절할 수 있습니다. 봉 1의 최소 바디 크기: 사용자는 최신으로 닫힌 봉의 최소 바디 크기를 조절할 수 있습니다. 핀바 패턴: 최대 바디 %: 이 매개변수를 사용하여 핀바의 최대 바디 %를 그림 크기와 비교하여 조절할 수 있습니다. 도지 패턴: 최대 작은 바디 크기: 이 매개변수를 사용하여 사용자는 순수한 도지 패턴에서 바디 크기가 0이어야 한다는 것을 알고 있지만

About the VWAP Custom Date This indicator can be calculated from a specified date and hour, being not only a Day Trading indicator but also Swing Trading indicator.
What is the VWAP indicator? The volume weighted average price (VWAP) is a trading benchmark used by traders that gives the average price a security has traded at throughout the day, based on both volume and price. It is important because it provides traders with insight into both the trend and value of a security. Large institutio
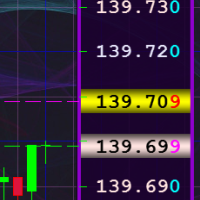
Индикатор предназначен для замены стандартной вертикальной ценовой шкалы, расположенной с правой стороны в окне графика клиентского терминала, на более удобную ценовую шкалу с возможностью детальной настройки параметров отображения этой шкалы. Кроме этого, индикатор позволяет делать фоновую заливку окна графика любым изображением по желанию пользователя и двухцветную сетку с элементами её тонкой настройки. В первую очередь, индикатор будет полезен трейдерам, обладающим не самым лучшим зрением,

The DYJ CandleShape contains 80 candlestick Patterns, such as MORNING STAR, DOJI STAR, HARAMI CROSS,INVERT HAMMER,ENGULFING..... candlestick is a valid form of market technical analysis. The recommended short stoploss is near the highest price of the first three to five candles The recommended long stoploss is near the lowest price of the first three to five candles Input
InpPeriodSMA =10 -- Period of averaging InpAlert =true -- Enable. alert InpCountBars =

The Haos oscillator coded for the MT5!
This oscillator allows to verify overbought / oversold regions in two periods (14 and 96, for example), making it possible to anticipate a reversal. Possibility to activate an audible alert when it reaches a defined level. Possibility to choose the alert sound by placing a .wav song in each asset or timeframe. (save a .wav file to the MQL5 \ Files folder) Possibility to activate / deactivate histogram and levels to make the screen cleaner. Customizable co

The background trend is an indicator that helps us to know the trend that is dragging the market. The indicator has 2 possibilities: 1) If the indicator is above zero the trend is buying and the indicator will be green.
2) If the indicator is below zero, the trend is selling and the indicator will be red.
You can download the demo and test it yourself.
The indicator has a text help in the upper right corner, in which it shows whether the indicator has a bullish or

The Initial Balance (Initial Balance / Initial Balance) is a concept related to the study of volume (to learn more, study about Market Profile and Auction Market Theory. You can find some videos in English when searching for "Initial Balance Market Profile").
The IB defines a range in which prices were negotiated in the first hour of trading.The amplitude of the range is important and the break in the range defined by the Initial Balance may have occurred due to the movement of several players

The VTC Volatility indicator was written to support a Brazilian stock market strategy in the WDO (USDBRL), but it can be adapted to other strategies and markets.
In the new indicator update, it is now allowed to choose up to 4 levels to determine the range, and thus be more versatile.
The Brazilian stock exchange (B3) has the VTC which is a "Structured Exchange Rate Volatility Transaction" (more information on the B3 website).
At around 10:00 am, the VTC "Call" comes out and Brazilian

The San Andres Fault is an indicator designed to detect the movements that make the market tremble. This system detects a tremor and marks its intensity in real time to decide in your operation. In addition, the recording of the sismic signal allows us to interpret movement patterns that help us in decision making You can download the demo and test it yourself.
The indicator has a text help in the upper right corner, in which it shows whether the indicator has a bullish or bearish b

THE SOUND OF MARKET is an indicator designed to detect the sound produced for the market movement. This system detects the background sound produced by market movements in real time to decide in your operation. In addition, by analyzing the sound recorded in the indicator, we can detect operational patterns. You can download the demo and test it yourself.
The indicator has a text help in the upper right corner, in which it shows whether the indicator has a bullish or bearish backgro

TClusterSearch - индикатор для поиска кластеров согласно заданным критериям. Для работы индикатора требуются реальные биржевые обьемы. Основная функциональность
Поиск и визуализация кластеров с обьемом, задаваемым фильтрами (до трех). Для каждого фильтра можно задать свой цвет. Поиск и визуализация кластеров с дельтой большей значения задаваемым фильтром Поиск и визуализация кластеров по бид/аск согласно фильтру Возможность фильтровать кластера в зависимотсти от его положения относительно б
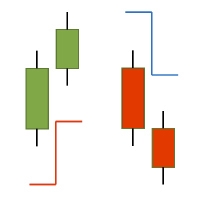
The ATR-StopLoss-Line indicator for MT5 calculates a stoploss line by the Average-True-Range (ATR) - Value of the particular candle. As point of reference you can choose the High/Low or Close of the particular candle. The indicator is suitable for scalping and intraday trading. The indicator does not redraw (recalculate). Signals are generated strictly on the "Close of the bar". It can be used as a standalone tool or together with other indicators. Alerts on Colorchanges are activatable.
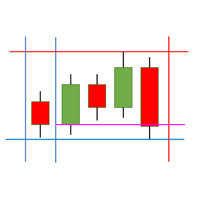
The SessionLines indicator for MT5 shows up the most important time intervalls and price levels in the DAX-Index. The following times get marked: Opening Time DAX Future, Opening Time DAX Kassa, Closing Time DAX Kassa, Closing Time DAX Future, Opening Time US Index Futures, Opening Time US Kassa Markets, Spezial Times, The following price levels get marked: Daily High/Low, Previous Daily High/Low, Weekly High/Low, Opening and Cloth Levels of Future and Kassa Daily (inkl. Previous Day).
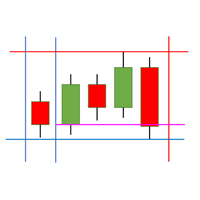
The SessionLines indicator for MT5 shows up the most important time intervalls and price levels in the US- Indices .
The following times get marked: Opening Time US Futures, Opening Time US Kassas, Closing Time US Kassas, Spezial Times,
The following price levels get marked: Daily High/Low, Previous Daily High/Low, Weekly High/Low, Opening and Cloth Levels of Futures Daily (inkl. Previous Day).

MOUNTAINS:It is an indicator that detects market consolidations prior to a movement.
The objective of this indicator is to indicate the areas before the market makes a move.
The areas that we are interested in detecting are the PLATEAU, which are between the slopes.
When the system detects a PLATEAU , the trader must place his operation in that area, waiting for the increase in volatility to reach its target.
The best option to carry out the operation of the PLATEAU is th

Volume Analysis Trader looks at volume using a fixed average of volume. This averaging helps spot when volume is rising or declining. Also I have added volume spikes which are when volume suddenly is above the average. These help spot market reversals.
This will hep a trader look for the following in their trading:
Rising volume during a rally shows trend is strong. Falling volume on a rally shows trend is weakening. As a rule of thumb on daily charts if current volume is higher than yester
Pullback Probability It is an indicator that shows us the probability that the price will t urn around and we can operate that market turn.
The indicator marks a line that oscillates between a percentage of 0% to 100%.
The one indicated in the upper left corner shows us a help in which it informs us of the area in which the price is in real time, as well as the percentage that the candle is open. You can download the demo and test it yourself.
The indicator marks 6 work zones. 1) Above 80
The Keltner Channels are powerful tools of technical analysis made specifically to take advantage of the opportunities created by price volatility. The indicator was originally developed by the American Chester W. Keltner, in the 1960s, and is widely used, especially in the American market.
However, despite the high usability in the market, the Keltner Channel suffers from a problem of having only 2 channels, which makes it very difficult to know the right time to enter or leave a position. S

Las Bandas de Bollinger se encuentran entre los indicadores más utilizados en el análisis técnico, su autor es el estadounidense John Bollinger, analista financiero y gran colaborador en el área. John comenzó a desarrollar esta técnica en la década de 1980 y en 2001 publicó su libro Bollinger on Bollinger Bands.
Las bandas de Bollinger son muy útiles para indicar niveles de precios en los que una acción puede haberse apreciado o devaluado demasiado, además de indicar signos de máximos y fon
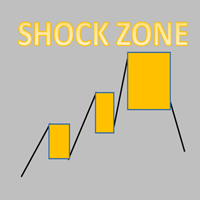
Every trading shock range is a point of gaining momentum!
The stop loss is generally the height of the shock zone.
Take profit depends on personal preference and market position. Generally at least double the height of the shock zone. Being in a good market position, it can have a profit-loss ratio of 5-10
Necessary for traders: tools and indicators Waves automatically calculate indicators, channel trend trading Perfect trend-wave automatic calculation channel calculation , MT4 Perfect

Provide ideas for trend trading.
Automatic calculation and generation of trend channels.
The channel line, also known as the pipeline line, is to draw a straight line parallel to the trend line in the opposite direction of the trend line, and the straight line crosses the highest or lowest price of the recent period. These two lines run the price in the middle and have obvious pipe or channel shapes. Necessary for traders: tools and indicators Waves automatically calculate indicators, chann
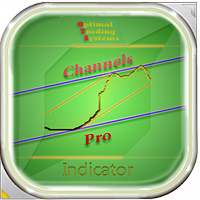
This indicator determines the channels along which prices move on the trading history. There are many trading strategies that rely on channel trading on a channel breakout. This indicator can draw price channels by reading information from several timeframes at once (from the current, from the second and third). You can customize the color and thickness of the lines for each timeframe. Also, you can set a different distance between highs and lows to draw channels or lines. There is also a simple

The BTFX Pivot Points is an indicator which calculates the Support and Resistance levels for each day. By using this indicator the pivot levels point out clear targets to aim for. The resistance levels are shown in purple above the silver pivot line. The support levels are shown in Orange and can be found below the silver pivot line. This indicators works very well when used with The BTFX Daybreak Indicator. For a more in depth explanation of these indicators please watch the Youtube video attac

Genetic Code , is an indicator that differentiates two types of market: the market in range and the market with volatility.
This indicator allows the trader to choose whether to use a range trade or a volatility trade. You can download the demo and test it yourself.
When observing the trace of the indicator it shows us narrow areas that correspond to market ranges.
These ranges always end with a volatility process, so you can work with two conditional pending orders.
When th

Audible order flow, we can set a different tone for up to 12 buy order sizes and 12 other sizes for sell orders.
Up to 84 musical notes are available, ie 7 octaves. The default settings have been tested in the Forex (EURUSD, GBPUSD, XAUUSD, USDJPY, USDCHF and USDMXN) and Brazilian futures (WDOFUT, DOLFUT, WINFUT and INDFUT).
This tool was inspired by an interview with a visually impaired trader, as there are no tools for this type of trader and I decided to make it available for free, so

DNA is an indicator that allows us to operate both in favor of a trend and a pullback.
You can download the demo and test it yourself.
Trend trading is above zero and pullback trading is below zero.
The direction of the operation is marked by the color of the line.
If the line is green it corresponds to purchases.
If the line is red it corresponds to sales.
For example, if the green line is above zero and growing, we will have an uptrend operation. If the red line is above zero and
MetaTrader 마켓은 거래로봇과 기술지표를 판매하기에 최적의 장소입니다.
오직 어플리케이션만 개발하면 됩니다. 수백만 명의 MetaTrader 사용자에게 제품을 제공하기 위해 마켓에 제품을 게시하는 방법에 대해 설명해 드리겠습니다.
트레이딩 기회를 놓치고 있어요:
- 무료 트레이딩 앱
- 복사용 8,000 이상의 시그널
- 금융 시장 개척을 위한 경제 뉴스
등록
로그인
계정이 없으시면, 가입하십시오
MQL5.com 웹사이트에 로그인을 하기 위해 쿠키를 허용하십시오.
브라우저에서 필요한 설정을 활성화하시지 않으면, 로그인할 수 없습니다.