MetaTrader 5용 새 기술 지표 - 55
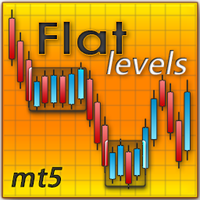
The indicator looks for flat zones, where the price remained within a certain range for quite a long time.
Settings History - history for calculation/display in bars FlatBars - flat area width in bars FlatRange - flat area height in pips IncludeSmallBar - calculate using internal flat bars CalcFlatType - calculate flat zones by (HIGH_LOW/OPEN_CLOSE) DistanceForCheck - distance (in pips) from the flat level, at which the check is enabled CountSignals - amount of signals per level AutoCalcRange

Every indicator has its advantages and disadvantages. Trending ones show good signals during a trend, but lag during a flat. Flat ones thrive in the flat, but die off as soon as a trend comes. All this would not be a problem, if it was easy to predict when a flat changes to a trend and when a trend changes to a flat, but in practice it is an extremely serious task. What if you develop such an algorithm, which could eliminate an indicator's flaws and enhance its strengths? What if such an algori
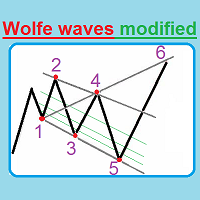
This unique indicator automatically builds Wolfe Waves and features a highly efficient trading strategy. Use If number 5 appears, wait till the first candle is closed behind Moving Average, then look at the three center lines showing what lot volume should be used if the fifth dot crossed the line 25%. The candle is closed behind Moving Average, and then we open a trade with the lot: = (Let's apply the lot of, say, (0.40), divide it into four parts and open a quarter of the lot (0.10)). If the

The draws trend lines with adjustable trend width, with trend breakout settings and notifications of trend breakout (Alert, Sound, Email) and of a new appeared arrow. Arrows point at the direction of the order to open (BUY, SELL).
Parameters MaxHistoryBars - the number of bars in the history. Depth (0 = automatic settings) - Search area. width trend ( 0 = automatic settings) - Trend width. (true = closed bars on direction trend),(false = just closed bars for line) - true = closure of candlesti
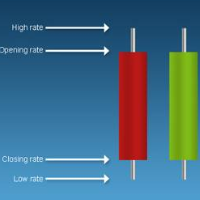
'Info body and shadow candles' indicator colors the candle bodies and shadows according to the settings. For example, if the 'Size body candles' parameter is 10, the indicator looks for the candles having a body size of 10 or more. Candle shadows are calculated the same way. Detected candles can be colored (body color, shadow color). The indicator can be adjusted for both four- and five-digit quotes. МetaТrader 4 version: https://www.mql5.com/en/market/product/12618 Parameters Use candle searc

The "Candle Pips MT5" indicator is a tool that helps us a quick way to see the size of the candles on our platform; this is not only of great help to any trader who wants to study the market thoroughly, it is helpful in various strategies that are based on size of the candles. The indicator shows the value in Pips of each candle to our current graph, rounded to an integer.
The indicator also shows the information as a histogram, at the bottom of the graph. It has simple inputs: Candle Type:
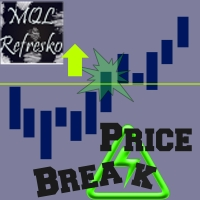
The "Price Break" indicator is a powerful tool for any trader. If the price breaks the levels the indicator shows, there is aproximatelly a 77% chance it will go in the same direction. If it exceeds the blue line, there are many possibilities for the price to rise. On the contrary, if it passes down the red line, it means that there are many possibilities for the price to drop. We should always consider the latest indicator signal, so we should rely only on the last blue arrow and the last red a
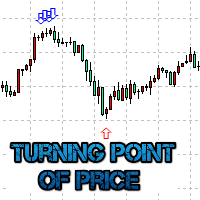
The Turning point of price indicator displays assumed turning points of the price on the chart. It is based on data of the Prise Reversal oscillator and standard ADX. When the value of Prise Reversal is in overbought or oversold area (area size is set by a user), and the value of the ADX main line exceeds the preset value, the Turning point of price indicator draws an arrow pointed to the further assumed price movement. This idea is described in the article Indicator of Price Reversal .
Inputs
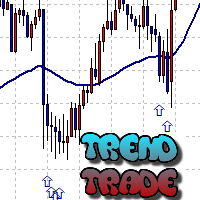
The Trend Trade indicator displays assumed turning points of the price on the chart in the direction of the trend after correction. It is based on the data of the Prise Reversal oscillator with the period 6 and indicators which characterize strength and availability of the trend. When the value of Prise Reversal is in overbought or oversold area (area size is set by a user), and the current trend is confirmed, the Trend Trade indicator draws an arrow pointed to the further assumed price movement
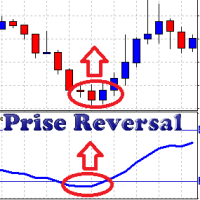
The oscillator uses data of standard indicators and some patterns of price movement. Using this data, it forms its own (more accurate) signals of a change in the direction of the price movement. Prise Reversal helps to identify reversal points during the flat, and the price extremums during the trend. At these points, you can enter counter trend with a short take profit. Besides, it indicates time intervals when it is too late to open a trend-following deal. After a few days of using the indicat

The indicator is similar to https://www.mql5.com/en/market/product/12330 . However, it considers the MQL5 platform features. Peaks and bottoms are calculated based solely on external bars. After a swing is formed, the indicator does not redraw providing opportunities for traders working on horizontal level breakthroughs. Traffic can be reduced by changing the amount of calculated bars in the MinBars variable (default value is 500). All you need is to select the output options, so that you can se

The indicator is based on the two-buffer scheme and does not require any additional settings. It can be used on any financial instrument without any restrictions. The indicator is a known ZigZag, but it does not redraw . The indicator allows to easily detect significant levels on the price chart, as well as demonstrates the ability to determine the probable direction of a price movement. The calculations are based on the candles' Close prices, thus improving the reliability of the levels.
Para

VR Ticks는 스캘핑 기반 전략에 대한 특별한 지표입니다. 이 지표 덕분에 거래자는 금융상품의 메인 차트에서 직접 틱 차트를 볼 수 있습니다. 틱 차트를 사용하면 가능한 한 정확하게 시장에 포지션을 입력하거나 시장에서 포지션을 청산할 수 있습니다. VR Ticks는 방향에 따라 색상이 변하는 선 형태로 진드기 데이터를 표시합니다. 이를 통해 진드기의 상황을 시각적으로 이해하고 평가할 수 있습니다. 틱 차트의 장점은 기간을 고려하지 않고 가격 변동을 기반으로 작성된다는 것입니다. VR Ticks는 가능한 가장 최소한의 차트를 구축합니다. 설정, 세트 파일, 데모 버전, 지침, 문제 해결 등은 [블로그] 에서 확인할 수 있습니다.
[링크] 에서 리뷰를 읽거나 작성할 수 있습니다.
[MetaTrader 4] 용 버전 틱은 하나의 가격 변동입니다. 한 번의 가격 변동에 대해 가격은 하나 또는 여러 포인트만큼 변경될 수 있습니다. 진드기가 움직임이라는 것을 이
FREE
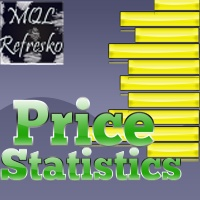
This indicator works only 5 digits Brokers. It is impossible to talk about the study of the Forex market or any market without considering of that market statistics. In this case, our indicator "price statistics" we have a new way to study our chart, giving information of the price in a range of pips you want to study for example, can we know how many times the price closes or opens into spaces 10, 20, 30, 50, 100 pips or more; and know them not only in numbers but also draws this relationship a

The indicator displays volume profiles based on the nesting principle. Profiles periods are pre-set so that each subsequent profile has a length twice as long as the length of the previous profile. In addition to profiles, the indicator displays volume clusters sorted by color, depending on the volume they contain.
Indicator operation features The indicator works on typical timeframes from M5 to MN, but for calculations uses historical data from smaller timeframes: M1 - for timeframes from M5
FREE

When looking at the information of On Balance Volume indicator, a question arises: is it a strong or weak movement? Should it be compared with previous days? These data should be normalized to always have a reference.
This indicator presents the followings parameters: Normalization period (Max-Mins absolute) Smoothing period (-1 off) Tick/Real Volume Maximum number of bars to calculate (-1 off) Upper value normalization Lower value normalization Calculation: normOBV = (value - absMin) * (relMa

The market is unfair if only because 10% of participants manage 90% of funds. An ordinary trader has slim changes to stand against these "vultures". This problem can be solved. You just need to be among these 10%, learn to predict their intentions and move with them. Volume is the only preemptive factor that faultlessly works on any timeframe and symbol. First, the volume appears and is accumulated, and only then the price moves. The price moves from one volume to another. Areas of volume accumu

The "Five Candle Pattern" indicator is a novel way to see the market, because with it we can compare and/or seek training or the pattern of the past 4 or 5 Candles, and identify them in the same graph, to view your behavior at an earlier time. The indicator creates a pattern of those 4 or 5 candles and searches backward, identifies, and marks the same formation or pattern. With that information you adjust the strategy that is operating, or create a new one, because you can compare the past devel

The indicator colors bullish, bearish and doji candles. Also, the amount of candles (bullish, bearish and doji) for the last N days is calculated. You can select colors for both bodies and shadows of candles, as well as enable coloring of only candle bodies МetaТrader 4 version: https://www.mql5.com/en/market/product/11624 Parameters color bulls = color of bullish candle bodies color shadow bulls = color of bullish candle shadows color bears = color of bearish candle bodies color shadow bears =

COSMOS4U Volume indicator facilitates your trade decisions. It gives confirmation of the running movement and market trends. It highlights current and past accumulation and distribution volumes, comparing them to moving average volume and the highest volume. In addition, it identifies and marks nuances as well as convergence and divergence patterns of bears and bulls in order to provide the market trend and price ranges. The supported features are as follows: Fast Volume Moving Average Slow Volu

This is a well-known ZigZag indicator. But it differs by the fact that its plot is based on values of the middle line which is set by a user. It can display Andrews’ Pitchfork and standard or Bobokus Fibo levels. NO REPAINTING.
Parameters Period МА — middle line period. Default value is 34. Minimum value is 4. Maximum value is set at your discretion. Used to calculate price — type of price used for the midline calculations. The averaging method — type of smoothing for the middle line. Turning

The indicator displays the value of ROC (Rate of change) from the selected price or moving average as a histogram. You can plot the moving average ROC values for smoothing indicator.
Displayed Data ExtROC - rate of change ExtMAROC - smoothing line
Parameters You can change the price, on which the indicator is calculated.
Inputs InpMAPeriod - in case you want to calculate the moving average ROC, enter averaging period. Enter 1 for the calculation of the specified prices. InpMAMethod - smoot
FREE

Introduction to GARCH Indicator GARCH is the short initial for Generalized Autoregressive Conditional Heteroskedasticity and it is the volatility prediction model commonly used in financial industry. GARCH model was first appeared in the work by Danish Economist, Tim Peter Bollerslev in 1986. The 2003 Nobel Prize winner, Robert F Engle also added much contribution for the refinement of GARCH model with Tim’s work. Our GARCH INM predictor took the original method of Nelder Mead for GARCH model bu
FREE

This indicator is based on the classical oscilator Stochastic and will be helpful for those who love and know how to use not a visual but digital representation of the indicator. Stochastic MT5 indicator shows values from each time frames: M1, M2, M3, M4, M5, M6, M10, M12, M15, M20, M30, H1, H2, H3, H4, H6, H8, H12, D1, W1, AND MN1. You will be able to change the main input parameters for each Stochastic for every TF and you will have a choice what TFs you want to see. The indicator shows the di

The Heikin Ashi indicator is our version of the Heikin Ashi chart. Unlike competitor products, this indicator offers extensive options for calculating Heikin Ashi candles. In addition, it can be displayed as a classic or smoothed version.
The indicator can calculate Heikin Ashi with moving average by four methods: SMA - Simple Moving Average SMMA - Smoothed Moving Average EMA - Exponential Moving Average LWMA - Linear Weighted Moving Average
Main features The indicator shows Heikin
FREE

This indicator displays pivot points in the chart, including historical vales, and supports many calculation modes for Pivot Points and S/R levels. [ Installation Guide | Update Guide | Troubleshooting | FAQ | All Products ] It plots historical levels for backtesting purposes
It allows you to select the reference timeframe It implements different Pivot Point calculation modes It implements different SR calculation modes
It implements customizable colors and sizes
Calculation Modes The indi
FREE

This indicator searches for candlestick patterns. Its operation principle is based on Candlestick Charting Explained: Timeless Techniques for Trading Stocks and Futures by Gregory L. Morris. If a pattern is detected, the indicator displays a message at a bar closure. If you trade using the MetaTrader 4 terminal, then you can download the full analogue of the " Candle Pattern Finder for MT4 " indicator
It recognizes the following patterns: Bullish/Bearish (possible settings in brackets) : Hamme

The indicator generates early signals basing on ADX reading data combined with elements of price patterns. Works on all symbols and timeframes. The indicator does not redraw its signals. You see the same things on history and in real time. For better visual perception signals are displayed as arrows (in order not to overload the chart).
Features The best results are obtained when the indicator works on two timeframes. For example: M30 – the indicator shows the main trend; M5 – the indicator ge
This indicator is based on the classical indicator Average Directional Index (ADX) and will be helpful for those who love and know how to use not a visual but digital representation of the indicator. ADX MT5 indicator shows values from each time frames: M1, M2, M3, M4, M5, M6, M10, M12, M15, M20, M30, H1, H2, H3, H4, H6, H8, H12, D1, W1, AND MN1. You will be able to change the main input parameters for each ADX for every TF and you will have a choice what TF you want to see.
Example for M1 TF_
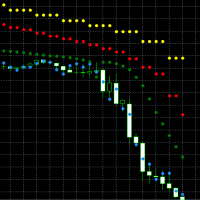
This indicator is based on the classical indicator Parabolic SAR. You can observe up to 4 different timeframes. All MT5 TimeFrames are supported. It's possible to use lower or higher timeframes than the current chart timeframe. Input Parameters: For each of the 4 Timeframes you can configure: The specific Period ( ENUM_TIMEFRAMES ) The usage of the PSAR Value ("visible and relevant for the signal", "visible and not relevant for the signal" or "invisible and not relevant for the signal (ign
Many indicators are based on the classical indicator Moving Average . The indicator All_MT5_MA_FX shows the correlation between 2 MA (fast and slow) from each MT5 TimeFrames . You will be able to change main input parameters for each MA for every TF. Example for M1 TF: TF_M1 = true Period1_Fast = 5 Method1_Fast = MODE_EMA Price1_Fast = PRICE_CLOSE Period1_Slow = 21 Method1_Slow = MODE_SMA Price1_Slow = PRICE_TYPICAL
This indicator is based on the classical indicator Parabolic SAR and will be helpful for those who love and know how to use not a visual but digital representation of the indicator. All MT5 TimeFrames PSAR indicator shows values from each time frames: M1, M2, M3, M4, M5, M6, M10, M12, M15, M20, M30, H1, H2, H3, H4, H6, H8, H12, D1, W1, AND MN1. You will be able to change the main input parameters for each PSAR for every TF and you will have a choice what TFs you want to see.
Example for M1 TF_

The Correlation Matrix indicator shows the actual correlation between the selected instruments. The default setting is set to 28 currency pairs, gold, and silver, but the indicator can compare any other symbols.
Interpretation of the indicator Positive correlation (correlation is above 80 %). Negative correlation (correlation is below -80 %). Weak or no correlation (correlation is between -80 and 80 %).
Main features The indicator shows the actual correlation between the selected ins
Scanner PriceAction is a convenient indicator for tracking PriceAction patterns by selected symbols on timeframes from M15 to Weekly. You will never omit a profitable trade. You will not have to look through numerous charts trying to find a suitable pattern. Scanner PriceAction will show you a chart and a period where one or another PriceAction set has been formed. All that is left to do is to switch to a specified symbol, size up the situation, and decide whether you want to enter the market. T

This indicator is based on the classical indicator Parabolic SAR and will be helpful for those who love and know how to use not a visual but digital representation of the indicator. All MT5 TimeFrames PSAR indicator shows values from each time frames: M1, M2, M3, M4, M5, M6, M10, M12, M15, M20, M30, H1, H2, H3, H4, H6, H8, H12, D1, W1, AND MN1. You will be able to change the main input parameters for each CCI for every TF.
Example for M1 sTF1___ = "M1"; pStep1 = 0.02; pMax1 = 0.2;
Input para
This indicator is based on the classical indicator RSI (Relative Strength Index) and will be helpful for those who love and know how to use not a visual but digital representation of the indicator. All MT5 TimeFrames RSI indicator shows values from each time frames: M1, M2, M3, M4, M5, M6, M10, M12, M15, M20, M30, H1, H2, H3, H4, H6, H8, H12, D1, W1, AND MN1. You will be able to change the main input parameters for each RSI for every TF and you will have a choice what TFs you want to see. Exampl

This indicator is based on the classical indicator ADX ( Average Directional Index) and will be helpful for those who love and know how to use not a visual but digital representation of the indicator. All MT5 TimeFrames ADX indicator shows values from each time frames: M1, M2, M3, M4, M5, M6, M10, M12, M15, M20, M30, H1, H2, H3, H4, H6, H8, H12, D1, W1, and MN1. You will be able to change the main input parameters for each ADX for every TF.
Example for M1 sTF1___ = "M1"; adxPeriod1 = 14;
Inp

This indicator is based on the classical indicator CCI (Commodity Channel Index) and will be helpful for those who love and know how to use not a visual but digital representation of the indicator. All MT5 TimeFrames CCI indicator shows values from each time frames: M1, M2, M3, M4, M5, M6, M10, M12, M15, M20, M30, H1, H2, H3, H4, H6, H8, H12, D1, W1, AND MN1. You will be able to change the main input parameters for each CCI for every TF.
Example for M1 sTF1___ = "M1"; Period1 = 13; Price1 = PR

This indicator is based on the classical indicator Stochastic and will be helpful for those who love and know how to use not a visual but digital representation of the indicator. All MT5 TimeFrames Stochastic indicator shows values from each time frames: M1, M2, M3, M4, M5, M6, M10, M12, M15, M20, M30, H1, H2, H3, H4, H6, H8, H12, D1, W1, AND MN1. You will be able to change the main input parameters for each Indicator for every TF. First line of data is representing a Main calculations of the St

Do you like scalping? Th is indicator displays information about the latest price quotes received from the broker. [ Installation Guide | Update Guide | Troubleshooting | FAQ | All Products ]
Identify tick trends easily A blue row means the price has increased A red row means the price has decreased Customizable colors and font sizes Display your desired amount of rows The indicator is non-repainting
Parameters Rows: amount of rows with data to display in the chart Font size: font size of th
FREE

VR 그리드 표시기는 사용자 정의 설정으로 그래픽 그리드를 생성하도록 설계 되었습니다. 표준 그리드 와 달리 VR 그리드는 원형 레벨 을 구축하는 데 사용됩니다. 사용자의 선택에 따라 라운드 수준 사이의 단계는 임의적일 수 있습니다. 또한 VR Grid는 다른 인디케이터나 유틸리티와는 달리 기간이 바뀌거나 단말기를 재부팅해도 그리드의 위치 를 유지합니다. 설정, 세트 파일, 데모 버전, 지침, 문제 해결 등은 다음에서 얻을 수 있습니다. [블로그]
다음에서 리뷰를 읽거나 작성할 수 있습니다. [링크]
버전 [MetaTrader 4] 수직 수준 은 실제 시간 간격을 기준으로 하며 누락 또는 존재하지 않는 기간은 무시 합니다. 따라서 레벨 사이의 단계는 사용자가 선택한 값과 엄격하게 일치합니다. VR 그리드 표시기를 사용할 때 트레이더는 모든 수준에서 스타일 , 수직선 및 수평선의 색상 및 두께를 변경할 수 있습니다. 이를 통해 금융 상품의 라운드 수준 을 제어할 수 있습니다.
FREE

Tired of plotting trendlines? The PZ TrendLines MT5 indicator applies a mechanical approach to the construction of trend lines for you! [ Installation Guide | Update Guide | Troubleshooting | FAQ | All Products ] It can draw up to 18 trendlines Trendlines can be optionally based on fractals Each line represents a breakout level Each trendline can be broken or rejected Configurable amount of lines Configurable colors Support I am happy to provide free products but given my limited time, they com
FREE

This indicator is based on the classical indicator RSI (Relative Strength Index) and will be helpful for those who love and know how to use not a visual but digital representation of the indicator. All MT5 TimeFrames RSI indicator shows values from each time frames: M1, M2, M3, M4, M5, M6, M10, M12, M15, M20, M30, H1, H2, H3, H4, H6, H8, H12, D1, W1, AND MN1. You will be able to change the main input parameters for each RSI for every TF.
Example for M1 sTF1___ = "M1"; Period1 = 13; Price1 = PR
This indicator and its usage was developed by Brazilian trader and analyst Odir Andrade Aguiar (nickname Didi) from Doji Star.
Usage It is based on the ratio of moving averages with periods 3 (FAST) and 20 (SLOW) by the 8-period moving, which are default settings. When SLOW and FAST are very close and near 1.0-line (white center line), they can indicate a buy or sell signal in next candles. Such signal is know as Agulhada (Needleful). Buy entry happens when FAST line moves UP while SLOW line m

The indicator MilkyWay is calculating and draws a blue or red ribbon as a trend and as a filter. In case the price is moving inside the ribbon you should not enter the market. In case you see a blue trend and the current price is above the blue ribbon than this is a good time to go Long. In case you see a red trend and the current price is below the red ribbon than this is a good time to go Short. Only 1 input parameter: nBars = 500; - number of Bars where the ribbon will appears.

Pivot Points MT5 is a universal color multicurrency/multisymbol indicator of the Pivot Points levels systems. You can select one of its three versions: Standard Old, Standard New and Fibo . It plots pivot levels for financial instruments in a separate window . The system will automatically calculate the Pivot Point on the basis of market data for the previous day ( PERIOD_D1 ) and the system of support and resistance levels, three in each. A user can choose colors for the indicator lines. The on

This indicator provides the analysis of tick volume deltas. It calculates tick volumes for buys and sells separately, and their delta on every bar, and displays volumes by price clusters (cells) within a specified bar (usually the latest one). This is a limited substitution of market delta analysis based on real volumes, which are not available on Forex. The indicator displays the following data in its sub-window: light-blue histogram - buy (long) volumes; orange histogram - sell (short) volumes

This auxiliary indicator displays time left before closing on the current timeframe with continuous update . It also shows the last trade price and variation from a previous day close in percentage and points. This indicator is pretty handy for daytraders and scalpers who want to precisely monitor closing and opening of candles.
Indicator parameters Show in shifted end - Default: False. Display time and values on screen. If True, Displays only time to close aside last candle. Distance from the
FREE

This indicator works on every currency pairs and time frames (TF). One input parameter: nPeriod - number of bars for histogram calculation. I recommend to optimize nPeriod value for each TF. If Green histogram poles are crossing the zero line from below then Long position may be opened. If Red histogram poles are crossing the zero line from above then Long position may be opened.

This indicator is designed for H1 and H4 timeframes (TF) only. No input parameters because it is tuned to these two TF. It draws two step-like lines: a main Silver line and a signal Red line. These two lines are calculated so that to enhance the filtration of the market noise. Buy when the main line goes above the signal line. Sell when the main line goes below the signal line.

Fibonacci sequence is defined by integer sequence: 0, 1, 1, 2, 3, 5, 8, 13, 21, 34, 55, 89, 144, ... By definition, it starts from 0 and 1, the next number is calculated as a sum of two previous numbers. Instead of the standard moving average, the indicator uses the following calculation of average price: Bar0 + Bar1 + Bar2 + Bar3 + Bar5 + Bar8 + Bar13 + Bar21 + ... This indicator shows 2 moving Fibonacci lines and arrows when 2 these lines crossing each other. If an Aqua line is crossing a Yell
DeMarker (DeM) indicator is another member of the Oscillator family of technical indicators. Traders use the index to determine overbought and oversold conditions, assess risk levels, and time when price exhaustion is imminent. This indicator shows DeMarker data from 9 currency pairs of your choice for all 9 timeframes. If a digital value of DeM is less or equal to DnLevel = 0.3 (or whatever number you decided to put), Green square appears. This is potentially an oversold condition and may be a

This indicator is based on the classical indicators: RSI (Relative Strength Index), CCI (Commodity Channel Index) and Stochastic . It will be helpful for those who love and know how to use the digital representation of the indicators. The indicator shows values from each timeframe (M1, M5, M15, M30, H1, H4, D1, W1 and MN1). You will be able to change the main input parameters for each RSI, CCI and Stochastic for every timeframe.
Parameters OverboughtLevel_R = 70 - RSI UpLevel OversoldLevel_R =

값을 평활화하여 필터링할 수 있는 통화력의 선형 지표입니다. 선택한 통화의 현재 힘(최대 개수는 8개)과 과거 값을 보여줍니다. 계산은 지표가 실행되는 선택한 차트 기간에 따라 다릅니다. 표시기는 데이터를 모든 통화에 대한 선으로 표시하거나 현재 통화 쌍에 대한 히스토그램으로 표시합니다. 현재 통화 쌍에 대한 통화 강도 지수의 교차점이 차트에 화살표로 추가로 표시됩니다. 현재 추세 방향은 막대의 색상으로 강조 표시됩니다. 주요 설정: iPeriod - 통화력을 분석하는 데 사용되는 막대의 수입니다. HistoryBars - 기록에서 계산된 막대의 수입니다. 매개변수는 첫 번째 실행 중 실행 시간에 영향을 줍니다. 브로커가 히스토리 길이에 제한이 있는 경우 필요한 히스토리 데이터를 줄이는 것도 필요합니다. SmoothingPeriod - 데이터 평활 기간(평활을 활성화하려면 1로 설정). SmoothingMethod - 데이터 평활화 방법. ShowPairLabels - 표시기 창의

This indicator shows Commodity Channel Index (CCI) data from 9 currency pairs by your choice for all 9 Time Frames. If a digital value of the CCI is less or equal to DnLevel = -100 (or whatever number you decided to put) then a Green square will appear. This is potentially an oversold condition and maybe a good time to go Long. If a digital value of the CCI is greater or equal to UpLevel = 100 (or whatever number you decided to put) then a Red square will appear. This is potentially an overbough

This indicator shows bands (flexible corridor) for a current price movement and the change of trend. The indicator can be used on any time frames and currency pairs. The following input parameters can be easily changed for your needs: nPeriod = 13; - number of bars which the indicator will use for calculation Deviation = 1.618; - coefficient for bands distance from the middle line MaShift = 0; - shift from current bar

This indicator shows data from 9 currency pairs by your choice for all 9 Time Frames. If a digital value of the RSI is less or equal to DnLevel = 30 (or whatever number you decided to put) then a Green square will appear. This is potentially an oversold condition and maybe a good time to go Long. If a digital value of the RSI is greater or equal to UpLevel = 70 (or whatever number you decided to put) then a Red square will appear. This is potentially an overbought condition and maybe a good time

This indicator shows an Up trend ( Green square ) if a parabolic SAR value is below the current price, and Down trend ( Red square ) if a parabolic SAR value is above the current price from all Time Frame for each currency pairs. Input parameters from Symb1 to Symb9 — You may change any of these Symbols to any legal currency pair existed on your platform. step=0.0; — Represents the acceleration factor for PSAR indicator. maximum=0.2; — Maximum value for the acceleration factor for PSAR indicator

This indicator shows an Up trend (Green square ) if a fast MA is above slow MA and Down trend (Red square) if a fast MA is below a slow MA from all Time Frame for each currency pairs. Input parameters From Symb1 to Symb9 — You may change any of these Symbols to any legal currency pair existed on your platform. Period_Fast=5 — Averaging period for the first MA1. Method_Fast=MODE_EMA — Smoothing type for MA1. Price_Fast=PRICE_CLOSE — The price used for MA1. Period_Slow=21 — Averaging period for th

Purpose and functions of the indicator The indicator determines and marks the moments of trend change on the chart based on the theory of fractal levels breakout on any of the analyzed timeframes. If a breakout based on all rules is valid, a horizontal line with corresponding color will appear on the chart. If there is an uptrend, the line will be blue. In the descending trend, the line will be red. The blue line is a strong support level, the trader should look for buying opportunities above th

Fibolopes (name converted from Envelopes) Indicator is based on the Fibonacci sequence. The input parameter FiboNumPeriod is responsible for the number in the integer sequence (0, 1, 1, 2, 3, 5, 8 13, 34, 55, 89...) Bands will shown on 500 bars starting from the current bar. This indicator is calculating a ZigZag (Aqua line) which in combination with Fibolopes forms a system signals for opening (Z crossing Fibolopes) a new position and closing (Z crossing Fibolopes in opposite direction) an exis

This indicator is designed for M1 time frame and shows 2 lines: Sum of Points when the price goes up divided on Sum of Ticks when the price goes up (Aqua color). Sum of Points when the price goes down divided on Sum of Ticks when the price goes down (Orange color). You will see all major data as a comment in the left upper corner of the chart. Keep in mind that Sum of Points will be greater or equal to Sum of Ticks. Of course, the ATT is calculating all ticks forward only, beginning from the tim

This indicator is based on the classical indicators: RSI (Relative Strangth Index) and CCI (Commodity Channel Index) and will be helpful for those who love and know how to use not a visual but digital representation of the indicators. The indicator shows values from each timeframe. You will be able to change the main input parameters for each RSI and CCI for every TF. Parameters OverboughtLevel_R = 70; OversoldLevel_R = 30; OverboughtLevel_C = 100; OversoldLevel_C = -100; Example for M1: sTF1 =

The Volume Weighted ATR indicator is a helpful tool for measuring market activity. It is based on the idea of the Volume-Weighted ATR. Combining these two elements helps identify potential turning points or breakout opportunities. The indicator for the classification of the activity of the market uses the moving average and its multiples. Accordingly, where the VWATR bar is located (relative to the moving average), it is labelled as ultra-low, low, average, high, very high or ultra high. The Vo
FREE
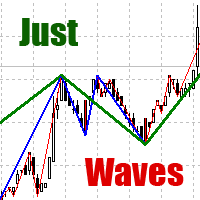
Among various methods of technical analysis of the Forex market, wave analysis is a fundamental one. Anyway, when it comes to the price change over a period of time, we are dealing with waves. According to Elliott's theory, waves are formed in a fractal way. On the same principle MT5 indicator Just Waves marks up waves of different levels (up to 8) and creates graphic lines indicating the beginning and ending points of the waves. Just Waves offers an objective criterion of a wave, thereby uncove

HiLo Activator v1.02 by xCalper The HiLo Activator is similar to moving average of previous highs and lows. It is a trend-following indicator used to display market’s direction of movement. The indicator is responsible for entry signals and also helps determine stop-loss levels. The HiLo Activator was first introduced by Robert Krausz in the Feb. 1998 issue of Stocks & Commodities Magazine.
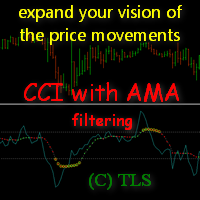
적응 이동 평균(АМА)을 통한 추가 필터링이 포함된 상품 채널 지수(CCI) 표시기(오실레이터)를 제공합니다. 이 기술 지표는 강세 및 약세 추세의 강점 또는 약점을 결정합니다. 그 원리는 기하급수적으로 평활화된 이동 평균과 원본을 기반으로 구축된 Kaufman 알고리즘을 사용하여 얻은 값을 필터링하여 주어진 기간 동안 평균값에서 가격 편차의 현재 변화 분석을 기반으로 합니다. 동적으로 변화하는 평활 요소로서 변동성을 결정하고 적용하기 위한 방법. 나는 또한 재량에 따라 선이나 점을 사용하여 증가 및 감소의 다색 선 표시 기능을 추가했으며 또한 지정된 최소 수준 아래 또는 지정된 최대 수준 위에 있는 선 값을 강조 표시할 수도 있습니다. 매개변수: PeriodCCI - CCI 발진기의 K 주기 PriceCCI - CCI 오실레이터 사용 가격 모드 MaximumLevel - 최대 레벨 값 MinimumLevel - 최소 레벨 값 ShowColoredAMA - 컬러 신호 라인 디스플레

This is the demo version of "All Harmonics 26" indicator . "All Harmonics 26" searches for 26 types of harmonic patterns and outputs them in a convenient way. You can check out the documentation here . This demo version has the following limitations: The indicator searches only for one type of harmonic patterns out of 26:- Gartley. The indicator outputs new patterns with a lag of 10 bars.
FREE

This is the forex visual orders tool & forex position size (lot) calculator with intuitive panel. Risk Reward Ratio Indicator works on all kind of symbols: currency pairs, indices, metals, commodities, cryptocurrencies, etc.
If you want to make sure that Risk Reward Ratio Indicator works on your favorite symbols contact us ( visit our profile ) and ask for 7-day free trial to test this tool without limits. If you want to place orders easier, faster and more intuitive? If you like to mark tr
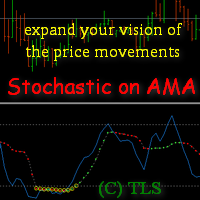
적응 이동 평균(АМА)을 통해 신호 라인 필터링과 함께 확률적 표시기(오실레이터)를 제공합니다. 또한 임의의 선이나 점을 사용하여 증감하는 다색 신호선 표시 기능을 추가했습니다. 또한 지정된 최소 레벨 아래 또는 지정된 최대 레벨 위에 있는 신호 라인 값을 강조 표시할 수 있습니다. 매개변수: PeriodK - 스토캐스틱 오실레이터의 주기 K Slowing - 스토캐스틱 오실레이터 감속 기간 PriceField - 가격 모드를 사용하는 스토캐스틱 오실레이터 MaximumLevel - 최대 레벨 값 MinimumLevel - 최소 레벨 값 ShowColoredAMA - 컬러 신호 라인 디스플레이 활성화/비활성화 ShowArrowsUpDn - 점 형태의 컬러 신호 라인 디스플레이 활성화/비활성화 ShowUnderLevelsExtremums - 최소 및 최대 레벨을 벗어난 신호 라인 값 강조 표시 활성화/비활성화 PeriodAMA - АМА 스무딩 기간 FastestAMA - 빠른
트레이딩 전략과 기술 지표를 판매하기에 가장 좋은 장소가 왜 MetaTrader 마켓인지 알고 계십니까? 광고나 소프트웨어 보호가 필요 없고, 지불 문제도 없습니다. 모든 것이 MetaTrader 마켓에서 제공됩니다.
트레이딩 기회를 놓치고 있어요:
- 무료 트레이딩 앱
- 복사용 8,000 이상의 시그널
- 금융 시장 개척을 위한 경제 뉴스
등록
로그인
계정이 없으시면, 가입하십시오
MQL5.com 웹사이트에 로그인을 하기 위해 쿠키를 허용하십시오.
브라우저에서 필요한 설정을 활성화하시지 않으면, 로그인할 수 없습니다.