MetaTrader 5용 새 기술 지표 - 26

The Bheurekso Pattern Indicator for MT5 helps traders automatically identify candlestick pattern that formed on the chart base on some japanese candle pattern and other indicator to improve accurate. This indicator scans all candles, recognizes and then displays any candle patterns formed on the chart. The candle displayed can be Bullish or Bearish Engulfing, Bullish or Bearish Harami, and so on. There are some free version now but almost that is repaint and lack off alert function. With this ve

추세가 돌발 할 때 경고를 가져옵니다. 이 지표는 가격이 지배적 인 추세의 방향으로 크게 움직일 때 신호를 보냅니다. 이러한 신호는 진입 점 또는 추세의 기존 위치에 추가 할 포인트 역할을 할 수 있습니다.
참고:추종 추세는 낮은 승리율(50%미만)을 가지고 있지만 평균 승리 무역의 반환은 일반적으로 평균 손실 무역보다 3~5 배 더 큽니다.
간단한 설정 드래그 앤 언제든지 프레임에,어떤 차트에 놓습니다. 경고 사용(선택 사항) 그리고 당신은 완료! 시각 및 오디오 경고 휴대 전화로 직접 전송 경고 터미널로 전송 경고 팝업 다중 사용 주식,외환,옵션,선물 유연한 모든 시간 프레임에서 작동 참고:추종 추세는 낮은 승리율(50%미만)을 가지고 있지만 평균 승리 무역의 반환은 일반적으로 평균 손실 무역보다 3~5 배 더 큽니다.
FREE

이 표시기를 사용하여 시장 내 개발 동향에 대한 경고를 받으십시오.
이 표시기를 사용하여,당신은 그들이 개발 시장에서 개발 동향에 대한 경고를 얻을 수있을 것입니다. 이 표시기는 추세 내의 항목 또는 종료를 식별하는 데 사용할 수 있습니다. 이 표시기는 더 높은 시간대의 정보를 현재 시간대의 가격 움직임과 결합하여 구매 또는 판매 신호를 출력합니다. 표시기는 추세 변화 또는 지배적 인 추세의 연속을 식별 할 수 있습니다.
참고:추세 다음 낮은 승리 비율을 가지고 있지만,추세의 수익률은 평균 손실의 3~5 배 크기가 될 수 있습니다. 간단한 설정 드래그 앤 언제든지 프레임에,어떤 차트에 놓습니다. 경고 사용(선택 사항) 그리고 당신은 완료! 시각 및 오디오 경고 휴대 전화로 직접 전송 경고 터미널로 전송 경고 팝업 다중 사용 주식,외환,옵션,선물 유연한 모든 시간 프레임에서 작동
FREE
추세를 따르고 다시 칠하지 않는 외환 거래 게이지.
신호는 완전 자동 방식으로 계산 및 제공되며 이동 평균 교차점을 기반으로 합니다. 이러한 신호는 단순한 매수/매도 화살표의 형태로 표시되므로 초보자에게 친숙한 도구입니다. 그럼에도 불구하고 신호 신뢰성은 정말 견고합니다. 모든 외환 거래 전략과 함께 사용할 수 있습니다.
Trend Signals Alerts Indicator는 모든 종류의 기간 및 통화 쌍에 적합합니다. 메인 트레이딩 차트에 바로 표시됩니다. 기본 설정은 입력 탭에서 직접 수정할 수 있습니다.
Trend Signals Alerts Indicator 자세히 보기 이 지표의 기본 아이디어는 시장 동향과 무역 신호를 보여주는 간단한 방법을 제공하는 것입니다. 결과적으로 초보자와 고급 거래자 모두 도구를 활용할 수 있습니다. 스크린샷에서 MT5에서 활성화되었을 때 어떻게 보이는지 살펴보십시오.
추세 신호 경고 표시기 해부 보시다시피, 그에 따라 거래하기

추세 측면 - 추세를 결정하기 위한 기술적 지표입니다. 그것은 몇 가지 본격적인 거래 전략의 집합입니다. 표시기는 고급 추세 필터링 시스템을 사용하고 통계 패널이 있으며 진입 및 퇴장 수준을 계산하고 동적 후행 정지 수준을 계산합니다. 모든 유형의 기호에 적합하며 신호와 결과를 다시 그리지 않습니다. 전문적인 추세 거래를 위한 포괄적인 도구입니다.
Trend Side 지표 세트에는 다중 통화 및 다중 시간대 추세 스캐너인 Andrews Trend Scanner, 통화 강도 분석기, 가능한 반전을 분석하는 다중 시간대 추세 분석기도 포함됩니다. 하나의 제품에 세 가지 추세 분석기가 내장되어 있습니다. 표시기를 구입한 후 무료 Andrews Trend Scanner 표시기 키트를 받으려면 저에게 연락하십시오. 표시기 및 모든 추가 패널은 전체 지침에 자세히 설명되어 있습니다. 이 매뉴얼은 또한 지표, 모든 입력 변수 및 신호 필터링을 통한 거래 전략에 대해 자세히 설명합니다.

"Pattern 123" is an indicator-a trading system built on a popular pattern, pattern 123.
This is the moment when we expect a reversal on the older trend and enter the continuation of the small trend, its 3rd impulse.
The indicator displays signals and markings on an open chart. You can enable/disable graphical constructions in the settings.
The indicator has a built-in notification system (email, mobile terminal, standard terminal alert).
"Pattern 123" has a table that displays signals fr
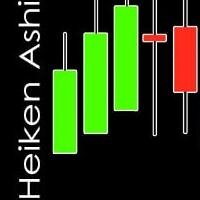
Heiken World is a heikin ashi candlestick strategy, to facilitate the view of the chart and capture trends for all types of pairs, it works perfectly in synthetic indices as well as forex! The strategy consists of taking out the common candles and placing only the Heiken World ones, plus adding some other channel like the Critical Channel since it facilitates where the market is going to bounce and to be able to facilitate the profit, it works for any type of temporality!

Multi trend is an indicator that marks the low and high to be able to do a good scalping, whether it is on the upside or on the downside, it is recommended to use it in h1, m30, m15, m5 and m1, it works very well for synthetic indices and forex in eur pairs /usd, usd/jpy, aud/cad, etc and in synthetics in the pairs Boom 300, crash 300, crash 500 and boom 500, volatility 75, jump 100, jump 75, volatility 10 etc!

Fractal MA is an indicator to hunt trends and scalp on h1 m30 m15 m5 and m1 works very well for synthetic indices and forex, in eur/usd, usd/jpy pairs, in synthetic indices in Range break 100, boom pairs 300, crash 300, boom 500 and crash 500, volatility 75, it is also programmed to hunt rebounds in m5, it has a profit percentage of 80% You can also trade in the 28 currency pairs

RSI Professional is based on an oscillator to hunt ranges and trends where you can also see it catches rebounds in the measurements according to the pair, it can be used for forex and synthetic indices, it works in any temporality, in the pairs that I use it are, eur/usd, usd/jpy, usd/chf and gbp/usd, in synthetics in the crash and boom pairs all, volatility 75, jumps, and range break!

The WRLD ZIGZAG, as it says in its name, is taking from candle to candle, it can be used in m1, m5, m15, m30 and h1 to scalp, it also has high and low to capture the next break that can be made, it can be used in synthetic indices as well as for forex too! It works in any type of pair for each market, where you can also add the Critical channel indicator to capture a beautiful profit trend

The concept of Harmonic Patterns was established by H.M. Gartley in 1932. Gartley wrote about a 5-point (XABCD) pattern (known as Gartley) in his book Profits in the Stock Market. This indicator scan and alert when 4th point (C) is complete and predict where D should be. In traditional, Gartley pattern include BAT pattern, Gartley pattern, butterfly pattern, crab pattern, deep crab pattern, shark pattern. Each pattern has its own set of fibonacci. In this indicator, we add more extended patter

PSI tools delivers new special look aimed to bring Detailed Account Statement for all important statistics. The integrated MT4 is not accurate. It does not account correctly for Deposits, Withdrawals and completely ignores cases like hedged trades, break-even trades, other broker related credits, bonuses and so on events and as a result all statistics like draw-down, total trades, average win size, rate and so on are totally skewed. PSI corrects these mistakes. In the example below a demo acc
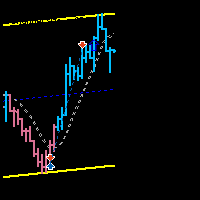
WLRD Trend is an indicator made to hunt trend candlestick trends or spikes in the synthetic index market, recommended to use in boom and crash, it works for any pair as well, but it is specialized in boom and crash as seen in the image, it has a High effectiveness range, it can be used in any temporality from m1 to d1, it also works for the 100/200 range break pair !!!

CCI Professional, has the simple fact of being able to do a scalping or intraday without using any other indicator to take some operation taking advantage of the rebounds in the lines of -200 for long and +200 for short, it is very easy to use and very practical for each market, it can be used for crash and boom since it works very well to hunt spikes, for volatiles and jumps, also for forex. It is used in any temporality.
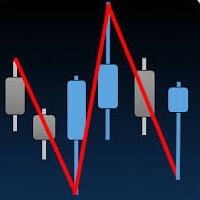
ZigZag Gold, Complies with the strategy of grabbing rebounds in small time frames, as well as for day trading, it also has a programming to be able to hunt long profit trends, it is used for synthetic, forex and crypto indices, nothing needs to be modified, use it as programmed, in case of crash and boom it is used to catch spikes in the temporality of m1, m5 and m15

Score Gold. simple indicator that tries to show when the price is trending by looking at bullish and bearish days It is used for scalping as intra daily, it works for forex, synthetic indices and crypto synthetics - crash and boom in m1 works well to hunt spikes volatility and jumps Range break too Forex - all pairs Crypto - All pairs! measurements of the one indicated. 7 - 0 and -7 ay is verified where the trend starts!

Step Gold. It is an Echo oscillator for trading synthetic and forex indices at a professional level, grasping long trends, whether long or short works for all seasons also for scalping, very good level in the crash and boom pairs, volatility's , jump in forex pairs, eur/usd usd/jpy, gbp/eur, aud/cad and others! when it hits the ceiling it gives a signal to a short when it hits the floor it signals a long! Enjoy it.

VIP Gold It has the last indicator of the session Gold of the 4! It works in all temporalities. It is an indicator where it marks blocks of structures. the rebounds are on the red line up, and the green line down depending on which pair you use it, It is made for synthetic indices, crash and boom pairs It works as support and resistance also to better find the floor and ceiling of each pair.

ZigZag Emerald The Zig Zag Emerald indicator is based on 4-point patterns The uptrend monotonicity condition begins with appearance of bullish patterns for highs and lows Similar logic applies for the downtrend It is programmed for synthetic indices and forex! It is used in synthetics in volatile pairs and jumps. suitable for all timeframes, both for scalping and intraday.

The MP Andean Oscillator is used to estimate the direction and also the degree of variations of trends. It contains 3 components: Bull component, Bear component and Signal component. A rising Bull component indicates that the market is up-trending while a rising Bear component indicates the presence of down-trending market. Settings: Oscillator period: Specifies the importance of the trends degree of variations measured by the indicator. Signal line per: Moving average period of the Signal line
FREE
This algorithm uses real time data to generate signals with an accuracy rate of 80%. It shows entries and where you should place both the stoploss and the take profit for each trade. It determines trend! It can even help you to become a signal provider! And it can generate up to 8 signals a day! You get access to a free forex trading community Operates on any broker compatible to synthetic indices and forex
if you need any assistance whatsapp +2774 35 35 744 or telegram link @pipsempire01
SYSTEM INTRODUCTION: The Binary Options Momentum System Is Specifically Designed For Binary Options Trading. Unlike Other Systems And Indicators That Were Adopted From Other Trading Environments For Binary Options. Little Wonder Why Many Of Such Systems Fail To Make Money . Many End Up Loosing Money For Their Users. A Very Important Fact That Must Be Noted Is The Fact That Application Of Martingale Is not Required. Thus Making It Safer For Traders Usage And Profitability. A Trader Can Use Fi

Introducing the South African Sniper indicator created by a small group of traders with a few years trading trading the financial market profitably . This is a plug and play indicator that provides you with BUY and SELL (SNIPER ENTRY) signals with TARGET and trail stops. The indicator Works with all MT5 trading instruments. The indicator uses previous chart data as receipt to speculate on future market moves.
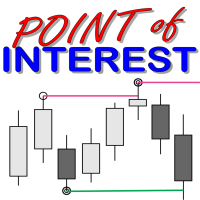
What is a Point of Interest? Traders who follow Smart Money Concepts may call this a Liquidity Point, or areas pools of liquidity have been built up by retail traders for for Big Banks to target to create large price movements in the market. As we all know, retail traders that use outdated and unreliable methods of trading like using trendlines, support and resistance, RSI, MACD, and many others to place trades and put their stop losses at keys points in the market. The "Big Banks" know these me

Inspired investing.com Technical Indicators, this indicator provides a comprehensive view of the symbol by synthesizing indicators including: RSI, StochRSI : have 3 level oversold - red, midle (aqua when upper, pink when lower), overbuy – blue Stoch: oversold – red, overbuy- blue, aqua when main line < signal line, pink when main line > signal line MACD: aqua when main line < signal line, pink when main line > signal line ADX: aqua when line plus > line minus, pink when line plus < line minus
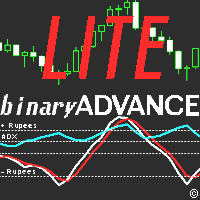
This is a Lite version of my Binary Wave Advance Oscillating indicator: https://www.mql5.com/en/market/product/90734 Free for a limited time! It reduces the less useful indicators, while keeping it's predictive modifications to make each indicator within better than their stock counter part. I reduced it and made it simpler, in the hopes it would be less overwhelming and more approachable. Contains: ADX Chaikin Money Flow Index Each have separate smoothing controls to tame faster periods, as we

This is similar in it's idea as the Binary Advance/Lite indicator, but this is intended to use as a levels indicator, as well as trend reversal and how ranging the market is. It takes several useful indicators and combines them in such a way as to declutter your charts, yet prove even more useful together, than separate. RSI, RVI, DeMarker, MACD are added together then multiplied by ATR and StdDev to reveal multiple factors: How far the price has changed, and as the price slows down and reverses

Note: Kindly test this product on open price only!!! Market Maker Pro is one of the genuine and an ideal indicator upon which you can easily rely on based on the signals and alerts it provides you with.
One of the common yet special feature of this indicator is that it can be used across all financial assets.
Sharp edged alerts indicates you accurately whether to place your trade on BUY (or) SELL and eliminates Noise.
Take a look at the screenshots attached below to get a better and clear

EYeQ Indicator는 STEP INDEX, VOLATILITY 10, 25,50,75 100, BOOM 및 CRUSH에 대한 진입 신호를 제공하는 강력한 도구입니다.
BOOM과 CRUSH 300, 500, 1000에서 SPIKES를 잡는 데 더 효과적입니다.
EYeQ 지표는 여러 시간대에 걸쳐 시장을 분석하고 추세를 기반으로 가장 적합한 진입점을 찾습니다. 신호가 해제될 때 알림을 받을 수 있도록 데스크톱 경고만 켜면 됩니다. 휴대폰 및 태블릿과 같은 다른 휴대용 장치에 푸시 알림을 허용하여 해당 장치에서 원격 거래에 대한 알림을 받을 수 있습니다.
N/B: Boom 및 Crush 지수에서 틱 거래를 피하십시오. 또한 표시기는 종료 지점을 제공하지 않으므로 MetaTrader 플랫폼에서 각 상품의 가장 낮은 랏 크기에서 3 USD의 이익이 발생하면 종료해야 합니다.
예: 가장 낮은 로트 크기; 스텝 인덱스-0.1
v75-0.001
v50-3
v2
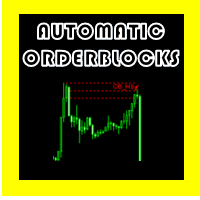
자동 주문 블록 OSW
(메타트레이더 5)
이 표시기는 다음과 같은 사전 설정된 규칙에 따라 주문 블록을 표시하는 역할을 합니다.
>이전의 충동을 깨뜨리는 충동이 있다는 것.
> 발견되면 형성된 촛대 패턴을 찾아 가장 효율적인 방법으로 장소의 고저를 계산하고 Order Block의 고저를 생성하는 역할을 합니다.
> 오더 블록이 생성된 후 인디케이터는 캔들이 오더 블록의 위아래 라인을 교차하는지 지속적으로 확인하여 가능한 신호가 있음을 나타내는 경고 신호를 생성합니다.
>지표가 제공하는 신호는 다른 전략과 같이 100% 효과적이지 않으므로 수동 기술 분석을 동반하는 것이 좋습니다.
> PC, 모바일 및 이메일의 세 가지 유형의 알림이 생성됩니다. 자동 주문 블록 OSW
(메타트레이더 5)
이 표시기는 다음과 같은 사전 설정된 규칙에 따라 주문 블록을 표시하는 역할을 합니다.
>이전의 충동을 깨뜨리는 충동이 있다는 것.
> 발견되면 형성된 촛대

이 표시기는 차트의 모든 주문에 대해 이미 설정한 TP 및 SL 값(해당 통화로)을 표시하여 모든 주문에 대한 손익을 추정하는 데 많은 도움이 됩니다(거래/주문 라인에 닫힘). 또한 PIP 값도 표시됩니다. 표시된 형식은 "이익 또는 손실 / PIP 값의 통화 값"입니다. TP 값은 녹색으로 표시되고 SL 값은 빨간색으로 표시됩니다..
질문이나 자세한 내용은 fxlife.asia@hotmail.com or fxlife.asia@yahoo.com 으로 판매자에게 언제든지 문의하십시오.
(그리고 곧 표시기에 추가될 다음 기능은 "자동 또는 반자동 TP 및 SL 설정"이며 고객은 무료로 업데이트 버전을 받을 것입니다. 감사합니다...)
(또는 표시에 일부 기능을 추가해야 한다고 생각하시면 언제든지 말씀해 주십시오...)

The most crucial price level in any "Volume Profile" is the "Point of Control" . Is the price level with the highest traded volume. And mainly, is the level where the big guys start there their positions, so it's an accumulation/distribution level for smart money.
The idea of the indicator arose after the "MR Volume Profile Rectangles" indicator was made. When creating the "MR Volume Profile Rectangles" indicator, we spent a lot of time comparing the volumes with those from the volume profil
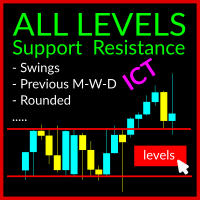
The Swing Levels Support and Resistance Indicator is a robust tool designed for MetaTrader 5 traders (also available for MT4). It aids in identifying crucial market levels where price direction may change by showcasing: Swing High and Swing Lows across all timeframes Previous Highs and Lows for Day, Week, and Month US Midnight level and Yesterday Midnight Level US Preopen 8:30 AM Level Rounded Levels This indicator features a toggle button, enabling you to display or hide these levels on the ch

The Magic SMMA indicator is of great help in determining trend direction. It can be an excellent addition to your existing strategy or the basis of a new one. We humans can make better decisions when we see better visually. So we designed it to show a different color for rising and falling trends. Everyone can customize this in the way that suits them best. By setting the Trend Period, we can optimize it for longer or shorter trends for our strategy. It is great for all time frames.
IF YOU NE

The Candle Countdown Timer for MetaTrader 4 (also available for MT5) is a vital indicator designed to help you manage your trading time effectively. It keeps you updated about market open and close times by displaying the remaining time before the current candle closes and a new one forms. This powerful tool enables you to make well-informed trading decisions. Key Features: Asia Range: Comes with an option to extend the range. Broker Time, New York, London Time: Displays the current broker time
FREE

The Magic SMA indicator is of great help in determining trend direction. It can be an excellent addition to your existing strategy or the basis of a new one. We humans can make better decisions when we see better visually. So we designed it to show a different color for rising and falling trends. Everyone can customize this in the way that suits them best. By setting the Trend Period, we can optimize it for longer or shorter trends for our strategy. It is great for all time frames.
IF YOU NEE

The Magic EMA indicator is of great help in determining trend direction. It can be an excellent addition to your existing strategy or the basis of a new one. We humans can make better decisions when we see better visually. So we designed it to show a different color for rising and falling trends. Everyone can customize this in the way that suits them best. By setting the Trend Period, we can optimize it for longer or shorter trends for our strategy. It is great for all time frames.
IF YOU NEE

The Magic LWMA indicator is of great help in determining trend direction. It can be an excellent addition to your existing strategy or the basis of a new one. We humans can make better decisions when we see better visually. So we designed it to show a different color for rising and falling trends. Everyone can customize this in the way that suits them best. By setting the Trend Period, we can optimize it for longer or shorter trends for our strategy. It is great for all time frames.
IF YOU NE
Automatically scans the chart to find Harmonic Patterns, and give you the chance to enter early in good operations. Also if selected, it will alert you in advance when future patterns appears, showing you a projection of a posible future pattern. The main goal for this algorithm is to determine with high precision the moment when a trend ends and a new one begins. Giving you the best price within a reversal. We have added the "Golden Trade", we define it as the perfect order: For those ord

It is the simplest indicator in existence. It has only one function: report the seconds elapsed since the last minute end in a very convenient way, with a label that can be moved in the chart, so that the trader does not have to take his eye off the forming candle. It is used on M1, but also on larger intervals, for those interested in opening/closing positions at the best time. Sometimes an intense movement in the last 10" of the minute gives indications of future trend, and can be used for sc
FREE

Key Price Levels Indicator Indicator that shows the highs and lows for the significant price levels for past periods that could be potentially considered as reaction levels. The indicator displays the following price levels: Yesterday high and low The day before yesterday high and low Two days back high and low Last week high and low Last month high and low Last three month high and low (Quarter) Last year high and low
FREE
Easily convert your candlestick patterns into signals!
Eval - Command interpreter - Command line interface - String converter - Customizable sign I bring one more indicator that was requested by a real trader. Thanks for the suggestion mate!
The String2Signal indicator will allow you to write your candlestick patterns and get the signals on the screen, integrating with EAs or using it to assist in manual operations. You type a text with your setup and the indicator converts it into the MQ
!! FLASH SALE !! Over 80% off !! For ONE week only. Now only $47 - normally $297! >>> Ends on 30 June 2023 - Don't miss it!
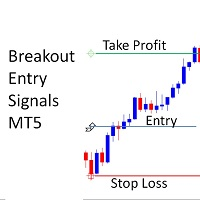
Buy and Sell Alerts when price breaks out following strict price action. Sends Alerts – #On MT5 To Your Phone To Your Email
Does not repaint .
Works on any Forex pair, any timeframe.
10 Activations allowed so you are free from limitations >> MT4 Version Here For spreads from a tiny 0.1pip RAW/ECN Accounts, click here . Check out my Waka Esque EA sign

Critical channel an indicator where trend channels are shown and the pivots are seized the indicator is for scalping and is used in M1/M5/M15/Y M30 it is also analyzed in H1 it is used both for forex and synthetic indices %100 recommended! It goes very well in the eur/usd, usd/jpy, aud/cad, etc. in synthetic indices for volatility, crash and boom and jump use with japanese candles

Highs and lows fulfill the same function as support and resistance, this indicator works both for scalping and for intraday, it can be used in markets such as forex and synthetic indices, it works very well in the eur/usd usd/jpy gbp/usd pair and others , in synthetics in the pairs volatility 75, volatility 25, volatility 10, jump all crash and boom too range break 100 !

!! FLASH SALE !! Over 80% off !! For ONE week only. Now only $47 - normally $297! >>> Ends on 30 June 2023 - Don't miss it!
Buy and Sell Arrows when price breaks away from mean price. Sends Alerts – On MT5 To Your Phone To Your Email
Does not repaint .
Works on any Forex pair, any timeframe.
10 Activations allowed so you are free from limitations >> MT4 Version Here For spreads from a tiny 0.1 pips RAW/ECN Accounts, click here . Check out my Waka Esque EA signal here: >>

A free deals history results panel.
Its working principle is to calculate the income of each month by consulting the historical trading records, and show it in the form of a table. At the same time, it also statistics all the trading results of the current account, so that traders can adjust their trading strategies according to the historical records.
If you have more needs, please contact the author!
FREE
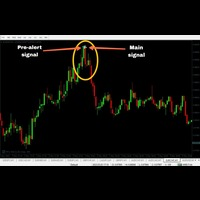
'Zoro PRO' is a reversal strategy based MT5 indicator with advance pre-alert system. Its an 100% non repaint indicator with an average accuracy of about 70-95% in any kind of market. (EXCEPT BAD MARKET AND NEWS TIME) MT4 version https://www.mql5.com/en/market/product/89772 PLEASE NOTE: MT4 version has more accuracy. Better avoid this MT5 version and go for the above link of MT4 version
Recommended Broker: Alpari, Amarkets, tickmill. Recommended pairs for M1
EURUSD
USDJPY
EURGBP
Update 2.0: Added the option to change LWMA to the other 3 basic MA modes. I also added Smoothing to it, to tame it a bit. You can input 1 as smoothing period and no smoothing will be applied.
Update 2.1: Removed Trend Typical Open/Close as is was the same behavior as Trend Open/Close. Trend follow works by averaging the high/low with close/open. If Close is above Open, Trend Close = Close+High/2, averaging between close and high, and when Close drops below Open, it's calculation automatically

표시기는 지정된 막대 수에 대한 작업 히스토그램에서 최대 및 최소 가격 볼륨(시장 프로필)의 수준을 찾습니다. 복합 프로파일. 히스토그램의 높이는 완전 자동이며 모든 기기 및 기간에 맞게 조정됩니다. 저자의 알고리즘이 사용되며 잘 알려진 아날로그를 반복하지 않습니다. 두 히스토그램의 높이는 촛불의 평균 높이와 거의 같습니다. 스마트 경고는 볼륨 레벨에 관한 가격에 대해 알려 도움이 될 것입니다.
개념Smart Money. Low Volume - Imbalance. ,좋은 시장 상황을 찾아 시장의 구조를 결정하고 바이너리 옵션에 대한 필터로 사용됩니다. 그것은 가격에 대한 자석입니다. High Volume - Liquidity. 는 시험을 위해 축적을 나갈 때 사용됩니다.
입력 매개 변수.
기본. Bars Count - 계산 및 표시 할 막대 수. Signal Fractal = 5 (색상 신호 레벨). 수준은 다음과 같은 조건에서 신호가 될 것입니다:그것을 초과하지 않는

check out Megaclasic Spikes Robot here: https://www.mql5.com/en/market/product/109140 https://www.mql5.com/en/market/product/109140
MEGASPIKES BOOM AND CRASH v1.32 NB: source codes of this indicator are available: PM me: https://t.me/Machofx PLEASE JOIN THE CHANNEL BELOW TO HAVE ACCESS TO ALL PREVIOUS VERSIONS check out Spikes robot
BoomCrash Cheatcode EA : https://www.mql5.com/en/market/product/103365 https://t.me/machofxprotradin g Note: PLEASE THE NEW VERSION 1.32 OF THE SPIKES
FREE

MMD의 다이아몬드
Diamond by MMD는 가격 행동에 중요한 장소를 식별하는 고급 지표입니다. 이 표시기는 모든 시간대에서 차트의 가격 반응 영역을 감지하고 표시합니다. MMD 방법론에서 지식 피라미드의 요소 중 하나인 다이아몬드는 매우 엄격한 조건을 충족하는 양초입니다. 다이아몬드에는 두 가지 주요 유형이 있습니다. - 표준 다이아몬드 - 역 치매. 이 두 모델은 자동으로 식별되어 차트에 표시됩니다. 지표는 예를 들어 H1 간격의 M5 간격에서 다이아몬드를 표시할 수 있습니다. 지표의 기본 설정은 현재 차트가 열려 있는 기간에 다이아몬드를 표시합니다.
표시기 매개변수에 대한 설명입니다. 표준 다이아몬드 사용 - 모델 00100에서 다이아몬드를 표시하거나 숨깁니다. 반전된 다이아몬드 사용 - 모델 0010100에서 다이아몬드를 표시하거나 숨깁니다. 다이아몬드 시간 프레임 - 다이아몬드가 표시되는 간격을 지정할 수 있는 옵션입니다. 예를 들어 M1 또는 H1 캔들로 차

MT5용 Obie Scalper Alerts 지표는 스캘퍼와 데이 트레이더 모두를 위한 탁월한 매수/매도 신호 도구입니다.
신호는 매우 이해하기 쉽고 기본 차트 창에 파란색과 빨간색 점으로 나타납니다.
구매 및 판매 신호: 파란색 점은 매수 신호입니다. 빨간색 점은 매도 신호입니다. 지표의 다양한 설정과 입력 값을 자유롭게 실험해 보십시오.
이 표시기는 모든 통화 쌍(메이저, 마이너 및 엑조틱)에서 동일하게 잘 작동하며 올바르게 사용하면 유망한 결과를 보여줍니다.
거래 팁: 이 스캘퍼 표시기로 거래할 때 자신이 좋아하는 거래 항목, 손절매 및 이익실현 전략을 자유롭게 사용하십시오.
항상 그렇듯이 전체 추세에 동의하고 이 지표를 완전히 이해할 때까지 먼저 데모 계정에서 연습하십시오.
표시기 사양 및 입력: 거래 플랫폼: Metatrader 5(MT5)용으로 개발됨
거래 상품: Forex, 주식, 상품, 주가 지수, 귀금속, 에너지 및 주식에 대한 작업
시
Basic technical analysis tools use signals during market changes by providing critical information that can influence investment and trading decisions. Several technical analysis tools are developed for this purpose, and one of the most popular indicators traders use the KDJ Random index. It's known as the Random Index, is primarily a trend-following indicator that aids traders in identifying trends and prime entry points.
Features
It analyzes and projects changes in trends and price patte

The Time End bar by MMD is a simple indicator that shows the number of seconds remaining in the three selected intervals. According to the MMD methodology, the moment when a directional price movement occurs is important. This indicator allows you to use this relationship more effectively in Forex and Futures trading.
Functionality description:
Time Frame 1 Period - defining the first time interval Time Frame 1 Color - specifying the color for the first time interval Time Frame 1 Period - d
FREE

FOR CRASH 500 ONLY!! MT5
*This is a smooth heiken ashi setup meant to be used on CRASH 500 in combination with other indicators. *You are welcome to test it on other markets aswell. *I will be posting other indicators aswell to help with trading the crash 500 market. *You can use this to help smooth out price if you do struggle with reading the charts as is. * Just note heiken ashi doesnt represent real price action only smoothes it out for ease of read.
FREE

The KT HalfTrend is a moving average-based trend indicator that draws zones. It marks a trend shift by drawing bearish and bullish invalidation zones on the chart. It also displays the trend buy-sell strength with arrows on the main chart. The indicator will be flat if no trend indicates accumulation, temporary price, or distribution zones. If there is a trend, there will be a slope in that direction. The trend signals are substantial if the slope is steep, either to the upside or the downside.

This indicator is developed based on the multiple session trading to aid in analysis for all the day traders. The indicator supports all currency pairs as well as other trading instruments like indicies, commodities, metals ,etc. The way the indicator work is by making analysis on your behalf. During asian session that's when the indicator does the calculations and provided trading plans in form of areas on the chart for the current day. And this process happens everyday which allows for hands f

Defining Range ( DR ) and Implied Defining Range ( IDR ) indicator
New Pro version here :
https://www.mql5.com/en/market/product/91851?source=Site+Profile+Seller
Show DR and IDR ranges on the chart for Regular , Overnight and After Sessions
for more information how DR and IDR work and the high probability watch : https://www.youtube.com/@themas7er or https://twitter.com/IamMas7er
Remember to set set your chart TimeZone when you attach indicator to the chart under indicator set
FREE

To get access to MT4 version please click here . - This is the exact conversion from TradingView: "Hull Suite" By "Insilico". - This is a light-load processing and non-repaint indicator. - You can message in private chat for further changes you need. Here is the source code of a simple Expert Advisor operating based on signals from Hull Suite . #include CTrade trade; int handle_hull= 0 ; input group "EA Setting" input int magic_number= 123456 ; //magic number input double fixe

Unleash the Power of Trading with the Boss Key Levels Indicator!
Are you ready to conquer the markets and elevate your trading prowess to extraordinary heights? Look no further! The Boss Key Levels Indicator is your secret weapon, designed to revolutionize the way you approach the financial markets and supercharge your trading strategy.
Harness the potential of Key Levels, those pivotal price zones that hold the key to market movements. With the Boss Key Levels Indicator, you gain acce

What Is Market Imbalance? Market Imbalance, also known as "IPA" or Improper Price Action, is when price moves so quick in one direction with no orders on the other side of the market to mitigate the price movement. We all know Big Banks, or "Smart Money", can move the market by placing huge orders which in turn can move price significantly. They can do this because Big Banks are the top 10 Forex traders in the world . But unfortunately, the Big Banks cannot leave these orders in drawdown and mu

Break Even Line by MMD
The Break Even line is a useful indicator for people using strategies that allow simultaneous trades in both directions, such as the MMD methodology. This indicator is useful when playing statistical models and averaging positions in accumulation and distribution zones. The indicator draws levels by summing positions in three groups: positions included in BUY, positions included in SELL and all positions included.
Functionality description:
Show BUY BELine - shows
FREE
The Schaff Trend Cycle (STC) is a technical analysis tool that helps traders and investors plot highly-probable predictions on the price direction of an instrument. Due to its predictive properties, It's a good tool for foreign exchange (forex) traders to plot buy and sell signals. The Schaff Trend Cycle was developed by prominent forex trader and analyst Doug Schaff in 1999. The idea driving the STC is the proven narrative that market trends rise or fall in cyclical patterns across all time fr
Update 2.2: Added MFI with predictive mod. Updated all indicators to reflect similar values, to combine multiple ones to rest well on overbought/oversold lines.
Update 2.3: Minor bug fixes.
Update 2.4: Removed buggy indicators DeMarker, and MACD, as it was too complicated and not as accurate as the rest due to it's nature. Added Awesome Oscillator. removed spreads, as it bogged the indicator down. Added other features, like indicator value compensators to match each other's levels when combine

The double top bottom pattern is arguably one of the technical analysis's most popular chart patterns. These patterns are used to capitalize on recurring patterns and identify trend reversal patterns, thereby creating well-placed entry and exit levels. The KT Double Top Bottom is based on these patterns and fine-tunes the trade signal development process for traders.
Features
It's based on one of the most reliable trading patterns and brings some fine-tuning and automation to the process. A

Time Line by MMD is a simple indicator that supports historical data analysis and trading on statistical models that follow the MMD methodology.
Start Time - specifying the time when we start analyzing and playing the MMD statistical model Time Duration in minutes - duration of the model and its highest effectiveness (after the end of the line, the price returns - statistically - to the set level) Lookback days - the number of days back, subjected to historical analysis Base Time Frame - the
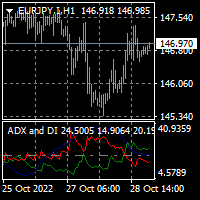
To download MT4 version please click here . This is the exact conversion from TradingView indicator: "ADX and DI" By " BeikabuOyaji". This is probably the most popular implementation of Average Directional Index available. This indicator lets you read the buffers as below: index 0: DIPlusBuffer ==> Green Line by default index 1: DIMinusBuffer ==> Red Line by default index 2: ADXBuffer ==> Navy Line by default - You can message in private chat for further changes you need. Note: This is a non-rep

CoioteOscilator é um rastreador de tendência e padrões de estruturas gráficas. O Indicador é composto de 3 elementos. oscilador principal lento: histograma com nível de 0 até 50 e 4 cores, 2 compradoras, de 0 até 30 e acima de 30 e duas vendedoras, de 0 até 30 e acima de 30. oscilador principal rápido: linha magenta com nível de -50 até 50. gatilho: linha amarela com nível de -50 até 50. O oscilador principal lento é um rastreador de tendência primaria.
O oscilador principal rápido é
MetaTrader 마켓은 거래 로봇과 기술 지표들의 독특한 스토어입니다.
MQL5.community 사용자 메모를 읽어보셔서 트레이더들에게 제공하는 고유한 서비스(거래 시그널 복사, 프리랜서가 개발한 맞춤형 애플리케이션, 결제 시스템 및 MQL5 클라우드 네트워크를 통한 자동 결제)에 대해 자세히 알아보십시오.
트레이딩 기회를 놓치고 있어요:
- 무료 트레이딩 앱
- 복사용 8,000 이상의 시그널
- 금융 시장 개척을 위한 경제 뉴스
등록
로그인
계정이 없으시면, 가입하십시오
MQL5.com 웹사이트에 로그인을 하기 위해 쿠키를 허용하십시오.
브라우저에서 필요한 설정을 활성화하시지 않으면, 로그인할 수 없습니다.