 MetaTrader 5
 Experts
 지표
 라이브러리
 유틸리티
 위젯
 규칙
MetaTrader 4용 Expert Advisor 및 지표 - 58
 트레이딩 로봇은 자동으로 시장거래를 수행하는 반면 지표는 가격을 더 잘 분석하고 가격 행동을 예측할 수 있게 해줍니다.
이러한 어플리케이션을 사용하면 MetaTrader 4에서 더 많은 기회를 포착하는 동시에 보다 정보에 입각한 방식으로 거래를 수행할 수 있습니다.

Trump Arrow is for trading the trends of the markets. It uses convergence and divergence. Use it during active times to get behind a trend and follow it with MA filters or other strategies you have. The indicator works well for small time frames just and it suggests using 15 min. Others work too but for day trading 5-15 is best. 1 hr charts if you want to filter for longer term trends.
A basic strategy with advanced risk management. This expert advisor employs a simple trading strategy with a focus on dynamic risk management. Values that determine trade conditions and risk management are all customizable. The trading strategy is based off of Moving Average and Aroon trend indicators. When the short moving average is above the long moving average, and the aroon up line is above the aroon down line, the trade condition is satisfied, and the advisor will go long unless it alread

while ''Angel of gold '' https://www.mql5.com/en/market/product/129257 is trend follower then '' Dyna Gold Ai '' is counter trend catcher with rapid growth by assisting hedge and martingale (hedge for assisting draw downs to minimal ) it skip the orders or dynamically adjust orders with margin requirement initial intro plan at $50 usd to test , price increase with future sales Gold only ea (important and this condition is rare : martingale risk involved in big one directional movement ,
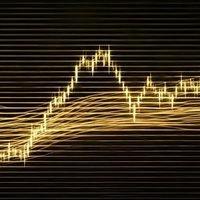
This is an indicator that seeks to show support and resistance zones in channels through expansion .
Abraxis Indicator Discover our innovative Abraxis Indicator , a powerful tool designed for traders seeking to refine their chart analysis and maximize their trading opportunities. This indicator was developed to operate efficiently across different timeframes, allowing you to adjust your strategies according to your needs. Key Features Calculation of Lines Based on Previous Pil
Why Choose SPYDR Pro EA? Optimized for Indices : Perfectly tailored for trading major indices like US 500, US 30, US 100, and DAX .
Daily Timeframe Strategy : Works exclusively on the Daily (D1) chart , ensuring low-frequency, high-probability trades.
Advanced Risk Management : Built-in stop-loss (SL) and take-profit (TP) levels to protect your capital.
No Martingale or Grid Strategies : Safe and sustainable trading approach without risky money management techniques.
User

[ MT5 Version ] DoIt GBP Master — Confident GBPUSD Automation for Consistent, Stress-Free Growth
DoIt GBP Master is crafted for traders who want real consistency, emotional control, and stress-free automation — without the usual complexity and frustration of other Expert Advisors. Focused exclusively on GBPUSD for its predictable behavior and deep liquidity, it delivers high-performance trading powered by a proven live-ready strategy, dynamic risk control, and ready-to-go settings for
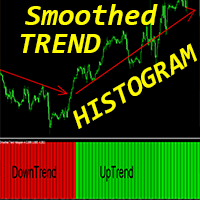
Crypto_Forex 지표 "Smoothed Trend Histogram" for MT4, No Repaint. - Smoothed Trend Histogram 지표는 모든 표준 이동 평균 교차보다 훨씬 효율적입니다. - 특히 큰 추세 감지에 중점을 둡니다. - 지표에는 두 가지 색상이 있습니다. 하락 추세는 빨간색, 상승 추세는 녹색입니다(색상은 설정에서 변경할 수 있음). - 모바일 및 PC 알림이 있습니다. - 이 지표를 다른 거래 방식과 결합하는 것이 좋습니다. 가격 활동, 스캘핑, 모멘텀 거래, 기타 지표. .......................................................................... 여기를 클릭하여 고품질 트레이딩 로봇과 지표를 확인하세요! 본 제품은 MQL5 웹사이트에서만 제공되는 정품입니다.

️ Warning : Before purchasing the robot, make sure you have a broker with a very low spread (between 2 and 10 points maximum, either fixed or not exceeding 10). This is a critical requirement to maximize the performance of this robot specialized in trading gold. GoldenPandel is exclusively designed for the gold market (XAU/USD). This trading robot can become a game-changer, transforming your trading experience and enhancing your results. Its precise and optimized algorithm is tailored to levera

MonkeyGold is an innovative tool designed to optimize your operations in the financial market. This system is particularly focused on two crucial areas: The Power of Fibonacci Fibonacci : Uses Fibonacci sequences to identify support and resistance levels, allowing for a more accurate analysis of market movements. Advanced Calculations Moving Averages : Integrates calculations based on moving averages to detect trends and ideal entry and exit points. ATR ( Average True Range ): Evalua

Adjustable Volume Profile Indicator The Adjustable Volume Profile is a custom MetaTrader 4 (MT4) indicator designed to visually display the volume distribution of a financial instrument across a specific price range and time period. This indicator allows traders to analyze the volume profile based on either real volume or tick volume, helping to identify key levels of support, resistance, and market activity.
Key Features: Customizable Timeframe: The indicator can be set to any available timefr

This is an expert advisor for operations on the Ethereum / USD pair in 1H, with one operation at a time with SL and TP, following Fibonacci patterns .
Ether Fibe Welcome! We are excited to present our Expert Advisor , an innovative tool designed to optimize your operations in the financial market. This system particularly focuses on two crucial areas: The Power of Fibonacci Fibonacci : Utilizes Fibonacci sequences to identify support and resistance levels, allowing for a more a

Initial Stop Loss Setup : Automatically applies an initial stop loss (in points) immediately when a trade is opened. Provides peace of mind by ensuring every trade is protected against unfavorable price movements. Dynamic Trailing Stop : Adjusts the stop loss at the close of each candle based on a fixed point distance. Moves the stop loss incrementally closer to the current price, locking in profits as the market moves in your favor. Works Across All Timeframes : The EA adapts to any chart time

An expert advisor for semi-automated trading. Set 1 or 2 levels to break past, stop distances, minimal reversal distances or specific price targets. Works on a 1-minute time frame. Ideal for working a range either short term or long term. It allows for multiple re-entries in fast markets after nearby stops are hit. Can be a set-and-forget ea or adjusted multiple times throughout the day depending on your trading style. It's based on the principles described in the article - https://www.mql5.com/
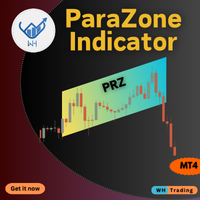
The ParaZone Indicator MT4 helps you spot areas where price trends are likely to reverse. It marks these zones on your chart using a unique parallelogram shape, making it easier to find the best points to enter or exit trades. Whether you’re a beginner or experienced trader, this tool can help improve your trading decisions. Key Features: Accurate Reversal Detection: Identifies key zones where price may change direction. Dynamic Zone Adaptation: Zones adjust in real-time to follow market

"Niberia" is a modern and highly efficient trading bot designed for Forex market traders. It is a powerful tool for trading automation, ensuring precise and timely execution of strategies with minimal human intervention. Key Features of "Niberia": Use of Pending Orders:
The bot operates with pending orders that activate only when the price reaches a specific level. During price movement, the system automatically adjusts pending orders using trailing techniques. Stop-Loss and Take-Profit:
Once
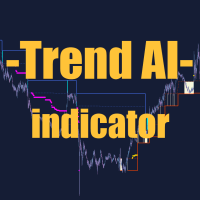
Trend AI Indicator 설명:
Trend AI Indicator는 인공 지능을 사용하여 트렌드와 주요 레벨을 식별하는 강력한 시장 분석 도구입니다. 이 지표는 변화하는 시장 조건에 자동으로 적응하여 의사 결정을 위한 정확한 데이터를 제공합니다. 주요 기능: 트렌드 식별: 이 지표는 머신 러닝 알고리즘을 사용하여 트렌드 방향(상승, 하락, 횡보)을 정확하게 판단합니다. 주요 레벨: 과거 데이터를 기반으로 지지 및 저항 레벨을 자동으로 구축합니다. 안전한 거래 구역: 가능한 최소 스톱 로스로 리스크를 최소화하는 구역을 정의합니다. 적응성: 지표는 시장 변동성에 적응하여 잘못된 데이터를 최소화합니다. 사용자 정의 설정: 다양한 거래 전략 및 시간대에 맞게 사용자 정의 가능합니다. 장점: AI 사용으로 높은 정확도 제공. 모든 시장 유형(외환, 주식, 암호화폐)에 적합합니다. 안전한 거래 구역은 가능한 최소 스톱 로스로 리스크를 최소화합니다. 초보자와 전문가

InfinityTrade is an automated trading system that applies spectral analysis methods to financial time series to identify dominant cycles in price movements. At its core, the system uses Fourier decomposition applied to historical closing price data.
How It Works:
InfinityTrade processes market data using Fourier series to extract the most influential cyclic components. This decomposition allows the algorithm to break down complex price behavior into simpler harmonic patterns. The system then e
This is the Parabolic Dashboard MT4. This dashboard will scan multiple timeframes and symbols in MT5 platform, from M1 chart to D1 chart. It will send the buy/sell signals by alert on the platform or sending notification to your phone or message you via a email.
The buy signal is generated when the SAR changes its position from above to below of the candle. The sell signal is is generated when the SAR changes its position from below to above of the candle. The up/down trend color will be di

Reserve Gold is a fully automated trading expert advisor robot that has been designed explicitly for scalping during the period of weak market volatility. EA contains self-adaptive market algorithms with reinforcement learning elements. This EA uses an advanced algorithm to find bespoke entry points and several additional filters for entering and exiting the market with ease. The EA has been subjected to stress tests for a period of 10 years and passes every year with a very advantageous
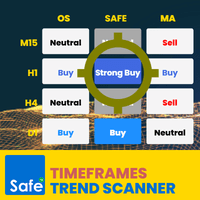
Timeframes Trend Scanner is a trend analyzer or trend screener indicator that helps you know the trend in all timeframes of selected symbol you are watching .
This indicator provides clear & detailed analysis results on a beautiful dashboard, let you able to use this result right away without need to do any additional analysis. How it works
Step 1: Calculate values of 23 selected & trusted technical indicators (Oscillator & Moving Average indicators)
Step 2: Analyze all indicators using best pra
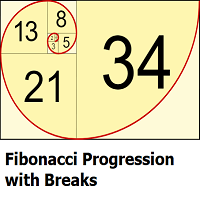
This indicator highlights points where price significantly deviates from a central level. This deviation distance is determined by a user-set value or using a multiple of a period 200 Atr and is multiplied by successive values of the Fibonacci sequence. Settings
Method: Distance method, options include "Manual" or "Atr"
Size: Distance in points if the selected method is "Manual" or Atr multiplier if the selected method is "Atr"
Sequence Length: Determines the maximum number of significant devia
Get ALL my MT4 & MT5 indicators FREE — See how here
Special offer : ALL TOOLS , just $35 each! New tools will be $30 for the first week or the first 3 purchases ! Trading Tools Channel on MQL5 : Join my MQL5 channel to update the latest news from me I. 소개
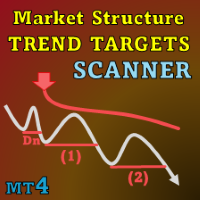
Market Structure Trend Targets Scanner 는 시장 동향을 분석하고, 돌파 지점을 식별하며, 동적 스톱로스를 통해 위험을 관리하는 강력한 도구입니다. 이전 고점과 저점을 추적하여 돌파를 포착함으로써 이 도구는 트레이더가 직관적으로 시장 동향과 잠재적인 반전을 신속하게 인식하도록 도와줍니다. 더 많은 MT5 버전을 보려면: Market Structure Trend Targets

The Gann Scalping Gold Indicator is a robust technical analysis tool designed for precision trading in gold markets. It leverages Gann-based methodologies to identify key price levels, enabling traders to anticipate potential market reversals, breakouts, and areas of consolidation. Daily Reset Logic: Automatically resets touch statuses at the start of a new trading day, ensuring that the indicator aligns with fresh daily trends. How It Works: The indicator draws horizontal lines at predefined le

Please be aware of the risks involved using an automated trading strategy: Past performance is no guarantee of future profitability (the EA could also make losses). The backtests shown (e.g. in screenshots) are optimized to find the best parameters but therefore do not give a realistic prediction of future profitability. This strategy will always use a stop loss, but execution of the SL depends on your broker, so losses can be larger if there is slippage.
LAUNCH PROMO: Only a few copies left

Automate your Trendsurfer trailing stop management - day and night With this Expert Advisor for Metatrader 4 you save time, avoid mistakes and trade more relaxed - specially developed for the Trendsurfer trading system.
Always the right stop loss Fully automatic Simple to use Saves you time How it works
1. download the Expert Advisor and install it in Metatrader 4 (I will give you instructions on how to do this)
2. define your stop-loss rule
3. run your computer or VPS - the Expert Advisor

Enhance Your Trading Potential with an Intelligent Combination of Divergence and Grid Strategies. (This EA was developed using fxDreema software by eaforexcenter) Key Features of This EA Professional-Grade Divergence Trading The EA utilizes Bollinger Bands (BB) and RSI to identify highly accurate Divergence signals : Buy Signal : RSI forms a Higher Low while the price makes a Lower Low. Sell Signal : RSI forms a Lower High while the price makes a Higher High. Divergence lines are drawn directly
Visual Vortex Momentum Shift Indicator Unlock the potential of momentum shifts in the market with the Visual Vortex Momentum Shift Indicator! This advanced tool is designed to help traders identify crucial turning points and momentum reversals with clarity and precision. However, this indicator is not optimized and is created for you to optimize based on your trading preferences and strategies. What is the Visual Vortex Momentum Shift Indicator? The indicator focuses on detecting momentum shift

Unleash the Power of Market Dynamics with the Vortex Indicator! The Visual Vortex Indicator is your advanced tool for decoding market trends, reversals, and momentum shifts. Priced at $65, this indicator provides a comprehensive view of market behavior, but it’s designed for you to fine-tune and optimize it according to your unique trading strategy. What Makes It Unique?
The Vortex Indicator is based on a strategy that identifies directional movements and trend strength by analyzing key price d

Visual Eagle Dive Indicator The Eagle Dive Indicator is your ultimate tool for analyzing and interpreting market movements with precision. This powerful indicator is designed to help you visualize key market trends and patterns, but it is not optimized. It has been intentionally created for you to customize and optimize according to your trading style and preferences. Key Features and Entry Logic Market Diving Signals: The Eagle Dive Indicator identifies critical market movements, resembling th

Blow Stopper Genesis Prop Firm EA (MT4) Overview
Blow Stopper Genesis is an advanced trading algorithm tailored for MT4 and optimized for the 1-hour timeframe . Designed with precision and adaptability, it identifies the best entry points and manages trades efficiently, ensuring performance across all currency pairs and XAUUSD (Gold). Key Features Precision Entry Logic :
The EA uses the Vidya Moving Average to identify optimal entry points, ensuring high-quality trades only when conditions are

This indicator is designed to help you forecast the potential high and low prices for the current trading day, based on the high and low of the previous day. It does this by applying a customizable percentage increase or decrease to those levels. How It Works: The idea is simple: It looks at the previous day's high and low prices and then adjusts them by a percentage you choose. Here's what that means: Predicted High: This is calculated by taking the high price of the previous day and adding a p

The Visual Dragon Cloud Indicator is designed to help traders analyze market behavior through trend identification, support and resistance levels, and potential reversals. It adapts to changing market conditions by using cloud formations to highlight momentum shifts and price direction. This tool provides traders with key price zones for entries and exits based on how price interacts with the cloud. When price moves into or out of specific cloud layers, it signals possible bullish or bearish tr

The Range Directional Force Indicator is designed to help traders analyze market trends, reversals, and directional strength. It focuses on price movements within defined ranges, identifying key moments when the market is gaining momentum or preparing for a shift. By dividing the chart into dynamic price ranges, the indicator detects critical support and resistance levels. It calculates the directional force of price movements, highlighting potential entry and exit points based on market sentim

Welcome to the Visual Envelope Trend Flow Indicator! This tool is not optimized and has been crafted specifically for you to explore, test, and fine-tune according to your unique trading strategy. It offers flexibility and a powerful starting point for traders aiming to master trend identification and price flow dynamics. The Visual Envelope Trend Flow Indicator leverages the concept of envelope channels, which are dynamic boundaries drawn around price action. These boundaries are calculated ba

Optimize Your Strategy with the Envelope Support Bounce Indicator! The Visual Envelope Support Bounce Indicator is designed as a tool for traders who want to unlock the potential of envelope-based strategies in their trading. This indicator is not pre-optimized, allowing you to fully customize and optimize it to suit your trading style and preferences. Whether you're a scalper, day trader, or swing trader, the flexibility of this tool makes it an invaluable addition to your arsenal. What does i

Visual Envelope Price Cross Indicator Unlock the power of price envelope dynamics with the Envelope Price Cross Indicator. This tool is designed to identify potential trade opportunities by analyzing price movements relative to the envelope bands. It is a valuable addition to your trading arsenal, providing insights into trend continuations, reversals, and market momentum. Important: This indicator is not optimized. It is created for you to optimize and fine-tune to match your trading strategy.

Visual Envelope Indicator is designed for traders who want a clear visual representation of market trends, potential reversals, and price dynamics within defined envelope boundaries. This indicator simplifies market analysis, offering a unique perspective for crafting your trading strategy. Please note that this indicator is not optimized—it's intentionally built for you to optimize it according to your trading style and goals. Strategy and logic behind the indicator
The Visual Envelope Indicat

Take control of your trading decisions with the 'Visual Venus Guard Indicator'! This advanced indicator offers a versatile framework designed to assist you in identifying potential market turning points. Created with a focus on customization, it empowers YOU to optimize it according to your unique trading strategy. The Strategy Behind the 'Visual Venus Guard Indicator'
The 'Visual Venus Guard Indicator' uses a comprehensive algorithm to identify critical price zones and reversal patterns, provi

This universal Expert Advisor is based on its own Algorithm, which is an incredibly effective tool due to the simultaneous operation of a trading strategy based on our RoyalFractals Indicator, which you will find on the market for free download. The advisor's algorithm is based on a deep understanding of technical analysis and personal experience in exchange trading, has passed the test of time, therefore it guarantees accurate signals and well-thought-out decisions. Traders are also given th

Unlock Your Trading Potential with the ATR Bands Touch Indicator! The ATR Bands Touch Indicator is a dynamic tool designed to identify key price interactions with the Average True Range (ATR) Bands. Built to assist traders in spotting significant touchpoints where price momentum aligns with volatility boundaries, this indicator provides a strategic edge in identifying potential trend shifts or breakout zones. Key Features and Logic Behind the Indicator: Core Strategy: The ATR Bands are calculat

Unlock the Power of Trend Dynamics with ATR Bands Midline Trend Indicator! The ATR Bands Midline Trend Indicator is a meticulously crafted tool designed to help traders identify trends with precision using the Average True Range (ATR) as a foundation. This indicator focuses on calculating a midline derived from ATR bands, providing a unique perspective for traders to detect trend direction and strength effectively. Important: This indicator is not optimized, leaving the door open for you to tai

The Visual ATR Bands Bounce Indicator is a robust tool designed to empower traders with advanced insights into price action using Average True Range (ATR) bands. Please note, this indicator is not optimized, giving you the freedom and flexibility to tailor it to your trading style and strategy. The Visual ATR Bands Bounce Indicator leverages the power of ATR to dynamically plot bands around price action. These bands serve as a flexible envelope, adapting to market volatility. The key idea is to

Detailed blog post explaining everything with screenshots and has free scanner link: https://www.mql5.com/en/blogs/post/760476/
Scanner only works with the purchased Trendlines indicator. And it needs to be in same directory.
Features
Triangle Types: Detects ascending, descending, and symmetrical triangles. Channel Types: Horizontal, rising, and falling channels. Scanner: Shows symbols for above trendline patterns Threshold: Adjustable sensitivity for slopes Breakouts: Alerts when price breaks
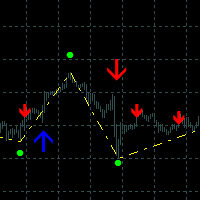
Zig Zag Plus Arrows는 세계 시장의 거래 및 기술 분석을 위한 도구입니다.
또한 거래 결정을 내리기 위한 시장 상황 분석을 제공하는 일련의 지표로 구성됩니다.
추세 방향 내에서 거래를 제공하는 추세 식별자를 포함합니다.
추세 화살표를 기반으로 Zig Zag 알고리즘을 이용하여 방향성 구간과 전환점을 구축하여 미래 추세와 상/하 프랙탈 피크를 직관적으로 보여줍니다.
추세 방향 내에서 지지 및 저항 수준으로 작동하는 추가 항목에 대한 화살표입니다.
표시기 기능
표시기는 다시 그려지지 않으며 지연되지 않습니다.
추세 변화 및 추가 신호가 있을 때 여러 유형의 경고를 제공합니다.
모든 금융상품(외환, 암호화폐, 금속, 주식, 지수)에 사용할 수 있습니다.
이 표시기는 M1 및 M5의 스캘핑을 포함하여 모든 시간 프레임에서 작동할 수 있습니다.
표시기는 프로세서를 로드하지 않는 경량 알고리즘을 사용하므로 여러 창에서 사용할 수 있습니다.
추세 화살표는 캔들 종가에 나타나고,
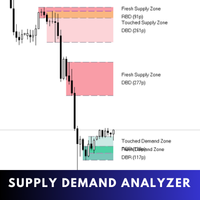
Supply Demand Analyzer is an advanced trading indicator meticulously designed for the precise identification, analysis, and management of supply and demand zones. By integrating real-time data and advanced algorithms, this tool enables traders to recognize market phases, price movements, and structural patterns with unparalleled accuracy. It simplifies complex market dynamics into actionable insights, empowering traders to anticipate market behavior, identify trading opportunities, and make info
The Fibonacci Confluence Toolkit is a technical analysis tool designed to help traders identify potential price reversal zones by combining key market signals and patterns. It highlights areas of interest where significant price action or reactions are anticipated, automatically applies Fibonacci retracement levels to outline potential pullback zones, and detects engulfing candle patterns. Its unique strength lies in its reliance solely on price patterns, eliminating the need for user-define
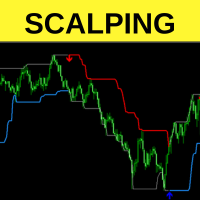
Indicator Name: Scalping Channel System Description: The Scalping Channel System indicator is a powerful tool for analyzing market trends and identifying potential entry points. It is designed for trader convenience and minimizes the need for constant market monitoring. The indicator sends PUSH and EMAIL notifications when a trade signal appears, allowing traders to avoid staying in front of the screen all the time. Advantages of the Indicator: Visually clear arrow signals for easy analysis. Com

FusionBot : FusionBot is an advanced Forex trading algorithm designed for the EUR/USD 15-minute chart, combining the power of Fair Value Gaps (FVG), MACD, and Moving Averages. It identifies key market trends, momentum shifts, and price imbalances to execute high-probability trades. By leveraging these tools, FusionBot adapts dynamically to market conditions, ensuring precise entry and exit points . ...........

The VRSI indicator is another in the suite of volume indicators we have developed and one that complements our volume price analysis methodology perfectly. and was developed out of a desire to build further on our cornerstone of VPA by peeling back the layers of volume and considering the relative aspect of volume. Hence, the acronym of Volume Relative Strength Index indicator encapsulates what the indicator is all about. By analyzing relative volume, we are able to see a visual representation o
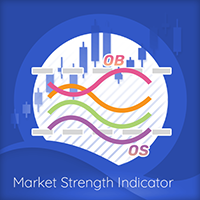
The Market Strength Indicator (MSI) is yet another in our stable of volume-based indicators, and as such, is a must-have tool for trading virtually any type of market and across a myriad of applications from trend trading to swing trading, scalping, and much more. While its sister indicator, the Currency Strength Indicator (CSI), helps you analyze which currencies are oversold, overbought, correlating, and trending, the MSI or Market Strength Indicator does this also, but in this case, for all m

Master MA Cross Version : 1.00
Default settings: EURUSD 60 min Platform : MetaTrader 4 (MT4) 1. Introduction Master MA Cross is an Expert Advisor (EA) for the MetaTrader 4 platform that opens trades based on the crossover of two Moving Averages (MA). It is designed to open only one position at a time, with user-configurable lot sizes, stop loss, take profit, and trailing stop parameters. Key Features MA Cross Strategy : Opens a BUY when a fast MA crosses above a slow MA, and opens a SELL when a

Wind Shift Indicator Are you ready to harness market shifts with precision? The Wind Shift Indicator is your tool for identifying potential reversals and trend continuations. Designed for traders who prefer to fine-tune their tools, this indicator is not optimized, giving you the freedom to tailor it to your unique trading style. Logic Behind the Strategy: The Wind Shift Indicator employs a combination of Commodity Channel Index (CCI) logic and visual signal plotting to detect shifts in market

Unlock the Power of Precision with the Storm Peak Indicator! The Visual Storm Peak Indicator is a sophisticated, signal-driven tool designed for traders who seek clear and actionable market insights. It's built on a robust logic foundation, leveraging the Commodity Channel Index (CCI) to identify market peaks and reversals effectively. While the indicator comes with a pre-set structure, it has been specifically created for you to optimize and adapt to your unique trading style. Why Choose the S

Visual Simple Cross Indicator Unlock the power of moving average crossovers with this sleek, fully visual indicator designed to help you identify buy and sell opportunities directly on your chart. The Visual Simple Cross Indicator is simple yet versatile, catering to traders who prefer a no-frills approach to trend-following strategies. Features & Benefits: Customizable Moving Averages: Configure the fast and slow MA periods, methods, and applied prices to suit your trading style. Clear Buy & S

The Visual SmartSMA Indicator MT4 is a versatile tool designed to assist traders in identifying potential buy and sell signals based on Simple Moving Average (SMA) crossovers. With advanced customization options and additional divergence analysis, this indicator provides a clear visual representation of potential market entries while allowing traders to tailor the strategy to their preferences. Features and Highlights: SMA Crossover Detection : Tracks Fast and Slow SMA interactions to generate

Unleash the power of precision trading with the RangeRider SmartSMA Indicator!
This tool is not optimized, providing you with the ultimate freedom to customize it according to your trading strategy. Perfect for traders seeking control and adaptability, this indicator is designed to help you refine your approach and optimize for success. How it Works:
The RangeRider SmartSMA Indicator combines Simple Moving Average (SMA) calculations with Range and Relative Strength Index (RSI) thresholds to pro

Overview This Expert Advisor (EA) is designed to identify and trade specific candlestick patterns based on user-defined settings. It uses multiple technical indicators to confirm trends, volume, and trade opportunities. The EA includes features such as customizable trading hours, stop loss, take profit, trailing stops, and lot sizing. This EA is a tool intended to assist traders in testing and developing their own strategies. It is not a standalone trading strategy. Designed with user-defined f
Engulfing Pattern Indicator Introducing the Engulfing Pattern Indicator. Are you ready to take your trading strategy to the next level? The Engulfing Pattern Indicator is your ultimate tool to spot powerful market reversals and trends based on the time-tested Engulfing Candlestick Pattern. This indicator is crafted to provide you with actionable insights, but remember: it’s not optimized—you have the freedom to optimize it to suit your trading needs. Why the Engulfing Pattern? The Engulfing Pat
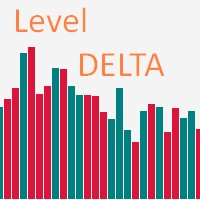
The Level DELTA indicator for MetaTrader 4 (MT4) – a powerful volume analysis tool that stands out with its capabilities and accuracy. Indicator Description The Level DELTA indicator is designed for volume analysis in a separate MT4 window. Its main task is to identify and display divergences, allowing traders to make more informed and timely decisions. Indicator Features Volume Analysis : The indicator analyzes volumes in financial markets, allowing you to see how volumes are distributed over d

The "Pure Directional SMA Indicator" is a powerful tool designed for traders seeking precise trend direction and actionable signals. This indicator is not pre-optimized, offering flexibility to tailor it to your unique trading style and market preferences. The Logic Behind the Indicator:
At its core, this indicator uses Simple Moving Averages (SMAs) to determine trend direction and generate buy/sell signals. Here's how it works: Three SMA Lines: Short SMA : Reacts quickly to price changes, ide
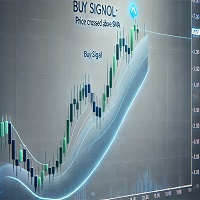
The PriceBreak SmartSMA Indicator is designed for traders who want a powerful price action tool with full customization options. It offers valuable insights into market trends and potential trading opportunities, allowing you to refine your strategy to fit any market condition. How It Works SMA Crossover Logic Uses a 20-period SMA (customizable) to identify market trends. Buy Signals: Triggered when price crosses above the SMA. Sell Signals: Triggered when price crosses below the SMA. You can a

LevelGuard SmartSMA Indicator Master Support & Resistance Analysis with Precision LevelGuard SmartSMA is a powerful tool designed to simplify your trading decisions by identifying dynamic support and resistance levels. This indicator leverages moving averages to provide precise insights into market movements, helping traders master their strategy with confidence. How It Works Core Strategy: Uses a central SMA (e.g., 50 or 200-period) as a dynamic support or resistance line. Additional SMAs (opt

Introducing the Thunder Wave Indicator The Thunder Wave Indicator is a powerful tool designed for traders who love to optimize and tailor their strategies. This indicator is not pre-optimized, giving you full control to adjust it according to your trading style and market conditions. Why Choose Thunder Wave? The Thunder Wave Indicator leverages the Relative Strength Index (RSI) to deliver actionable insights, while incorporating delay and visualization features to ensure precision and clarity.

Introducing the Phoenix Turn Indicator
The Phoenix Turn indicator is designed for traders who seek to harness the power of precise market-turn detection. This tool provides clear visual cues to identify potential buy and sell opportunities based on dynamic price-action and indicator-based logic. Why Choose Phoenix Turn? Unoptimized for Flexibility: This indicator is provided as a raw tool for you to optimize and customize, fitting perfectly with your unique trading strategy. Clear Visual Signal

Dragon State Indicator is a powerful trading tool designed to empower traders by giving them the foundation to optimize it further. This indicator is not optimized, making it a perfect choice for traders who love to tweak and customize trading tools to suit their unique strategies. The Logic Behind the Indicator The Dragon State Indicator identifies pivotal market movements using these components: Buy and Sell Signals: Buy Signal: Clearly displayed with lime-green arrows when conditions suggest

Trend Entry Levels Indicator
The Entry Levels Indicator is a trend-following tool designed to assist traders by highlighting key levels for trade entries and profit-taking. It is built to support trading strategies by providing information on market trends and levels for Take Profit (TP) and Stop Loss (SL). This indicator can be used by traders of varying experience levels to enhance their market analysis.
Features Non-Repainting Signals: Provides signals that remain consistent over time. Mul
By :ForextraderEanow SnowBall 2028 Ea. 1.0
This EA is Famous Grid Strategy that open positive grid of trades with the larger size first and smaller size after. It makes PROFIT when the Forex price moves i

Trend Guardian Pro – 추세 조기 예측 인디케이터 Trend Guardian Pro 는 전문 수학자, 분석가 및 트레이더 팀의 협업으로 탄생한 결과물입니다. 수년간의 시장 데이터 분석을 토대로 제작되었으며, 고급 수학적 모델링 기법을 활용하여 추세의 잠재적 변화를 조기에 식별합니다. 주요 특징: 조기 예측 – 시장의 변화가 명확해지기 전, 다양한 시장 요인을 분석하여 추세 전환 신호를 포착합니다. 종합 분석 – 여러 시간대(Multi-Timeframe)를 동시에 분석하여 신호의 신뢰도를 높입니다. 적응형 알고리즘 – 현재 시장의 변동성에 맞춰 알고리즘이 자동으로 조정됩니다. 노이즈 필터링 – 고급 필터링 기술을 통해 시장 노이즈를 제거하고 가짜 신호(데드 캣 바운스 등)를 최소화합니다. 직관적인 인터페이스 – 필요한 모든 정보를 차트 위에 시각적으로 명확하게 표시합니다. 핵심 기능: 추세 강도 식별 (약함 / 중간 / 강함); 거래량 분석 을 통한 신호 확증; 내장 알
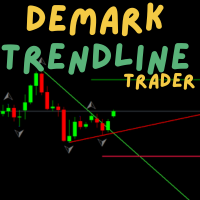
If you are unsure how to use this indicator, please feel free to reach out to me. I will explain it to you and provide reading materials to help you make the most of it. Most effective with TD sequential : MT4: https://www.mql5.com/en/market/product/129509?source=Site +Profile+Seller MT5: https://www.mql5.com/en/market/product/129507?source=Site +Profile+Seller My Other products: https://www.mql5.com/en/users/1700046313/seller
Here’s a brief description of how to use the
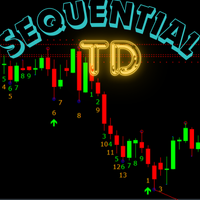
If you are unsure how to use this indicator, please feel free to reach out to me. I will explain it to you and provide reading materials to help you make the most of it. Here’s a brief description of how to use the indicator effectively. How to Use TD Sequential by Tom DeMark The TD Sequential is a technical analysis indicator developed by Tom DeMark, designed to identify potential turning points in market trends. It is widely used by traders to anticipate market reversals and manage trading ris
MetaTrader 마켓은 과거 데이터를 이용한 테스트 및 최적화를 위해 무료 데모 거래 로봇을 다운로드할 수 있는 유일한 스토어입니다.
어플리케이션의 개요와 다른 고객의 리뷰를 읽어보시고 터미널에 바로 다운로드하신 다음 구매 전 트레이딩 로봇을 테스트해보시기 바랍니다. 오직 MetaTrader 마켓에서만 무료로 애플리케이션을 테스트할 수 있습니다.
