 MetaTrader 5
 Experts
 지표
지표
 라이브러리
라이브러리
 유틸리티
유틸리티
 위젯
위젯
 규칙
규칙
MetaTrader 4용 Expert Advisor 및 지표 - 347
 트레이딩 로봇은 자동으로 시장거래를 수행하는 반면 지표는 가격을 더 잘 분석하고 가격 행동을 예측할 수 있게 해줍니다.
이러한 어플리케이션을 사용하면 MetaTrader 4에서 더 많은 기회를 포착하는 동시에 보다 정보에 입각한 방식으로 거래를 수행할 수 있습니다.
트레이딩 로봇은 자동으로 시장거래를 수행하는 반면 지표는 가격을 더 잘 분석하고 가격 행동을 예측할 수 있게 해줍니다.
이러한 어플리케이션을 사용하면 MetaTrader 4에서 더 많은 기회를 포착하는 동시에 보다 정보에 입각한 방식으로 거래를 수행할 수 있습니다. 
Keltner's colored channel indicator, also called STARC band, drawn in an additional chart window for any of the five basic indicators included into the MetaTrader 4 platform. The indicator uses the calculation technique of the three drawing options: basic, improved and modified . The first two were proposed by Keltner, the third one - by a successful trader L. Rakshe. You can search for your own optimal parameters of the indicator. It is also possible to color the upper, middle and lower bands,
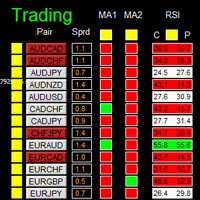
如果产品有任何问题或者您需要在此产品上添加功能,请联系我 Contact/message me if you encounter any issue using the product or need extra feature to add on the base version.
There is Demo version of this panel Dashboard Super MA RSI CCI Demo in my product list, pls try it out to get familiar with all functionalities free . Dashboard Super MA RSI CCI is an intuitive, and handy graphic tool to help you to: Have 28 pairs under control with one dashboard Monitor price movement, identify possible trend based on MA, RSI, and CCI i

Tick Advisor is an intraday trading system that tries to profit during the price rollback. Martingale can be enabled, but you should be extremely careful (take profit often and at a proper time!). You can examine the Expert Advisor's trading statistics for different brokers and symbols in the MetaTrader 4 Trading Signals sections.
Parameters Risk management: enter volume - a volume for entry If the value is greater than 0 - number of lots, if less than 0 - percentage of available funds, if equa

Unlimited Binary Options Copier Remote is a powerful tool to copy binary options trades remotely between multiple accounts at different locations over internet. This is an ideal solution for signal provider, who want to share his binary options trades with the others globally on his own rules. One provider can copy trades to unlimited receivers and one receiver can get trade from unlimited providers as well. The provider can set the subscription expiry for each receiver, so that receiver will no

Standard ZigZag with added alert, push notifications and email messages on breakout of the last formed HIGH - LOW! It does not consider the current extremum of the ZigZag, that is being redrawn!
Indicator Settings Depth - determines the size of the interval or the number of candles after the previous extremum of the indicator, on which it will not look for a new extremum Deviation - the number of points between the extremums (Lows or Highs) of two adjacent candlesticks to form a local bottom of

Prometheus Smart Money is an indicator that combines both price & volume with calculations based on other custom indicators, smart volume and retail volume to create this leading indicator that gives you high probability moves to help you make a decision on what is MOST likely to happen in the market going forward Advantages You can use it in ALL financial markets including binary options on ALL asset classes or instruments. You can use it as a stand alone indicator or as a confirmation tool wit
EMA Cross Alert is a signal indicator based on exponential moving average crossover. It will alert signal with audio or pop up on chart when 2 periods EMA cross above/below for Buy/Sell. It easy use. Help to your system trading. You can customize period of EMA for crossing alert signal, if you want. And You can ON/OFF audio alert. Indicator can use every currency pairs and every broker.
Features Period1: Short moving averages Period2: Long moving averages Audible_Alerts : ON/OFF audio alert on

The Expert Advisor uses a strategy based on breakthrough and two additional strategies based on sharp price changes. You can adjust the slope of the breakthrough, the distance between the breakthrough levels and the number of breakthrough levels. The Expert Advisor itself marks the levels that should be broken through. The EA includes two strategies based on sharp price changes: that is the EA opens pending Sell Stop and Buy Stop orders in case of a sudden price change in any direction and close
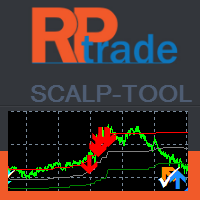
두피 도구는 매우 효율적인 카운터 트렌드 지표입니다.
누구나 사용할 수 있도록 설계되었으며 거래에 대한 완전한 초보자도 사용할 수 있습니다. Scalp Tool은 다시 칠하지 않습니다. 표시는 가까운 수준에서 가까운 수준 또는 가까운 수준에서 보이는 수준으로 제공됩니다. 두피 도구는 단독으로 사용할 수 있으며 다른 지표가 필요하지 않습니다.
두피 도구는 거래를 여는 곳. 닫을 때. 정지 명령을 내리는 곳. 라이브 테스트 중에 80% 이상의 정확도로.
두피 도구 작동 FX 쌍, 지수, 금속, 선물 등과 같은 모든 상품으로... 언제든지. 모든 중개인과 함께.
두피 도구 기능 TradeType Wise: 위험과 노출을 제한하기 위해 짧은 거래를 합니다. 화살표는 멈출 때를 알려줍니다. TradeType Medium: 균형 잡힌 프로필, 중간 길이 거래로 더 많은 핍을 생성합니다. 정지는 회색 밴드와 화살표로 표시됩니다. TradeType Maximum: 꽤 긴 거래로 더

The indicator displays Renko bars on the chart, plots two moving averages by them and generates buy/sell signals based on the conditions displayed in the screenshots and described below: the buy signal is formed if the fast moving average is above the slow moving average, from 4 to 10 consecutive bullish Renko bars are displayed, followed by no more than 2 bearish and one bullish Renko bars; the sell signal is formed if the fast moving average is below the slow moving average, from 4 to 10 conse
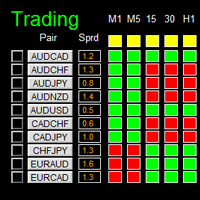
如果产品有任何问题或者您需要在此产品上添加功能,请联系我 Contact/message me if you encounter any issue using the product or need extra feature to add on the base version.
Dashboard Super Candle is an intuitive, and handy graphic tool to help you to: Have 28 pairs under control with one dashboard. Monitor candle direction, identify possible price movement and trend. Provide trading signals based on the candle direction selected by you. Automatically manage order once signal are generated. Have the ability to select which p

Expert Advisor designed for news trading. The news are downloaded from the Forex Factory, Investing.com, myfxbook.com websites. Make sure to add the URL to the terminal settings. The EA should be attached to each currency chart. In the Symbol News field, set the currency symbol for searching news in the calendar. Example: if the EA is attached to the AUDUSD chart, set Symbol News to AUD; if USDCAD, Symbol News - CAD, XAUUSD Symbol News - USD, and so on. Change the magic number for each chart, an

The library is dedicated to help manage your trades, calculate lot, trailing, partial close and other functions
Orders CloseallSell CloseallBuy CloseallOpen DeletePending DeleteAll: Close All Market Orders and delete all pending orders. CheckOpenBuyOrders: return the count of buy orders. CheckOpenSellOrders: return the count of sell orders. CheckOpenOrders: return the count of market orders. ModifyOrder DeleteOrder CloseOrder OpenOrder
Lot Calculation Mode 0: Fixed Lot. Mode 1: Martingale Lot

This indicator is based on Market Profile methodology, which contains the Z-Zone , unlike the latter, allows visualization of multiple time frames on the same graph. This methodology has proven to be very effective for: Reduce the number of windows required to analyze or track a financial asset. Display important resistance areas (ROZ), support (SoZ) and average distribution (PoC) in different periods of time. Define areas to take profits as well locate technical stop loss. Analysis in the devel

The Navigator is a next-generation panel very easy to use. Apply this indicator on the chart to navigate very quickly through all the symbol and timeframes listed in input. The arrows manage the zoom and time frames. You can customize both the graphic colors and the list of symbols to display. A quick and easy tool that it will help to analyse the charts.
Input Values Show_TF_Panel (true/false) it permits to show/hide panel with TF and Arrows
32 symbols COLORS AND SIZE SETTINGS BUTTON_WIDTH But

The Illusion EA uses the probability theory - after a series of consecutive virtual losses - i.e. right during a flat the EA already starts trading in the trend. In addition, the EA considers the ratio of bullish/bearish candles on the higher timeframes to determine the greatest probability of the price movement direction. Only 1 order can be opened at a time. In case of a loss the following order will be placed with an increased lot (the multiplication coefficient is set in the parameters). The
Pipfinite creates unique, high quality and affordable trading tools. Our tools may or may not work for you, so we strongly suggest to try the Demo Version for MT4 first. Please test the indicator prior to purchasing to determine if it works for you. We want your good reviews, so hurry up and test it for free...we hope you will find it useful.
Combo Channel Flow with Strength Meter Strategy: Increase probability by confirming signals with strength Watch Video: (Click Here)
Features Detects chan
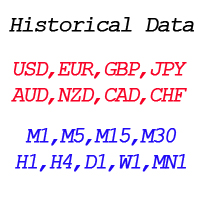
By applying this expert onto any char window, you are able to force download the historical data upon all time-frame (PERIOD_M1, PERIOD_M5, PERIOD_M15, PERIOD_M30, PERIOD_H1, PERIOD_H4, PERIOD_D1, PERIOD_W1, PERIOD_MN1) of 28 major pairs. The 28 major pairs are the combination of the 8 major currencies.
8 major currencies "USD", "EUR", "GBP", "JPY", "AUD", "NZD", "CAD", "CHF"
28 pairs "AUDCAD","AUDCHF","AUDJPY","AUDNZD","AUDUSD","CADCHF","CADJPY" "CHFJPY","EURAUD","EURCAD","EURCHF","EURGBP","E
FREE

The EA detects strong movements using the Parabolic indicator and opens a trade. The Commodity Channel Index (CCI) is used as an auxiliary indicator. The CCI levels may depend on the ADX indicator values, which allows for better trading with different volatility. Also, the trades are opened depending on the RSI indicator values on a certain timeframe. Recommended timeframes: M5, M15, M30. Make sure to optimize the parameters of the EA for your account before trading.
Input Parameters Lots - lot

A simplistic indicator informing a user on RSI divergence by sending messages to mobile device and email. The indicator draws 2 vertical lines, marking two RSI extrema that formed the divergence. You get the alert, open the charts and make a decision. The indicator does not show past divergences, thus when you attach it to a chart for the first time you see nothing. Graphics and alerts will appear as soon as divergences do. Drop it in Tester to see how it works. Parameters: RSIPeriod - number of

Taranus is a multifunctional EA, a universal assistant to a trader, designed to work under the control of a trader. The EA has a large set of tools and can work: by indicators, by trading levels, by trend lines, by martingale strategy, trade on news. It has: several filters to determine the trend, a multi-level risk management system, money management, virtual stop loss, universal trailing stop, can work with any type of orders. Set files and a guide to the Taranus EA can be found in the "Commen
Automatic lot calculation per stop level: calculates the lot considering the risk. It is possible to enter a percentage of the deposit and set the line to the planned stop level. As a result, the lot for entry will be calculated. Also, the TakeProfit level will be calculated taking into account the profit/loss ratio, and their profit/loss in the deposit currency. Thus, the final result of the trade can be seen, which is an integral part of successful trading.
Features The indicator displays the
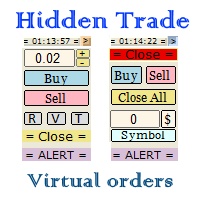
Small trading panel for managing orders and positions in 1 click for MetaTrader 4 Version for MetaTrader 5 here Set hidden TakeProfit, StopLoss and pending orders at lines placed on the chart Work on time on the news Backtesting manual strategies in the tester Placing virtual orders Playing a sound signal when the price reaches a level Automatic closing of all positions on the account or symbol by the total take profit in the deposit currency
Description Can be dragged to any part of the chart
통화 쌍의 상관 관계 및 발산 지표 - 동일한 가격 차트의 모든 쌍. 터미널에 열려 있는 모든 쌍을 표시합니다.
MT5 버전
장점 다중 통화 거래 전략을 사용하는 거래자는 이동 매개변수를 비교하기 위해 동일한 가격 차트에서 선택한 쌍의 가격 이동을 시각적으로 관찰할 수 있습니다. 이것은 오버레이 차트 표시기의 고급 및 확장 버전입니다.
"쌍 거래" 및 "포트폴리오 거래"와 같은 다중 통화 거래에 있어 상당히 효과적인 조수로서 다가오는 움직임을 미리 결정하는 데 도움이 됩니다.
이 기술은 두 가지 전략으로 요약되며, 첫 번째는 중요한 뉴스 발표 후 또는 거래 플로어가 열릴 때 통화 쌍 간의 불일치를 찾기 위해 고안되었습니다. 이러한 작업의 논리는 매우 간단하며 시장의 "폭풍"이 진정된 후 상품 가격 간의 델타가 다시 수렴하기 시작할 것이라는 가정을 기반으로 하는 반면 강력한 지원에 주의를 기울이는 것이 좋습니다. 강한 저항 아래에서 직접 구매하고 맨 아래에서 판매하는 것을

The CCI FIBO trend indicator displays the real sentiment of the market. Does not redraw. The CCI FIBO indicator is based on the processed values of the standard CCI indicator. The indicator is able to display the slowing\reversal of the price during the trend movement (for exiting the position, and with some experience to display the opening in the opposite direction, for example, to use in scalping). It shows spikes in a flat. The idea of the indicator was that there are indicators that are goo
Advantage The analyzer provides an opportunity to examine correlation in history, for example, for the previous month excluding the current one, thus allowing you to evaluate symbol movement in history. It can be conveniently used in conjunction with LineSyncMirrorChart analyzer. Charts are synchronized by a market type: Forex, CFD, Futures, and Indices. The analyzer calculates the distance covered by the price on a specified period in points. The tool fits pairs and portfolio traders.
Descript
The indicator marks the estimated market reversals in the form of arrows. The indicator is able to detect 3 types of reversals. The primary reversal signal. It is a stronger and more important reversal. Denoted by the largest arrow. Alternative signal - additional signal without additional filters in contrast to the primary. Suitable for scalping on small timeframes. A mixture of the primary and alternate reversals, but with the addition of the trend filter. Also shows good results on small time

CIS is designed for trading a basket of correlating currencies, as well as single instruments: indicators
VSA indicator which draws arrows (does not redraw). Its signals indicate the price reversal on a calm market or decrease of the rise or fall rate during strong movements. Works fine in the flats. As the indicator uses volumes in its calculations, be careful during evenings and night times, when there are very small volumes. It is recommended to be used only on multiple currencies or at lea
As the proper trading using CCI indicators requires the trader to monitor multiple timeframes and CCI indicators with different periods. For example - monitor the trend using CCI with the period of 100 or 200 ( slow CCI period ) on the H4 timeframe, and make entries based on the CCI with the period of 13 ( fast CCI period ) on the H1 timeframe. To facilitate this task, the Delta CCi MTF7 indicator was created, which implements monitoring the changes of the price movement trends as well as marks

The Z-Zone is part of a suite of four indicators called the Z-Tools Black you can buy separately in the MetaTrader Market. The Z-Zone is based on the Market Profile and includes three dynamic lines: At the top is the resistance of zone (that we´ll identify as RoZ ) In the center we find the average distribution of the area (that we´ll identify as PoC ) At the bottom is the support of zone (that we´ll identify as SoZ ) Together they make up what we call the value zone, meaning that the market mo
The Five Minutes indicator is a ready TRADING SYSTEM for binary options. The system is designed specifically for the EURUSD M5 currency market with at least 80% payout and for trades who operate on the web-terminals and the MetaTrader 4 platform. This is a counter-trend system, i.e. it expects the price of traded asset to reverse. Signals of the system are not redrawn, they appear once the formation of the previous bar is completed, and are equipped with a sound notification. For decision-making

The Z-Compass is part of a suite of four indicators called the Z-Tools Black you can buy separately in the MetaTrader Market. The Z-Compass is one of the most important indicators, because it serves as a compass in the market and is composed of the following elements A histogram and zero line. The histogram is plotted with each candle and changes depending on the selected time frame. When the histogram is above the zero line, we say the trend or momentum is bullish and when it is below the zero

The Z-Beat Zone is part of a suite of four indicators called the Z-Tools Black you can buy separately in the MetaTrader Market. The Z-Beat Zone is displayed as two lines. The main line is called SlowK. The second line, called SlowD. The SlowK line is a solid gross line and the SlowD line is a solid slim line. There are several ways to interpret a Z-Beat Zone. Three popular methods include: Buy when the Z-Beta Zone (The SlowK line) falls below of the level (e.g., -40) and then rises above that le
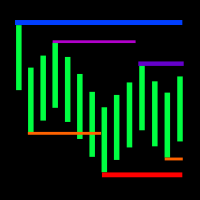
The indicator displays the fractal levels of one,two or three different higher timeframes starting with the current one. When a new fractal appears, a new level is plotted. The indicator can be used for visual analysis of the current chart and applied in an EA. If more levels are needed, start a new instance of the indicator.
Features Timeframes to choose from. For example: M1, M2, M3, M20, H2, H3, H12. If a timeframe smaller than the current one is selected in the settings, the level of the cu

It is good to know the presence of a trend on multiple timeframes at once. And even better - on multiple currency pairs at once. This indicator allows to quickly determine the presence of a trend or a flat on 8 timeframes and from 1 to 15 currency pairs at once. Multi Alligator Signals analyzes the signals of the Alligator indicator by Bill Williams on every timeframe (from M1 to W1) and multiple currency pairs (up to 15) simultaneously. If there is a buy signal, a green upward arrow is drawn, i

Two Dragon is an advanced indicator for identifying trends, which uses complex mathematical algorithms. It works in any timeframe and symbol. Indicator is designed with the possibility to customize all the parameters according to your requirements. Any feature can be enabled or disabled. When a Buy / Sell trend changes the indicator will notify using notification: Alert, Sound signal, Email, Push. МetaТrader 5 version: https://www.mql5.com/en/market/product/14906 Parameters Max_Bars_History —
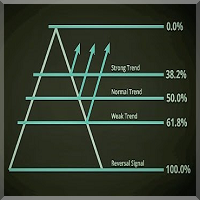
소개 피보나치 레벨 프로페셔널 지표는 거래 설정과 시장이 움직이는 경향을 더 잘 확인하기 위해 다른 지표를 보완하는 일일 거래를 위한 훌륭한 도구입니다. 이 표시기는 설정하기 쉽고 모든 통화 쌍 및 시간 프레임에서 작동합니다. M15-W1이 권장됩니다.
이 지표의 목적은 피보나치 수준을 차트, 일일, 상단 및 하단 라인에 표시하는 것입니다. 추가 기능으로 이 표시기는 차트에 되돌림 및 확장 선을 그리고 일 고점, 저점, 범위 및 스프레드에 대해 알려줍니다. Fibonacci Levels Pro 표시기는 전날의 고가와 저가를 사용하여 계산된 선을 그립니다. 이것은 모든 거래자에게 꼭 필요한 도구입니다! 특징 간편한 설정, 복잡한 설정 없음 깨끗하고 부드러운 차트 라인과 읽기 쉬운 모든 통화 쌍 및 시간 프레임에서 작동 피보나치 선에 대한 조정 가능한 색상 설정 조정 가능한 대시보드 색상 계정 정보가 있는 대시보드 지표 매개변수 UpperFiboColor - 상위 피보나치 레벨의
Advanced and affordable momentum indicator that fade the fake move of market. It is smoothed because of special sophisticated exponential averaging calculation. It is also similar to special type of CCI with more tolerance to overbought or oversold conditions with built-in momentum indication. This indicator is able to empower your trading as a trend detector, CCI and market momentum scale measurement.
Features Smoothed to filter uncomfortable noises. Non-Lagging Exponential averaging. Line or
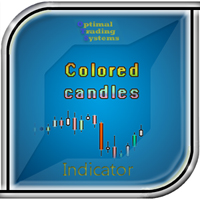
Some candles have a strong tendency to continue the movement or to revert it. With the help of the Colored candles indicator such movements are clearly visible. This indicator calculates the parameters of each candle, as well as its volume, and after that it paints the candles depending on its strength and direction. Bullish candles are colored green and bearish candles - red. The greater the power of the bulls or the bears, the brighter the color. You can change the colors if you want. The indi

Some experienced trades can tell where the price will go even without indicators, as the direction of the price can be found using the ordinary candlesticks. The EA compares several nearest bars and their volumes, and opens a trade based on that data. Also, it is able to analyze the candles on two timeframes at the same time to make the entry more accurate and less risky. In addition, the EA can automatically determine the take profit and stop loss size depending on the size of the previous cand
This innovative technical indicator was created to detect quiet market period before the beginning of the high volatile market. Like many good technical indicators, this Market Activity Index is very stable and it is widely applicable to many financial and non financial instruments without too much restriction. The Market Activity Index can be used best to visualize the alternating form of low and high volatile market. It is very useful tool to pick up the quiet market but ironically this is the

Smart Advisor Calculation is designed for a very interesting method that is able finally to give the martingale a new positive way! At startup the Expert Advisor sets virtual orders and trades like the real deal. As soon as the drawdown of virtual orders reaches the set number, the robot immediately enters the market for real orders! Thus the price is going without setbacks such as 30-70 pips, with great probability will kick back at the entrance to the market! This is used by a robot! If the pr
It is based on Surfing strategy. DOES NOT USE MARTINGALE. The EA catches the moments when the previous candle crosses the moving average indicator and eliminates the false breakouts using the RSI+MA indicator, and at the same time analyzes the trend direction. The EA trades pending orders, which also allows to avoid false movements. If the pending order was not triggered and the chart reversed, then the EA deletes the pending order. Also, according to the strategy, the EA uses the Trailing Stop,

Delta Pairs is an indicator for pair trading, it displays the divergence of two currency pairs. Does not redraw. A useful tool for the analysis of the behavior of two currency pairs relative to each other.
Purpose The Delta Pairs indicator is designed for determining the divergences in the movements of two currency pairs. This indicator is displayed as two line charts and the difference (delta) between these charts in the form of a histogram. The Delta Pairs indicator will be useful for those w
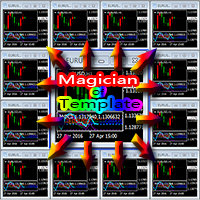
Everyone has their own style, for example, color of candle, color of chart blackground, used indicators, EAs, and script tools etc. If you often use a template to load your favorite style, you should already know that manual loading is cumbersome when using multiple charts. Now, you can use this tool to work better and faster. Magician Of Template (MOT) is a utility script tool for MetaTrader 4. After attaching the script to a chart, one template will auto load to all charts. The template should
With Symbol Switch you can easily change the symbol of all open charts without losing your analysis or template. Easily monitor many symbols with only one monitor. Auto save\load analysis separately for each symbol (including all graphical analysis and attached indicators). The indicator shows the symbols which are visible in your MT4 "Market Watch" window. To add\remove a symbol just add\remove it from MT4 "Market Watch" window. Monitoring all symbols profit with the panel. Works with all broke
The EA creates an order grid using labels. Opening and closing of the grid is done either automatically by the system signals or manually. In the same grid can be both Limit and Stop orders. It is possible to reverse the grid on specified condition. You can enter the breakdown/rebound from established levels. All types of Sell limit, Buy limit, Buy stop, Sell stop orders are supported. The grid is rebuilt with a single click. The stop loss and take profit lines can be easily modified You are fre

XMaya Scalp ZR Series is a fully automated Expert Advisor designed for Traders. XMaya Scalp ZR Series is a robot trader with multi-currency scalper Expert Advisor. This robot trades on any Time Frame, Can be use on all pairs but not for use on XAU/GOLD . The system is ready-to-use with the setup is simple, with simple optimization on Take Profit, Stop Loss, and Trailing.
User-Defined Variables OrderCmt - used for comments Magic - Magic Number to identify the order's mode for the EA. TargetProfi
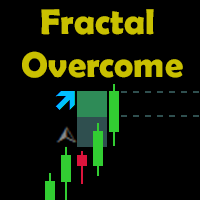
Indicator Description The indicator shows the breakout of the last fractal in real time. It considers the buy fractals above the balance line and sell fractals below the balance line (according to the Bill Williams' strategy), and also the fractals that are independent of the balance line. The direction and the distance of the fractal level breakout are displayed in real time. When a candle closes outside the suitable fractal, the levels of the specified offset, the distance to the candle closur

Master Trend Dashboard is a new generation indicator, compact, light and efficient. Each element of this Dashboard is designed to return specific signals as: Price Action, Breakout, Net Change (performance of the instrument), algorithmic studies, correlations and statistical calculations. This tool will change your way of trading allowing you to receive important information. See the Graphic Signals to understand every single signal below:
Graphic Signals Symbol name and arrow color Green = Cur
Volume Levels is a very important indicator for exchange trading. Most of the trades were performed on those levels. This indicator displays the price level that had the most trade volumes over a certain period of time. Often, the price bounces from those levels in the future, and it can be successfully used in trading. It works on any currency pair.
Parameters HistoryBars - the number of bars to determine the near volume levels; Range - the maximum distance above and below the current price to
The BOSS (Binary Option Super System) indicator is a ready TRADING SYSTEM for binary options. The system is designed specifically for the currency market and for the traders who operate on the web-terminals and the MetaTrader 4 platform. This is a counter-trend system, i.e. it is based on the assumption that the price of a traded asset revert sooner or later, and the final trade will cover the previously incurred losses and make a profit. Signals of the system are not redrawn, they appear once t
TMA Simplemartin Expert Advisor is based on TMA channel indicator, as well as Stochastic and CCI standard indicators. A market entry is performed according to indicators' aggregate signals using stop levels and trailing. A deposit is a part of the trading system. This is a martingale. Both arithmetic and geometric progressions are available. Besides, the EA features the function of recovery from a loss (TMA compiled into resources).
System settings averaging included – enable averaging. averagi
STOCH+RSI+CCI Expert Advisor is based on standard Stochastic, RSI, and CCI indicators. A market entry is performed according to indicators' aggregate signals using stop levels and trailing. A deposit is a part of the trading system. This is a martingale. Both arithmetic and geometric progressions are available. Besides, the EA features the function of recovery from a loss.
System settings averaging included – enable averaging.
averaging only on signal – average only by a signal.
averaging Type

Ultimatum Breakout - this trading system uses the strategy of valid breakouts, using multiple custom indicators for eliminating bad signals. The EA uses a very small SL so the account is always protected from equity drawdown with a very low risk-per-trade. The EA is fully adapted: calculates the spread — for pending orders, stop loss, trailing stop, breakeven. It was backtested and optimized using real ticks with 99,9% quality. It has successfully completed stress testing. No Martingale. No arbi

DS Arrow is a simple indicator for buying/selling in MetaTrader 4, This straightforward indicator shows the market entry points. Perfect for both beginners and professionals. Designed for working only with the H1 timeframe, the indicator will not be displayed on other timeframes. Recommended currency pairs: GBP-USD, EUR-USD, USD-CAD, AUD-USD, USD-JPY, NZD-USD. Works with both4-digit and 5-digit quotes. This indicator does not redraw its signals.
Features The entry is made when the hourly candle

This is a grid EA that trades on all timeframes, pairs and instruments. You are to desire where and how to use it. The EA uses a four level system for signal confirmation, which allows you to filter out false market entry signals. 3 indicators are used for trading. Having received a signal to enter the market, the EA opens a Market Execution order, which is closed by TP. The EA uses martingale, to reduce the risk it is possible to automatically decrease or increase of the martingale multiplier.
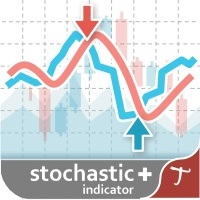
Tipu Stochastic is the modified version of the original Stochastic Oscillator published by MetaQuotes here .
Features Choose three types of signals (Reversals, Main Signal Cross, and Overbought/Oversold Cross). Customizable Buy/Sell alerts, push alerts, email alerts, and visual on-screen alerts. Marked overbought and oversold levels. Add Tipu Panel (found here ) and unlock the following additional features: An easy to use Panel that shows the trend + signal of the selected time frames. Show Sto
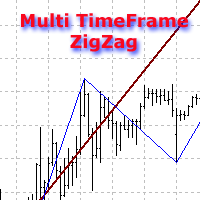
The indicator displays ZigZag lines from a higher timeframe (see the example in the screenshot). The red thin line is the current timeframe's ZigZag, while a thicker yellow line is the higher timeframe's one. The indicator is repainted as the data is updated.
Parameters
Depth, Dev, Back - ZigZag parameters; BarsCount - amount of processed bars (reduces the initial download time and decreases the load when using in an EA); TimeFrame - indicator timeframe (cannot be lower than the current one).

The indicator detects and displays 3 Drives harmonic pattern (see the screenshot). The pattern is plotted by the extreme values of the ZigZag indicator (included in the resources, no need to install). After detecting the pattern, the indicator notifies of that by a pop-up window, a mobile notification and an email. The indicator highlights the process of the pattern formation and not just the complete pattern. In the former case, it is displayed in the contour triangles. After the pattern is com
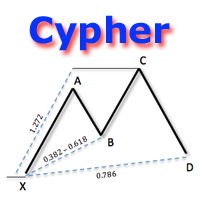
The indicator detects and displays Cypher harmonic pattern also known as Anti-Butterfly (see the screenshot). The pattern is plotted by the extreme values of the ZigZag indicator (included in the resources, no need to install). After detecting the pattern, the indicator notifies of that by a pop-up window, a mobile notification and an email. The indicator highlights the process of the pattern formation and not just the complete pattern. In the former case, it is displayed in the contour triangle

The indicator detects and displays Shark harmonic pattern (see the screenshot). The pattern is plotted by the extreme values of the ZigZag indicator (included in the resources, no need to install). After detecting the pattern, the indicator notifies of that by a pop-up window, a mobile notification and an email. The indicator highlights the process of the pattern formation and not just the complete pattern. In the former case, it is displayed in the contour triangles. After the pattern is comple

RSI Breakout Dashboard is a tool for multiple currency pairs analysis at the same time in terms of breakout (return) from Oversold or Overbought Zone to Neutral Zone.
All displayed and used by indicator symbols are free to choose and are specified using a space separated list in parameters, so you're able to analyze not only predetermined ones, but everything that your broker offers, also commodities, equities, indices, ones with prefixes, suffixes etc.
You can choose 3 types of aler

Found a great signal, but a provider's lot is too small? You need larger position volume, but terminal settings are too poor? SignalLotEnlarger will increase the provider's position volume by means of a duplicate order of the needed volume. Just set a lot size and a name of a signal for copying orders from. This is the version with extended functionality, the lite version can be found here: https://www.mql5.com/en/market/product/8117
With the Pro version you can:
disable copying new orders fro

The EA uses the strategy based on breakout. Breakout trading is one of the most popular and most frequently used strategies among Forex traders. This strategy has been developed a long ago and has been repeatedly tested on history data, showing superior results. The EA uses 3 types of trend breakouts, (support and resistance breakout, downtrend breakout, uptrend breakout). The EA uses a very small SL so the account is always protected from equity drawdown with a very low risk-per-trade. It uses
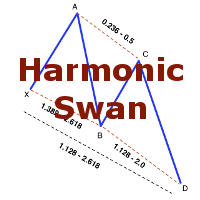
The indicator detects and displays the White Swan and Black Swan harmonic pattern on the chart according to the scheme provided in the screenshot. The pattern is plotted by the extreme values of the ZigZag indicator (included in the resources, does not require additional installation). After detecting the pattern, the indicator notifies of that by the pop-up window, a mobile notification and an email. The indicator highlights not only the complete figure, but also the time of its formation. Duri

Was: $99 Now: $49
Blahtech Daily Range indicator displays the average daily range alongside the individual session ranges. Using the daily open price as a reference the indicator shows fixed range and dynamic range targets as lines on the charts. These lines clearly show when the average range has been exhausted. Daily and session ranges can be useful for confirming entries or setting targets and is an excellent odds enhancer for many trading systems. Links [ Documentation | Install

The indicator detects and displays the AB=CD harmonic pattern on the chart according to the scheme provided in the screenshot. The pattern is plotted by the extreme values of the ZigZag indicator (included in the resources, does not require additional installation). After detecting the pattern, the indicator notifies of that by the pop-up window, a mobile notification and an email. The indicator highlights not only the complete figure, but also the time of its formation. During the formation the
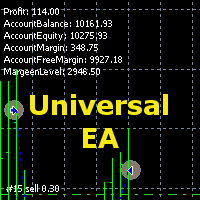
The Expert Advisor allows you to build a trading system based on a custom indicator. It performs automated opening/closing of deals based on the signals of an indicator that places values other than 0 and EMPTY_VALUE in the buffer. The EA polls the values of the specified indicator buffers, opens/closes and accompanies trades according to the specified parameters. The Expert Advisor implements the following trade support functions: - installation for the transaction SL and TP;
- calculation
Grid robot that maintains every open position opened by the trader. The buttons on the screen are used for opening the initial trade. The yellow labels display the price of total breakeven for each grid. The light blue labels display the level of total take profit for orders of each grid. The take profit is virtual. With each subsequent opened order the take profit of the grid is adjusted to get the total profit in the sum of the profit of the initial order, regardless of the size of all lots in
MetaTrader 마켓은 거래로봇과 기술지표를 판매하기에 최적의 장소입니다.
오직 어플리케이션만 개발하면 됩니다. 수백만 명의 MetaTrader 사용자에게 제품을 제공하기 위해 마켓에 제품을 게시하는 방법에 대해 설명해 드리겠습니다.
