MetaTrader 4용 유료 기술 지표 - 2

Contact me after payment to send you the User-Manual PDF File.
Double Top/Bottom Pattern
Double top and bottom patterns are chart patterns that occur when the underlying investment moves in a similar pattern to the letter "W" (double bottom) or "M" (double top). Double top and bottom analysis are used in technical analysis to explain movements in a security or other investment, and can be used as part of a trading strategy to exploit recurring patterns. Searching for this pattern among the c

This dynamic indicator will identify when Fast Moving Averages (EMA, SMA, or LW) cross Slow Moving Average lines on any timeframe and with any symbol.
When the moving averages cross and price close above or below the crossing, the User will receive an alert via pop-up, push, or email.
Choose any two Moving Averages to cross to receive an alert and the Indicator will also paint the Moving Average Lines and Arrows.
You can choose Exponential Moving Averages (EMA). Simple Moving Averages (SMA

Must be owned and used by Fibonacci traders who like to open position by pending order (limit order). The strategy is that you just have to wait for the automatic custom fibonacci appear then manual place your pending order, stop loss and take profit at the level of Fibonacci. The position will be opened when the price make a successful retest. Fibo Heart Indi come with pop-up alert, email and mobile push notification. Suitable for all instruments and all time frames. Don't miss the trading set

Scanner and Dashboard for Cycle Sniper ATR Fibo Channels Indicator
As users know indicator draws Fibonacci Channels and arrows according to the user's settings.
With CS ATR Fibo Channels Scanner, you will have the ability to watch the market.
- Multi Timeframe - Multi Instrument
Enter your parameters to watch (as explained in Cycle Sniper ATR Fibo Channels Indicator )
- If you cho0se "Arrows by ATR Levels" , you will receive the potential reversal arrrows. - If you choose "Arrows by M

차트에서 피보나치 수준을 그리고 조정하는 과정을 단순화하도록 설계된 놀라운 지표인 Mr. Fibonacci를 소개합니다. 이 지표는 전문 트레이더를 위한 뛰어난 사용자 정의 옵션을 제공하여 피보나치 수준을 정확하게 그릴 수 있습니다. 또한 가격이 피보나치 수준에 진입하면 모바일 알림, 이메일 알림 및 팝업 알림을 제공하여 잠재적인 거래 기회를 절대 놓치지 않도록 합니다. 이 지표를 사용하면 더 이상 피보나치 수준에 도달할 때까지 가격 움직임을 지속적으로 모니터링할 필요가 없습니다. 대신 모바일 알림이나 이메일 알림을 사용하여 계속 정보를 얻을 수 있습니다. 이를 통해 귀중한 시간을 절약하고 거래 전략의 다른 측면에 집중할 수 있습니다. 또한 Mr. Fibonacci는 정확한 분석 및 의사 결정에 중요한 피보나치 수준이 점에서 점으로 올바르게 그려지도록 합니다. 사용자 친화적인 인터페이스와 빠른 액세스 버튼을 통해 Mr. Fibonacci를 쉽게 사용하고 탐색할 수 있습니다.
Description:
This indicator (with its Fibonacci algorithm) marks Buy and Sell zones, which indicate where a trend has a higher probability of continuing either upward, or downward.
Additionally, there are horizontal lines drawn for each day, which show a high probability level of where price is likely to break out, and continue either higher, or lower. This indicator will never repaint.
Features: The main strength of this indicator is that the user is able to visually assess what the

This is a well-known ZigZag indicator. But it differs by the fact that its plot is based on values of the middle line which is set by a user. It can display Andrews’ Pitchfork and standard or Bobokus Fibo levels. NO REPAINTING.
Parameters Period МА — middle line period. Default value is 34. Minimum value is 4. Maximum value is set at your discretion. Used to calculate price - base price to calculate the middle line. The averaging method - method of smoothing the middle line. Turning pitchfork
This is a Indicator that Alert if price closed above/below/touched the line.
Features/Settings: Timeframe supported: 1m, 5m 15m, 30m, 1H, 4H, 1D, 1WK, 1Mo Works on all currency pairs.
Candle Size in Pips: Alert based on Candle Full length or Candle Body Select Line style/width/color Alert type: Popup, Send to Mobile MT4, Email Input notes on alert Add multiple line alerts in a single chart Refer to screenshot:
1 - Time Frame 2 - Long/Short Position 3 - Get the highest open/closed price

Channel Vertex is a price action pattern formed by price Chanel and a triangle pattern . Price channels basically indicates possible support and resistance zones around a price movement and retracement or breakout at these levels can indicate possible trend continuation or reversal .
Majority of the times price fluctuations forms triangle patterns defined by 3 vertexes , these triangle patterns most times defines a trend continuation. A triangle pattern is a trend continuation pattern tha

BeST_123 Strategy is clearly based on the 123_Pattern which is a frequent Reversal Chart Pattern of a very high Success Ratio . It occurs at the end of trends and swings and it’s a serious indication of high probability for a change in trend. Theoretically an 123_pattern is valid when the price closes beyond the level of #2 local top/bottom, a moment when the indicator draws an Entry Arrow, raises an Alert and a corresponding Position can be opened. The BeST 123_Strategy Indicator is non-repai

Automatic fibonacci with alerts is an indicator that automatically plots a fibonacci retracement based on the number of bars you select on the BarsToScan setting in the indicator. The fibonacci is automatically updated in real time as new highest and lowest values appear amongst the selected bars. You can select which level values to be displayed in the indicator settings. You can also select the color of the levels thus enabling the trader to be able to attach the indicator several times with d
Introduction
This indicator marks Pin Bars (bars with an unusually long upper or lower candle wick) on your chart. It will also send alerts when one forms, including via e-mail or push notification to your phone . It's ideal for when you want to be notified of a Pin Bar set-up but don't want to have to sit in front of your chart all day.
You can configure all the settings including: What proportion of the bar should be made up of the wick How big or small the total size of the Pin Bar has
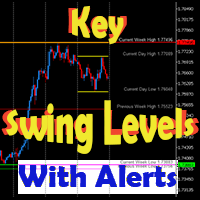
This dynamic indicator will draw the Key Swing High and Low Levels for any symbol on any timeframe!
User may Hide or Show any Level or Label and also Receive Alerts when price returns to that key level via Pop-Up, Push, Email or Sound.
Levels include Current Day High/Low, Previous Day High/Low, Current Week High/Low, Previous Week High/Low and Monthly High/Low.
The Key Levels are labeled with the Price Point Data Listed next to it for quick easy reference.
You can change the Style,

Extreme Value Sniper is a detrended price indicator Indicator finds the potential reversal levels by checking value ranges and price cycles. ***Indicator does NOT repaint so it provides accurate NO REPAINT REVERSAL SIGNALS***
MT5 Version of the product : https://www.mql5.com/en/market/product/114550
It shows the overbought and oversold levels using the average range. Overbought Levels are between 4 and 10 Oversold levels are bewtween -4 and -10
Those levels can be used as a reversal l

"Wouldn't we all love to reliably know when a stock is starting to trend, and when it is in flat territory? An indicator that would somehow tell you to ignore the head fakes and shakeouts, and focus only on the move that counts?" The Choppiness Index is a non-directional indicator designed to determine if the market is choppy (trading sideways) or not choppy (trading within a trend in either direction). It is an oscillating indicator between -50 (very trendy) and +50 (very choppy). There are man

The ICT Concepts indicator regroups core concepts highlighted by trader and educator "The Inner Circle Trader" (ICT) into an all-in-one toolkit. Features include Market Structure (MSS & BOS), Order Blocks, Imbalances, Buyside/Sellside Liquidity, Displacements, ICT Killzones, and New Week/Day Opening Gaps. It’s one kind of Smart money concepts. USAGE: Please read this document ! DETAILS Market Structure Market structure labels are constructed from price breaking a prior extreme

Smart Mone Liquidity Zone
Overview : Smart Mone Liquidity Zone is a sophisticated MetaTrader 4 indicator meticulously crafted to illuminate crucial liquidity zones on price charts, amplifying traders' capacity to discern optimal trading opportunities. Engineered by Yuri Congia, this indicator empowers traders with profound insights into market dynamics, enabling astute decision-making within various timeframes.
Limited-time Special Opportunity:
Seize the moment! Be among the first 10 (Pu

Description A colored multicurrency/multisymbol oscillator of the market mood. The oscillator is designed for detecting the continuation or change of the market mood prior to its occurrence. An excellent example is the screenshots that show all the features of the oscillator. The oscillator may be used with any broker, irrespective of the name of the financial instrument since it is necessary to manually enter the name as an input parameter. If you enter a non-existent or incorrect name of a fin

Fibonacci sequence is defined by integer sequence: 0, 1, 1, 2, 3, 5, 8, 13, 34, 55, 89, 144, ... By definition, it starts from 0 and 1, the next number is calculated as a sum of two previous numbers. Instead of the standard moving average, the indicator uses the caluclation of average price in form:
Bar0 + Bar1 + Bar2 + Bar3 + Bar5 + Bar8 + Bar13 +... Input parameters: FiboNumPeriod (15) - Fibonacci period; nAppliedPrice (0) - applied price (PRICE_CLOSE=0; PRICE_OPEN=1; PRICE_HIGH=2; PRICE_LOW

This indicator is based on the same idea as https://www.mql5.com/en/market/product/2406 , but instead of Average Bars it uses series or Fibonacci sequence. When the previous Price Close is above the previous indicator Bar, the probability to go Long is very high. When the previous Price Close is under the previous indicator Bar, the probability to go Short is very high.
This indicator is based on the Fibonacci sequence. The input parameters fiboNum is responsible for the number in the integer sequence. The input parameter counted_bars determines on how many bars the indicator's lines will be visible. When the previous Price Close is above the previous indicator Bar, the probability to go Long is very high. When the previous Price Close is under the previous indicator Bar, the probability to go Short is very high.

Fibonacci sequence is defined by integer sequence: 0, 1, 1, 2, 3, 5, 8, 13, 21, 34, 55, 89, 144, ... By definition, it starts from 0 and 1, the next number is calculated as a sum of two previous numbers. Instead of the standard moving average, the indicator uses the following calculation of average price: Bar0 + Bar1 + Bar2 + Bar3 + Bar5 + Bar8 + Bar13 + Bar21 + ...
Input parameters FiboNumPeriod_1 - numbers in the following integer sequence for Fibo Moving Average 1. nAppliedPrice_1 - Close p

Fibonacci Ratio is useful to measure the target of a wave's move within an Elliott Wave structure. Different waves in an Elliott Wave structure relates to one another with Fibonacci Ratio. For example, in impulse wave: • Wave 2 is typically 50%, 61.8%, 76.4%, or 85.4% of wave 1. Fibonacci Waves could be used by traders to determine areas where they will wish to take profits in the next leg of an Up or Down trend.

Fibonacci levels are commonly used in finance markets trading to identify and trade off support and resistance levels.
After a significant price movement up or down, the new support and resistance levels are often at or near these trend lines
Fibonacci lines are building on the base of High / Low prices of the previous day.
Reference point - the closing price of the previous day.
Overview This is the DELUXE version in the Pivot Point Plotter Series. It is a robust indicator that dynamically calculates and plots any of the 4 major pivot points on your chart irrespective of intra day timeframe on which the indicator is placed. This indicator is capable of plotting STANDARD, CAMARILLA, FIBONNACI or WOODIE daily pivot points. Whichever you use in your trading, this indicator is your one-stop shop. Kindly note that it is a DAILY Pivot Point Plotter for DAY TRADERS who trade o
Support occurs when falling prices stop, change direction, and begin to rise. Support is often viewed as a “floor” which is supporting, or holding up, prices. Resistance is a price level where rising prices stop, change direction, and begin to fall. Resistance is often viewed as a “ceiling” keeping prices from rising higher. This indicator will draw the Support and Resistance lines calculated on the nBars distance. If input parameter Fibo = true then the Fibonacci lines will appear between those

Fibonacci Arcs in the full circles are based on the previous day's candle (High - Low).
These arcs intersect the base line at the 23.6%, 38.2%, 50%, 61.8%, and 78.6%. Fibonacci arcs represent areas of potential support and resistance.
Reference point - the closing price of the previous day.
These circles will stay still all day long until the beginning of the new trading day when the indicator will automatically build a new set of the Fibonacci Arcs.

Introduction to Harmonic Pattern Scenario Planner
The present state of Forex market can go through many different possible price paths to reach its future destination. Future is dynamic. Therefore, planning your trade with possible future scenario is an important step for your success. To meet such a powerful concept, we introduce the Harmonic Pattern Scenario Planner, the first predictive Harmonic Pattern Tool in the world among its kind.
Main Features Predicting future patterns for scenar

Simply drop the indicator to the chart and Fibonacci levels will be shown automatically! The indicator is developed for automatic drawing of Fibonacci levels on the chart. It provides the abilities to: Select the standard Fibo levels to be shown Add custom levels Draw the indicator on the timeframes other than the current one. For example, the indicator is calculated on the weekly period (W1) and is displayed on the monthly period (MN1) Select the timeframes the indicator will be available on Ca

Pivots is an indicator to show pivots for relevant time frames. Besides the pivots the indicator can also show daly open line, the resistance and support levels, the ADR Fibonacci levels and the order of the pivots. Pivots includes an intelligent algorithm to eliminate Sunday candles, but only if your broker provides those. Pivots are significant price levels that may serve as support, resistance or breakout levels Settings textFont - font to use for the labels. textSize - font size. textColor -

The indicator for automatic drawing of Fibonacci-based Moving Averages on the chart. It supports up to eight lines at a time. The user can configure the period of each line. The indicator also provides options to configure color and style of every line. In addition, it is possible to show indicator only on specific time frames. Please contact the author for providing additional levels or if you have any other suggestions.

Fibolopes (converted from Envelopes) Indicator is based on the Fibonacci sequence. The input parameter FiboNumPeriod is responsible for the number in the integer sequence (0, 1, 1, 2, 3, 5. 8 13, 34, 55, 89...) The indicator will calculate the Main Yellow dot line and 2 bands as a +/- Deviation to it. This indicator is calculating a ZigZag (Aqua line) which combine with Fibolopes together form a system signals for Open (Z crossing Fibolopes) a new position and Close (Z crossing Fibolopes in oppo

The indicator is created for professional trading by Fibonacci levels. AutoFiboLevels plots Fibonacci retracement and extension levels on impulse and corrective wave. The indicator unambiguously interprets a market situation. Points of extremum for level plotting are calculated using fractal analysis. A trader can independently set retracement and extension levels and calculation time frame adjusting the indicator for various strategies.
Parameters: WorkTF - time frame for indicator calculatio

This indicator draws Fibonacci level automatically from higher high to lower low or from lower low to higher high. With adjustable Fibonacci range and has an alert function.
How to use Fibonacci Risk Reward Ration (R3) into trading strategy Forex traders use Fibonacci-R3 to pinpoint where to place orders for market entry, for taking profits and for stop-loss orders. Fibonacci levels are commonly used in forex trading to identify and trade off of support and resistance levels. Fibonacci retrace

Fibox4 indicator displays Fibonacci Retracement, Pivot Point, and many other useful information for analysis. The interface is improved by providing clickable button on chart to switch on/off H4, daily, weekly, monthly swing retracement level.
In addition, fibox4 displays Current Daily Range and Weekly Range.
This version can be used for all pairs..
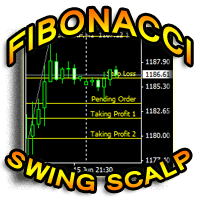
Fibonacci Swing Scalp (Fibonacci-SS) This indicator automatically places Fibonacci retracement lines from the last highest and lowest visible bars on the chart with an auto Pending Order (Buy/Sell), Stop Loss, Taking Profit 1, Taking Profit 2 and the best risk and reward ratio. This is a very simple and powerful indicator. This indicator's ratios are math proportions established in many destinations and structures in nature, along with many human produced creations. Finding out this particular a

This indicator is another variant of the famous powerful indicator Fibonacci-SS https://www.mql5.com/en/market/product/10136 but has different behaviour in placing Pending Order and TP Line. Automatically places Fibonacci retracement lines from the last highest and lowest visible bars on the chart with: An auto Pending Order (Buy/Sell). Taking Profit 1, Taking Profit 2 is pivot point and Taking Profit 3 for extended reward opportunity. The best risk and reward ratio.
Simple and powerful indica

Swing Fibo Marker is adaptive advanced indicator that automatically detects price swings. After swing detection, it draws five profit targets, entry level and stop loss level. Levels are calculated base on price swing size, according to Fibonacci levels specified as entry points. When price touch the level indicator create alerts. List of supported alert types: Popup alerts Email alerts Push notification On screen output Suggested timeframe to trade: H1 or higher. The higher timeframe is used to
This indicator will draw Support and Resistance lines calculated on the nBars distance. The Fibonacci lines will appear between those 2 lines and 3 levels above or under 100%. You may change the value of each level and hide one line inside 0-100% range and all levels above or under 100%.
Input Parameters: nBars = 24; - amount of bars where the calculation of Support and Resistance will be done. Fibo = true; if false then only Support and Resistance will be shown. Level_1 = true; - display of t
The indicator presents reversal points by Fibo levels based on the previous day prices. The points are used as strong support/resistance levels in intraday trading, as well as target take profit levels. The applied levels are 100%, 61.8%, 50%, 38.2%, 23.6%. The settings allow you to specify the amount of past days for display, as well as line colors and types. Good luck!

The indicator displays harmonic ABCD patterns, as well as the market entry points, which allows the trader to make trading decisions quickly. Harmonic ABCD Universal is one of the few indicators that predict price movement by determining pivot points with a rather high probability long before the pivot itself. It supports sending push and email notifications, as well as alerts. The indicator scans all possible combinations on the chart for the current moment, and also in history, with the help o

Ultimate Pivot Point Scanner (Multi Pair And Multi Time Frame) : ---LIMITED TIME OFFER: NEXT 25 CLIENTS ONLY ---46% OFF REGULAR PRICE AND 2 FREE BONUSES ---SEE BELOW FOR FULL DETAILS For over 100 years (since the late 19th century), floor traders and market makers have used pivot points
to determine critical levels of support and resistance. Making this one of the oldest and most widely used
trading approaches used by traders around the world.
Due to their widespread adoption, pivot point

This indicator depends on Fibonacci lines but there is a secret lines i used them, by using FiboRec indicator you will be able to know a lot of important information in the market such as:
Features You can avoid entry during market turbulence. You can enter orders in general trend only. You will know if the trend is strong or weak.
Signal Types and Frame used You can use this indicator just on H1 frame. Enter buy order in case Candle break out the square area and closed over it, at least 20
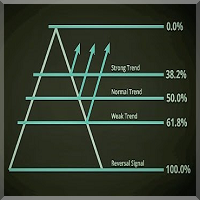
소개 피보나치 레벨 프로페셔널 지표는 거래 설정과 시장이 움직이는 경향을 더 잘 확인하기 위해 다른 지표를 보완하는 일일 거래를 위한 훌륭한 도구입니다. 이 표시기는 설정하기 쉽고 모든 통화 쌍 및 시간 프레임에서 작동합니다. M15-W1이 권장됩니다.
이 지표의 목적은 피보나치 수준을 차트, 일일, 상단 및 하단 라인에 표시하는 것입니다. 추가 기능으로 이 표시기는 차트에 되돌림 및 확장 선을 그리고 일 고점, 저점, 범위 및 스프레드에 대해 알려줍니다. Fibonacci Levels Pro 표시기는 전날의 고가와 저가를 사용하여 계산된 선을 그립니다. 이것은 모든 거래자에게 꼭 필요한 도구입니다! 특징 간편한 설정, 복잡한 설정 없음 깨끗하고 부드러운 차트 라인과 읽기 쉬운 모든 통화 쌍 및 시간 프레임에서 작동 피보나치 선에 대한 조정 가능한 색상 설정 조정 가능한 대시보드 색상 계정 정보가 있는 대시보드 지표 매개변수 UpperFiboColor - 상위 피보나치 레벨
CIS is designed for trading a basket of correlating currencies, as well as single instruments: indicators
VSA indicator which draws arrows (does not redraw). Its signals indicate the price reversal on a calm market or decrease of the rise or fall rate during strong movements. Works fine in the flats. As the indicator uses volumes in its calculations, be careful during evenings and night times, when there are very small volumes. It is recommended to be used only on multiple currencies or at l

Intraday Levels shows intraday levels grid for intraday trading
Shows a grid for the day levels, gives you a guide to know the trend and to measure intraday trades (stop-loss and take-profit).
Parameters are: Levels Mode: Basic mode: Shows highest, lowest and middle levels. Advanced mode: Shows highest, lowest, middle and intermediate levels. Fibonacci mode: Shows session Fibonacci retracements levels. Momentum mode: Shows delayed Advanced levels to identify momentum. Smooth Period (Momentum

Super sniper is the indicator that you're looking for This indicator has an active signal that also able to send push notification to your mobile MetaTrader 4 (see the screenshot for tutorial), so you won't miss any signal during active market. The signal is very simple, " down arrow " for sell and " up arrow " for buy. There are several options as below _SEND_NOTIF_TO_MOBILE: to enable push notification to your mobile MetaTrader for signal _ALERT_SIGNAL: to enable alert signal _SHOW_EMA_TREND:

A ready-made trading system based on automatic construction and maintenance of Fibonacci levels for buying and selling on any instrument (symbol) and on any period of the chart. Determination of trend direction (14 indicators). The display of the trend strength and the values of the indicators that make up the direction of the trend. Construction of horizontal levels, support and resistance lines, channels. Choosing a variant for calculating Fibonacci levels (six different methods). Alert system

Colored indicator of the linear channel based on the Fibonacci sequence. It is used for making trading decisions and analyzing market sentiment. The channel boundaries represent strong support/resistance levels, as they are the Fibonacci proportion levels. Users can select the number of displayed lines of channel boundaries on the chart by means of the input parameters. Attaching multiple instances of the indicator to the chart with different calculation periods leads to displaying a system of c
Colored indicator of the linear channels based on the Fibonacci sequence for the RSI. It is used for making trading decisions and analyzing market sentiment. The channel/channels boundaries represent strong support/resistance levels, as they are the Fibonacci proportion levels. Users can select the number of displayed lines of channel boundaries on the chart by means of the input parameters. Various options for using the indicator are shown in the screenshots. The middle of the channel is shown
Control over the indicator is performed by changing only one parameter directly on the chart. Innovative and precise algorithm for plotting the ZigZag peaks. The "ProZZcom" indicator plots a graphical layout, which allows to quickly find the points for accurate entries and for placing short stop orders. It also predicts a possible flat in the early stages, shows the trend direction and correction in the wave, draws the round levels, draws the Fibonacci level lines. The indicator works on any ins

Pivot Points is used by traders to objectively determine potential support and resistance levels. Pivots can be extremely useful in Forex since many currency pairs usually fluctuate between these levels. Most of the time, price ranges between R1 and S1. Pivot points can be used by range, breakout, and trend traders. Range-bound Forex traders will enter a buy order near identified levels of support and a sell order when the pair nears resistance. But there are more one method to determine Pivot p
This indicator finds double top and double bottom reversal patterns, and raises trading signals using breakouts. [ Installation Guide | Update Guide | Troubleshooting | FAQ | All Products ]
Clear trading signals Customizable colors and sizes Implements performance statistics Customizable fibonacci retracement levels It displays suitable stop-loss and take-profit levels It implements email/sound/visual alerts These patterns can expand, and the indicator follows the pattern by repainting. Howe
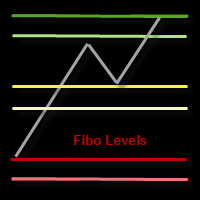
This indicator draws the Fibonacci -38.2, -17, 38.2, 61.8, 117, 138 levels for the last closed H1, H4, Daily, Weekly and Monthly candle.
Features Automatic display of the most important Fibonacci levels.
Parameters TimeFrame: Choose which timeframe you want Fibonacci levels to be based on.
SetLabels: Visible/invisible Fibonacci level labels.
Labels Position : Position of Fibonacci level labels (Right - Left - Middle).
FontSize: Font size of Fibonacci level labels. c38: Color of level 3
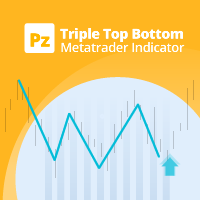
The triple top and bottom pattern is a type of chart pattern used in to predict the reversal of trend. The pattern occurs when the price creates three peaks at nearly the same price level. The bounce off the resistance near the third peak is a clear indication that buying interest is becoming exhausted, which indicates that a reversal is about to occur. [ Installation Guide | Update Guide | Troubleshooting | FAQ | All Products ] Clear trading signals Customizable colors and sizes Implements p

Target Geometry is a next-generation indicator that uses the geometric nature of the markets to give high statistical probability levels ( Fibonacci ). This indicator creates a very important map that optimizes the entry points and it optimally defines your own money management. The indicator can be used both in static mode or in dynamic mode, you can use it on any financial instrument. The use in multi timeframe mode is a very good ally to have. The target levels are high statistical probabilit

Initial Balance Target Strategy is an indicator based on Fibonacci Levels. Its graphics flexibility allows you to adapt very well to your strategies or Trading System setting it with levels in input. The analysis of the time range allows replication of strategies as London Breakout and Kiss . The indicator is fully customizable, you can change colors, texts and percentages of Target. The simplicity and manageability of this indicator makes it an useful tool for all Intraday Trader .
Input Valu
This indicator works based on an improved system of triple moving averages (MA). In conjunction, this system is able to deliver impressive results in trading. The indicator is easy to use. It represents 2 arrows which are automatically drawn after a bar is closed, showing where the price is likely to move in the nearest future based on the combination of the signals from all MAs.
What is Moving Average (MA)? It is one of the most popular, proven and efficient methods for Forex trading. Its pri

This indicator displays the ZigZag Pointer Fibonacci Expansion Triangle movements timeframes only M1-W1.
Parameters InDepth: Displays the Depth movements. InDeviation: Displays the Deviation movements. InBackstep: Displays the Backstep movements. Fibonacci Expansion: Displays the Fibonacci Expansion movements. Fibonacci Expansion true.(false) Triangle: Displays the Triangle movements. Triangle true.(false) How to understand the status: If the Triangle is green, trend is up. If the Triangle is

Important notice! This indicator does not automatically select waves. This is your job.
Features: calculate risk calculate position size mark Elliott waves mark Fibonacci levels change object parameters
Input parameters: Keyboard shortcuts - enable/disable keyboard shortcuts External capital - fill in if you do not keep all your capital in broker account. The risk will be calculated from the sum of the broker account and external capital. Select object after create - if true, then every cre
This indicator is built on a high-precision strategy, which is based on a set of different Moving Averages. Together they form a strategy that provides stable, and most importantly accurate signals.
What is a Moving Average (MA) It is one of the most popular, proven and effective ways to work in the Forex market. Its task is to average price values by smoothing local movements, thereby helping the trader to focus on the major price movements.
How to Trade By default, the indicator has 2 line

This indicator uses the Fibonacci p-numbers to smooth a price series. This allows combining the advantages of the simple and exponential moving averages. The smoothing coefficients depend on the level of the p-number, which is set in the indicator parameters. The higher the level, the greater the influence of the simple moving average and the less significant the exponential moving average.
Parameters Fibonacci Numbers Order - order of the Fibonacci p-number, specified by trader. Valid values

Master Phi is an indicator based on Fibonacci numbers. It analyzes the percentage values returning the proportion of the Golden Section. You can customize values and set custom levels so you will create your personal Trading. The attention on the minimums and the maximums of timeframes allows accurate analysis in order to intercept very precisely the trading levels after the various impulse movements.
Input Values Time_Frame to analyze LEVELS SETTINGS 9 levels (in percentage) 9 colors LINE SET

The indicator trades during horizontal channel breakthroughs. It searches for prices exceeding extreme points and defines targets using Fibo levels. The indicator allows you to create a horizontal channel between the necessary extreme points in visual mode quickly and easily. It automatically applies Fibo levels to these extreme points (if the appropriate option is enabled in the settings). Besides, when one of the extreme points and/or Fibo levels (50%) is exceeded, the indicator activates a so

Every successful trader knows what support and resistance spots are working. And always know that these points need to be kept in mind. They always trade according to this point. The support and resistance point indicator operates in two different modes. The first is the standard support and resistance points we know. The second is Fibonacci levels. This indicator automatically calculates and displays the support and resistance points on the screen.
Features You can select the time frame you w
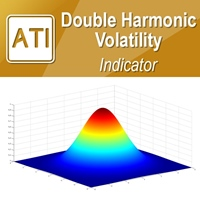
Introduction to Double Harmonic Volatility Indicator Use of the Fibonacci analysis for financial trading can nearly go back to 85 years from today since the birth of Elliott Wave Theory by R. N. Elliott. Until now, traders use the Fibonacci analysis to identify the patterns in the price series. Yet, we could not find any one attempted to use Fibonacci analysis for the Volatility. Harmonic Volatility Indicator was the first technical analysis applying the Fibonacci analysis to the financial Volat

Pivots Points are significant levels traders can use to determine directional movement, support and resistance. Pivot Points use the prior period's high, low and close to formulate future support and resistance. In this regard, Pivot Points are predictive and leading indicators. Pivot Points were originally used by floor traders to set key levels. Floor traders are the original day traders. They deal in a very fast moving environment with a short-term focus. At the beginning of the trading day,

FIBO Price Alert Indicator is very simple but powerful indicator. This is a very well-known indicator that allows you to see and exploit Fibonacci's retracements. This indicator can be used in any currency pairs and on any time frame, but preferably on higher time frames. Moreover, it's relatively easy to trade with FIBO Price Alert Indicator. This indicator produces two signals: BUY Signal: When the price crosses over the virtual line. SELL Signal: When the price crosses under the virtual line.
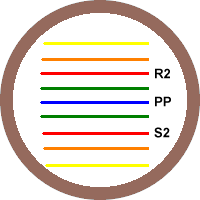
This indicator was created to determine the overall trend of the market. Pivot points are support/resistance level areas, at which the direction of price can change. Many people are looking at those Pivot Point levels, which causes the levels to become almost self-fulfilling. Use this indicator to identify reversal points, so you can place your orders or combine it to recognize key price levels that needs to be broken to take a good breakout trade. With this indicator, its easy to find important

Pivots Dashboard is the single most complete instruments set for Pivot Points trading currently available in the market. We have done a comprehensive research prior to the product design to make sure that this product meets every need of Pivot Point trading. Pivots Points are significant levels technical analysts can use to determine directional movement and potential support/resistance levels. Pivot Points are thus predictive or leading indicators. While the points were originally used by floor
트레이딩 전략과 기술 지표를 판매하기에 가장 좋은 장소가 왜 MetaTrader 마켓인지 알고 계십니까? 광고나 소프트웨어 보호가 필요 없고, 지불 문제도 없습니다. 모든 것이 MetaTrader 마켓에서 제공됩니다.
트레이딩 기회를 놓치고 있어요:
- 무료 트레이딩 앱
- 복사용 8,000 이상의 시그널
- 금융 시장 개척을 위한 경제 뉴스
등록
로그인
계정이 없으시면, 가입하십시오
MQL5.com 웹사이트에 로그인을 하기 위해 쿠키를 허용하십시오.
브라우저에서 필요한 설정을 활성화하시지 않으면, 로그인할 수 없습니다.