MetaTrader 4용 무료 Expert Advisor 및 지표 - 17

This indicator mostly inspired from BW-ZoneTrade custom indicator from MT5. How To Use:
BUY when both dots colored Green. SELL when both dots colored Red. In addition to original one, MACD-OsMA-generated signal also can be drawn. Input Description:
MA_period_short: Faster EMA period for MACD. Applied when drawMACD is true. MA_period_long: Slower EMA period for MACD. Applied when drawMACD is true. MACDperiod: MA period for MACD. Applied when drawMACD is true. drawMACD: When true, draw an addi
FREE

The indicator displays two Moving Average lines on the chart with parameters specified in the settings. It issues a signal in the form of arrows and a sound at the intersection of these Moving Average. In the indicator settings, you can set the period of fast Moving Average ( Fast MA Period ) and slow Moving Average ( Slow MA Period ). And also Shift, Applied Price, Method and Timeframe for two Moving Averages separately. Important:
The main difference from oth
FREE

What is the NASDAQ Plug and Play?
This is a machine learning-designed EA that takes advantage of market inefficiencies using ParabolicSAR and Hull moving average. It is a simple plug-and-play EA that requires no customization. We have used 5-year tick data for the analysis then used Montecarlo trade manipulation and walk-forward matrixs to try to avoid the issue of overfitting. Like with any EA, past performance doesn't equal future performance. But if you are looking for something simple,
FREE

O indicador TRIX, conforme o utilizado pelo grafista Didi Aguiar.
Este indicador é composto pela Triple Exponencial Average (TRIX), que neste setup é utilizada com o período 9, e um sinal de média simples do próprio indicador que é utilizado com o período 4.
Parâmetros: Período: 9 Sinal: 4
Os demais indicadores do sistema operacional de Didi Aguiar são:
Bollinger: período 8, desvio 2 ADX: período 8 DidiIndex com médias simples, períodos: 3, 8 e 20 Estocástico: 8, 3 3
FREE

Introducing our simple yet powerful trendline trading expert, designed to open positions upon trendline breaks or touches based on predefined parameters. All you need to do is rename it to buy, sell, buy limit, or sell limit. As the name suggests, this is the basic version with minimal features. However, if you're looking for a truly professional trendline trading expert equipped with various trading management tools, automatic position sizing, trailing stops, breakeven points, partial closures,
FREE
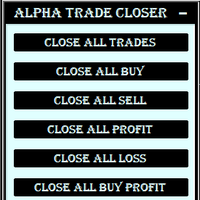
This Utility is created to close Open Trades on the go by filters.
If you want any custom feature or want to remove something from this product for your personal use. Please send me a personal message, I'll be happy to do so for you.
Buttons & their Tasks :
CLOSE ALL TRADES : Close all open trades CLOSE ALL BUY : Close all Buy trades CLOSE ALL SELL : Close all Sell trades CLOSE ALL PROFIT : Close all trades that in Profit CLOSE ALL LOSS
FREE

This indicator is the basis for an Expert Advisor that can be categorized as "almost Grail". See details below. This indicator displays the projection of the Renko chart on the price chart. This projection is displayed as a stepped line, not as "bricks" (rectangles). See slides 1 and 2. Abbreviated name of the indicator: LRC – L ine of R enko on the price C hart. The principle of its construction is very simple. First, a grid of horizontal lines (levels) is bu
FREE

The indicator is completely based on the classic MFI indicator. I recommend watching my advisor - Night Zen EA
It contains two basic trading strategies: The output of the MFI line from overbought/oversold zones. The entry of the MFI line into the overbought/oversold zones. Arrows are drawn after confirming the signal by strategies and are not redrawn.
Alerts are also registered: Alerts Push notifications to the mobile terminal email Settings: MFI period - the period of the MFI indicator L
FREE
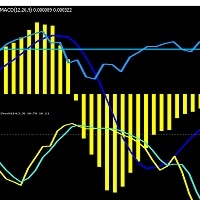
Use Stochastic with oversold and overbought to find trading opportunities. Use RSI to identify strength of trend anf confirm the trend matches the stochastic overbought and oversold. Trade on MACD cross matching the trend identified by Stochastic and RSI. Set stop loss at a recent swing high or swing low. Set take profit as a ratio of stop loss. Exits are on take profit and stop loss only, there is no exit signal.
FREE

Unlock the secret to consistent growth in your trading account with Constant Grow , the ultimate trading indicator. Powered by a combination of advanced indicators including RVI Signal, Moving Average, Volumes, Stochastic, and Alligator, this revolutionary tool has been meticulously backtested over a two-year period (2021-2023) to ensure its effectiveness. With Constant Grow , you can now protect and expand your account balance while minimizing risks. Our expert advisor takes care of all money
FREE

What is ADR? Quite simply, ADR (Average Daily Range) is the average of price movement over a period of time. It can be used as a gauge of how far price may move on any given trading day. This indicator calculates 5, 10, 20 Average Daily Range Features: - Average: Daily Range, Prev 1/5/10/20 days - Calculator maximum stop loss/profit target by Risk/Reward percent of ADR in Pips. - Candle countdown - ... Contact me if you need: https://t.me/Cuongitl
FREE

T-Explorer is a Real Time Optimized MetaTrader 4 tool that provides tradable information based on the 10 of the most popular and reliable technical indicators in many timeframes. Our machine learning models calculate the optimum rules and configuration for each indicator in order to provide high probability signals of success. Users are able to customize T-Explorer by selecting suitable timeframes and mode ( FAST, MEDIUM, SLOW ) for the indicators to be used. T-Explorer aggregates and combines o
FREE

MACD divergence Simple edition 原始MACD计算方式,升级为双线MACD,使判断更加直观更加贴合大宗交易平台的研究习惯,同时还会自动用实线标出背离,不用再从0开始苦学钻研。
同时,我还提供了提醒服务,在你忙于家务无暇顾及的时候只需要打开音响,一旦达成背离,第一时间就会让你知晓。
这是一款简单版的看背离指标,MACD的九天均线被称为“信号线”,然后绘制在MACD线的顶部,它可以作为买入和卖出信号的触发器。当MACD越过信号线时,交易员可以买入操作,当MACD穿过信号线以下时,交易者可以卖出或做空操作。移动平均收敛-发散(MACD)指标可以用几种方法解释,但更常见的方法是交叉、散度和快速上升/下降。
FREE
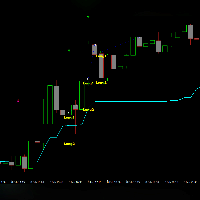
Der Ichimoku EA handelt vollautomatisch
Du bekommst hier einen tollen EA mit extra Zubehör, Kostenlos !
Er verwendet keine gefährlichen Strategien wie Martingale oder Gritter usw. Bei diesem EA kannst du vieles nach deinen Wünschen, oder nach meinem Set einstellen. Zusätzlich hat er einen News Filter, er pausiert die trades während der eingestellten Zeit. Zusätzlich erhöht er auf Wunsch die lots Grösse automatisch.
Der Backtest und die trades wurden mit IC Markets gemacht Hebel 1:500 Zer
FREE

The Hull Moving Average (HMA), developed by Alan Hull from 2005, one of the most fast-moving Average, reduce lag and easy to use to identify Trend for both Short & Long term. This Indicator is built based on exact formula of Hull Moving Average with 3 phases of calculation: Calculate Weighted Moving Average (WMA_01) with period n/2 & (WMA_02) with period n Calculate RAW-HMA: RAW-HMA = 2 * WMA_01(n/2) - WMA_02(n)
Weighted Moving Average with period sqrt(n) of RAW HMA HMA = WMA (RAW-HMA, sqrt(n
FREE

This application is now replaced by Ofir Notify Light Edition (Free) or Ofir Notify (paid).
Thank all for your positive feedbacks.
Ofir Notify is a tool which send alerts on trades to Telegram Alert on any event concerning a position : Opening, Closing, modification (SL, TP) Send alerts to Chats, Groups and Channel Alert on Equity change Display Risk, Reward and progress of profit/lost for each position Customization of alerts ( only in full edition ) Sending charts screenshots with alerts
FREE

이 무료 도구가 마음에 드신다면 별 5개 등급을 남겨주세요! 매우 감사합니다 :) "위험 관리 보조원" 전문가 자문 컬렉션은 다양한 시장 상황에서 위험을 효과적으로 관리함으로써 거래 전략을 향상시키도록 설계된 포괄적인 도구 모음입니다. 이 컬렉션은 평균화, 전환 및 헤징 전문 자문의 세 가지 주요 구성 요소로 구성되며 각각은 다양한 거래 시나리오에 맞는 뚜렷한 이점을 제공합니다.
이 EA는 시장의 표준 위험 관리 전략을 개발한 것입니다.
https://www.mql5.com/en/blogs/post/756961
1. "평균화 도우미" EA: MT4 : https://www.mql5.com/en/market/product/115468 MT5 : https://www.mql5.com/en/market/product/115469 2. "스위칭 어시스턴트" EA : MT4 : https://www.mql5.com/en/market/product/115478 MT5 : https
FREE

The purpose of this new version of the MT4 standard indicator provided in your platform is to display in a sub-window multiple timeframes of the same indicator. See the example shown in the picture below. But the display isn’t like a simple MTF indicator. This is the real display of the indicator on its timeframe. Here's the options available in the FFx indicator: Select the timeframes to be displayed (M1 to Monthly) Define the width (number of bars) for each timeframe box Alert pop up/sound/ema
FREE

The XR Gartley Pattern MT4 is an indicator which displays and alerts Gartley pattern detected on the candlestick chart. It also displays potential trade with calculated Take Profit and Stop Loss, Timeframe H1. After purchasing XR Gartley Pattern, you can immediately download this indicator from the MT4-MT5 Market and start using it because all features are set to default, is not necessary to change any parameter. In addition, we have created a private group for customers who have purchased one
FREE

This indicator continuously changes the color of candlestick borders and bodies, as well as the color of volumes in real time. The indicator is easy to use. The palette of colors is diverse. This product is a graphical solution, so it is difficult to describe what it does by text, it is easier to see by downloading it, besides the product is free. The indicator is suitable for bloggers who want to create a beautiful picture of a chart for video editing or traders who want to make their chart al
FREE

Download directly the indicator file here. (if you can't open on MT4) MACD Indicator is one of the most popular momentum indicators among users. Searching and detecting MACD signals by the eye may not be easy. Scan Full Charts Dashboard Indicator with simple user interface and search customization panel saves time and scans all charts for MACD signals search and notifies the user with high accuracy. After finding the signal, the user was aware of the result by alerts and notifications. This ind
FREE

하나의 계정(마스터)에서만 거래하면서 관리되는 위험과 로트 크기로 여러 계정을 동시에 관리하시겠습니까?
특징:
마스터(메인) / 슬레이브(계정 복사) 허용된 슬리피지(가격 차이) 곱하기/나누기(복사 로트 나누기 또는 곱하기 계수) 로트 계수(나누기 또는 곱하기를 위한 계수) 모두 닫기(모든 활성 위치 닫기 버튼) 출시 예정:
모두 닫기 - 슬레이브만 모든 이익 포지션 닫기 - 마스터 및 슬레이브 모든 이익 닫기 - 슬레이브 전용 Check out our indicator RelicusRoad for best results: https://www.mql5.com/en/market/product/861300 Join our discord group as well RelicusRoaders
FREE

Property of Vertical Capital Edition: Gugol_Quants About USA INDEXES QUANT_INDICATOR: This is a indicator created by math modulation to be used as a trading tool, which was developed in MQL. (MT4) This indicator is for use only with US500(S&P500), NAS100(Nasdaq Composite) and US30(Dow Jones). Signals are activated on "Open" Candle. It’s based on Intraday/Swing Trades whose main timeframe is H1, H2, H3 and H4. However you can use it with other assets by testing with the appropriate settings. *
FREE

Highly configurable CCI indicator. Features: Highly customizable alert functions (at levels, crosses, direction changes via email, push, sound, popup) Multi timeframe ability Color customization (at levels, crosses, direction changes) Linear interpolation and histogram mode options Works on strategy tester in multi timeframe mode (at weekend without ticks also) Adjustable Levels Parameters:
CCI Timeframe: You can set the current or a higher timeframes for CCI . CCI Bar Shift: you can se
FREE
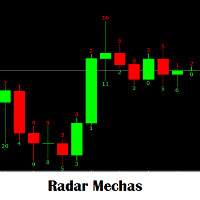
수동 입력 경고를 생성하는 크기에 따라 양초를 떠나는 심지의 크기를 보는 역할을하는 표시기. 전략이 이전 양초 또는 동일한 현재 양초의 심지 크기의 빈 공간을 제공하는 것을 최대한 활용하십시오. 구매 및 판매를 입력합니다. 새로운 항목에 대해 수행되는 모든 분석에 필요한 지표입니다. 가장 좋아하는 도구가 될 것입니다. sudong iblyeog gyeong-goleul saengseonghaneun keugie ttala yangcholeul tteonaneun simjiui keugileul boneun yeoghal-eulhaneun pyosigi. jeonlyag-i ijeon yangcho ttoneun dong-ilhan hyeonjae yangchoui simji keugiui bin gong-gan-eul jegonghaneun geos-eul choedaehan hwal-yonghasibsio. gumae mich panmaeleul iblyeoghabnida. sa
FREE

차트에서 피보나치 수준을 그리고 조정하는 프로세스를 단순화하도록 설계된 강력하고 무료인 Ms. Fibonacci를 소개합니다. 이 표시기는 새로운 최고 및 최저 피보나치 레벨을 자동으로 식별하고 표시하여 정확하고 정확한 배치를 보장합니다. Ms. Fibonacci의 핵심 기능 중 하나는 피보나치 수준을 정확하게 그리고 점과 점 사이에 해당하는 가격 수준을 표시하는 기능입니다. 이 기능을 사용하면 시간과 노력을 절약할 수 있으므로 수동으로 피보나치 수준을 그리는 대신 시장 분석에 집중할 수 있습니다. 지표에는 0, 23.6, 38.2, 50.0, 61.8, 100.0 및 161.8과 같은 가장 중요한 피보나치 수준이 포함됩니다. 이 수준은 시장에서 잠재적 지원, 저항 및 되돌림 영역을 식별하기 위한 중요한 기준점 역할을 합니다. Ms. Fibonacci는 사용자에게 친숙한 매개변수를 제공하여 지표를 원하는 대로 사용자 지정할 수 있습니다. 선 스타일, 선 너비, 선 색상 및 기
FREE

Summary: This EA places a single trade at a time in a RANDOM direction (buy or sell) and uses a simple TP & SL. A lot multiplier is also optional. Once a trade hits TP/SL, it will place another trade in a random direction. And so on. Since it only ever has 1 trade open at a time, it can be used on any broker. Which means it can be used on US brokers with the FIFO rule. Inputs are few and everything is based in Points too. So it can be used on any chart reliably and easily. You will be amazed how
FREE
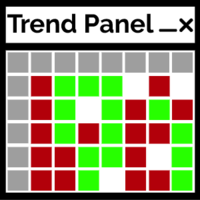
Trend Panel은 사용자가 선택한 10개 쌍을 사용하여 시간 프레임 M1 - D1의 확인된 추세 방향을 표시하는 간단하고 편리한 도구입니다.
이 표시기는 모든 전략/템플릿에 방향 확인을 추가한 다음 차트를 다른 쌍 또는 기간으로 빠르게 변경하기 위한 깨끗한 대화식 인터페이스로 작동하도록 설계되었습니다. 그룹채팅 : https://www.mql5.com/en/users/conorstephenson 구매 후 설정 조언과 무료 전문가 고문을 위해 저에게 연락하십시오! 내 제품은 MQL5에서만 판매되는 제품입니다 . 다른 곳에서 이 제품을 본다면 모조품입니다. 속지 마세요. 주요 특징들 차트 패널을 정리하면 시간 프레임의 추세 방향을 빠르게 결정할 수 있습니다. 대화형 기능. 차트에 있는 양초의 색상을 변경합니다. 현재 및 과거 추세를 쉽게 볼 수 있습니다. 페어 및 타임프레임 버튼은 클릭 시 작동하여 현재 열려 있는 차트를 변경합니다. 템플릿 설정에 가장 적합한 위치로 차트의
FREE
An Expert Advisor based on the 3 candlestick pattern.
1-SL, 2-TP, 3-OFF - 1 pulls up StopLoss. 2 pulls up TakeProfit. 3-disabled.
auto SL / TP on hi-low count bars - number of bars for 1-SL, 2-TP expiration on profit - after passing N bars, TP changes
expiration on loss - after N bars have passed SL to open an order + commission pips for loss expiration - the number of points for expiration on profit
The rest of the settings are intuitive.
FREE
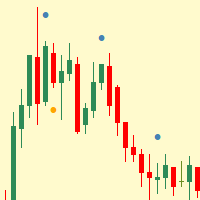
Simple indicator that shows internal (inside) bars.
Internal bars are probably one of the best price action setups to trade Forex with. This is due to the fact that they are a high-chance Forex trading strategy. They provide traders with a nice risk-reward ratio for the simple reason that they require smaller stop-losses compared to other setups. They can also be successfully utilised as reversal signals from key chart levels. Inside bar is a series of bars contained within the range of the c
FREE

This indicator is designed for calculating the value of points for the specified lot sizes. The MT5 version is here https://www.mql5.com/en/market/product/29230 Description by lines Line 1 - deposit currency. Line 2 - lot size (10 input parameters) . All further values are calculated into columns below each lot size. Line 3 - calculation of value for one point. Line 4 - calculation of value for spread. All subsequent lines - calculation of value for points (20 input parameters) . All you need t
FREE
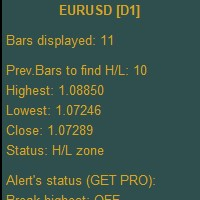
Higher Timeframe Chart Overlay will display higher timeframe candles, including the number of candles high/low you specify.
You no longer need to switch timeframes to check the candles. Everything can be shown in one chart. Get Full Version - https://www.mql5.com/en/market/product/115680 Please feel free Contact me if you have any questions regarding this tool.
FREE

ขอบคุณ แรงบันดาลใจ จากโค้ชแพม ที่ทำให้เริ่มทำ Close all ตัวนี้ Close all and update profit Version 3.03 Full version Give you free
For MT5 Click https://www.mql5.com/en/market/product/95989
V3.03 Fix TPSL calculate USDxxx and xxxUSD or XXX/XXX and add Decimal Digi, 0 is default
Program function
Tab 1 Close order function and show break port
1.Can show and hidden all button
2.Update sell and buy total lots easy to manage order
3.Close all order and update all profit
4.Clos
FREE
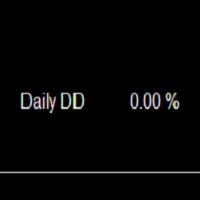
Daily Monitoring : The indicator automatically calculates and displays the daily drawdown on your trading chart, allowing you to see how well you're performing on a daily basis. Risk Management : By monitoring daily drawdown, traders can better manage their risk. It helps to keep daily losses within acceptable limits. Real-Time Information : Daily drawdown is updated in real-time, providing accurate and up-to-date information about your trading performance. How to Use: Activate the "Daily Drawd
FREE

Trade Receiver Free is a free tool to copy trades/signals from multiple MT4/MT5 accounts. The provider account must use copier to send the signal. This version can be used on MT4 accounts only. For MT5 accounts, you must use Trade Receiver Free for MT5. Reference: For MT5 receiver, please download " Trade Receiver Free " .
For MT4 local provider on the same PC/VPS, please check " Auto Trade Copier " . For MT4 remote provider on different PC/VPS, please check " Trade Copier Pro " or " Unlimited
FREE
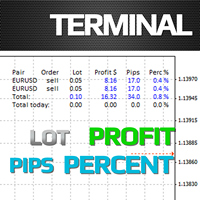
The Terminal indicator is a substitution for the standard Terminal tab. The indicator is displayed as a kind of table consisting of several elements: A row with column descriptions; Open orders; Summary information of open orders; Summary information of current day closed orders. The indicator settings: Graph corner for attachment - the corner of the chart where the table will be positioned Font - font type Fontsize - font size Text color - display settings
Profit color - display settings Loss
FREE
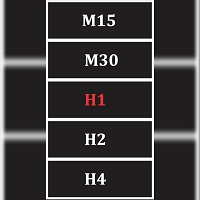
Seamlessly switch between 13 (9 mt4 default and 4 popular custom) time frame with this tool. Real ease of switching between default and custom time frames. Note indicator does not create custom time frame chart data, it only enables you to switch to and from them. Creating a custom time frame can be done using the default mt4 period converter script attached to a lesser default mt4 time frame. Example attach period converter on M1 and set period multiplier to 10 to have a custom M10 chart.
FREE
Description
The base of this indicator is an ZigZag algorithm based on ATR and Fibo retracement. This indicator is not redrawing in sense that the ZigZag's last shoulder is formed right after the appropriate conditions occur on the market. The shoulder doesn't change its direction afterwards (can only continue). Note: An indicator with advanced possibilities is also available.
Indicator input parameters
The input parameters allow to change the sensitivity of the ZigZag. ATR period ATR mul
FREE

This product is only for testing purposes on DEMO accounts. Please do not use it on a real account, as it is very dangerous. It uses a system of closure of trades from the oldest first and the newest first, trying to experiment with a grid system, however it does not win at the end. It is just fun to try. Who is interested I can give the mq4 code to examine it and maybe improve it.
FREE
This is a simple Expert Advisor that uses the RSI indicator to enter a trade and several patterns. the advisor trades one deal and each deal has a stop loss and take profit (set in the settings) in case of failure (the deal is closed by stop loss), it is possible to increase the lot of the next deal. The telegram group: https://t.me/FXAdvisorsMy Start_trade - time to start trading End_trade - trade end time Lot - size of the lot for opening the first order (this is a fixed lot
FREE

Having to check constantly if your RSI has reached a specific level can be tedious and draining at times, especially if you have to monitor different asset classes at a time. The Alert RSI indicator will assist in this task, ensuring that you get the most with little effort. When the RSI values get to a specified level, the alerts will go off, on the chart, on the MT4 phone app or via email (You can receive text messages to your phone if you activate texts on your Gmail account). The indicator d
FREE

BeST_ Classic Pivot Points is an MT4 Indicator that is based on the widely known and definitely classic Pivot Point of a market prices activity. A pivot point is calculated as an average of significant prices (high,low,close) from the performance of a market in the prior trading period. If the market in the following period trades above the pivot point it is usually evaluated as a bullish sentiment, whereas trading below the pivot point is seen as bearish. A pivot point and the associated suppo
FREE
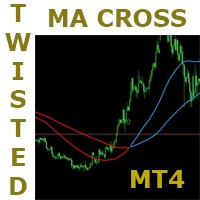
This is a very simple but very powerful strategy. It has a lot of potential. This strategy is based on the popular moving average crossover but with a very interesting twist to it. It has some mechanisms to delay signals untill direction is clear and confirmed. Follow the indication colors and arrows for trade ideas It has a potential winning rate of somewhat greater than 70%. Try it in all timeframes and determine which one is good for you. ===========
FREE

This is a forex supporting tool for all manual traders.
You can close positions immediately at once on the MT4 Terminal by a single click. CLOSE SELL: You can close SHORT positions of the target currency pair (same as the chart you’re using this EA). CLOSE BUY: Same as above but LONG positions will be closed. CLOSE ALL: All opened positions will be closed (no matter of currency pairs). You can select the closing method from CLOSE ALL or CLOSE ONE BY ONE. You can choose the positions to be close
FREE

Advantages: Based on classic indicators - ATR, Moving Average Determines the trend / flat in the market by coloring the histogram with the appropriate color Arrows indicate confirmed signals It is an excellent filter for channel strategies (by extremes)
Settings:
Наименование Описание настройки Period of Flat Detector Number of bars / candles for analysis Period of EMA Period of EMA (Moving Average) Period of ATR Period of ATR (current timeframe) Coefficient of deviation Coefficient of devia
FREE

MASi Three Screens is based on the trading strategy by Dr. Alexander Elder. This indicator is a collection of algorithms. Algorithms are based on the analysis of charts of several timeframes. You can apply any of the provided algorithms.
List of versions of algorithms:
ThreeScreens v1.0 - A simple implementation, with analysis of the MACD line; ThreeScreens v1.1 - A simple implementation, with analysis of the MACD histogram; ThreeScreens v1.2 - Combines the first two algorithms
FREE

The purpose of this new version of the MT4 standard indicator provided in your platform is to display in a sub-window multiple timeframes of the same indicator. See the example shown in the picture below. But the display isn’t like a simple MTF indicator. This is the real display of the indicator on its timeframe. Here's the options available in the FFx indicator: Select the timeframes to be displayed (M1 to Monthly) Define the width (number of bars) for each timeframe box Alert pop up/sound/ema
FREE

Gain Guard MT4
secures the profits of all or selected trades on one terminal or on several terminals with the same account number. The selection can be configured according to Magic numbers and/or symbols, so that the Magic numbers and/or symbols that are not selected remain unconsidered. What is it useful for? For example, when several experts trade on one terminal and manual trading also takes place. Experts have different strategies and SL/TP. In particular, some experts let the trades run
FREE

This Expert advisor (100% Automatic) is able to combine two indicators to create a strategy, this version called "Bear version" (BASIC VERSION)contains 2 indicators: CCI and RSI With a simple personal message you can contact me to ask for your EA "Bear version"(or SUPERIOR Version)with the indicators you have chosen and with your conditions and once agreed I will put it here on the market , or follow the link at the bottom of the page that will take you to my Telegram contact. If you can't
FREE

이 인디케이터는 거래 차트에 돈치안 채널을 시각적으로 표시하는 목적으로 사용됩니다. 돈치안 채널은 특정 기간 동안의 최고점과 최저점 사이의 범위를 나타내는 간단한 기술 도구입니다. 이 인디케이터는 가격 움직임의 시각적 분석을 향상시키며 잠재적인 돌파 지점 및 추세 지속 포인트에 대한 통찰력을 제공합니다. 돈치안 채널은 현재 시간 프레임과 더 높은 시간 프레임 모두에 적용할 수 있으며 이 옵션을 활성화할 수 있습니다. 인디케이터 주요 기능: Use_System_Visuals: 이 매개변수를 활성화하면 시스템의 시각적 스타일 사용 또는 인디케이터의 외관을 사용자 정의할 수 있습니다. 활성화되면 인디케이터의 시각적 요소가 거래 플랫폼의 전반적인 테마에 일치하도록 조정됩니다. Signal_from_HT_Timeframe: 이 옵션을 활성화하면 더 높은 시간 프레임에서 신호를 수신할 수 있습니다. 다시 말해 더 긴 시간 프레임에서의 돈치안 채널 동작을 고려하여 현재 시간 프레임에서의 거래 결
FREE

After purchasing, you can request and receive any two of my products for free!
После покупки вы можете запросить и получить два любых моих продукта бесплатно! The Trading Robot will save you from the trading routine and difficulties associated with the correct opening and closing of positions. The strategy is based on the Keltner channel and Bollinger Bands and is designed for long-term trading on the Forex market with XAUUSD, EURUSD, GBPUSD, USDCHF currency pairs. In the parameters of the
FREE
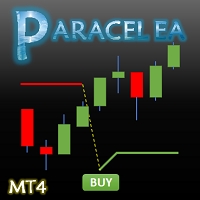
Paracel EA is an advanced and fully automated Expert Advisor designed to help traders navigate the complexities of the financial markets. Using a sophisticated strategy based on the Supertrend indicator and another built-in indicator, Paracel EA can analyze market conditions and identify trading opportunities with remarkable precision. The EA is equipped with a range of powerful features, including martingale functions, to help maximize profits and minimize risks. Whether you're a seasoned trad
FREE
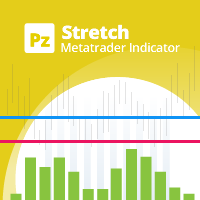
The Stretch is a Toby Crabel price pattern which represents the minimum average price movement/deviation from the open price during a period of time, and is used to calculate two breakout levels for every single trading day. It is calculated by taking the 10 period SMA of the absolute difference between the open and either the high or low, whichever difference is smaller. This value is used to calculate breakout thresholds for the current trading session, which are displayed in the indicator as
FREE

The indicator shows the Fibonaccia golden ratio levels and the price balance line Has three different sensitivity options Allows you to visually navigate what state the market is in and where trend reversals are possible Works on all timeframes, on any currency pairs, metals and cryptocurrencies Can be used when working with binary options Distinctive features Based on the golden Fibonacci value; Determines the balance line of price equilibrium Has three different sensitivity settings; Simple an
FREE
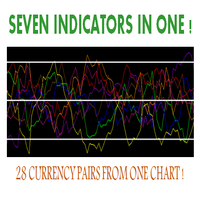
Hello, This indicator is a unique high reliability 7-in-1 multicurrency indicator comprising these sub-indicator’s: A Trend Power Crossover Indicator. A Percent Change Crossover Indicator. A Currency Overbought/Oversold Indicator. A Currency Deviation Indicator. A Currency Impulse Signal Indicator. A Trend Power Indicator. A Currency Volatility Indicator. The main advantage of this indicator is that it's reasoning by currency and not by currency pair. The values of each sub-indicator are calcul
FREE

Emulate TradingView drawing experience with magnet snap to the nearest price.
Supported drawing tools: Vertical Line Horizontal Line Trend Line Horizontal Ray (Angle Trend Line) Fibonacci Retracement Rectangle
Input:
Threshold (px) : The distance in pixel unit to snap the crosshair to the nearest price.
Feel free to write the review, request more features or report bugs.
FREE

The volume weighted average price (VWAP) is a trading benchmark used by traders that gives the average price a security has traded at throughout the day, based on both volume and price. VWAP is calculated by adding up the dollars traded for every transaction (price multiplied by the number of shares traded) and then dividing by the total shares traded. You can see more of my publications here: https://www.mql5.com/en/users/joaquinmetayer/seller
FREE
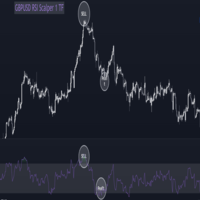
What is RSI:-
RSI stands for Relative Strength Index, which is a popular technical indicator used in financial markets, particularly in the analysis of stocks, commodities, and other securities. RSI is used by traders and investors to assess the strength and potential direction of price movements in an asset. Here's how RSI works: Calculation : RSI is calculated using a formula that takes into account the average gain and average loss over a specified period (typically 14 periods). The formula
FREE

The indicator is specially designed for the trading utility Trade Shell (included Trade Shell SMC ) to get it working on visual strategy tester.
Backtest your trading ideas and indicators. Run Trade Shell on visual tester and then put this indicator on the chart. After that you will be able to control all functions of the Trade Shell as well as with live using! It does not work live! Use it with visual tester only. It does not require to set any setting on input parameters.
Have a good luc
FREE

This indicator helps you to scan symbols which are in the Market Watch window and filter out a trend according to RSI.
The relative strength index (RSI) is a technical indicator used in the analysis of financial markets. It is intended to chart the current and historical strength or weakness of a stock or market based on the closing prices of a recent trading period. The indicator should not be confused with relative strength. The RSI is classified as a momentum oscillator, measuring the veloc
FREE

Индикатор рисует уровни Фибоначчи с выделенными Ценовыми метками.При установке индикатора на график необходимо создать трендовую линию с именем указанным в поле" Unique name of trend line to place fib on ". По умолчанию имя=" Unique name of trend line to place fib on" = "+" .В индикаторе можно заменить уровни фибоначчи по своему усмотрению.Также меняются цвет,стиль,толщина линий и т. д.
FREE
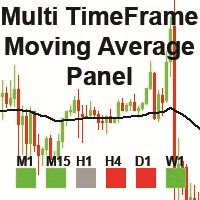
The "MTF Moving Average Panel" indicator is more of a helping tool than an indicator, it serves to help traders to spot the trend direction without having to change the timeframe and check all timeframes. It is best used with other indicators and signals, to help filter the signals according the trend based on multiple timeframes.
Indicator inputs : - Moving Average period : The period for the Moving Average. Default is set to 50 periods. - Moving Average method : The method of calculation of
FREE

The YK-LOT-SIZE is an indicator that displays the total Lot Size and profit/loss of all trade orders for the current symbol on the price chart. It has the following features: Shows the total Lot Size of buy orders (BUY) and sell orders (SELL) on separate lines. Displays the profit/loss of buy orders (BUY) and sell orders (SELL) by calculating the sum of profit, commission, and swap. Users can customize the color of the displayed text through the input parameter. The information is displayed at t
FREE

Manually backtesting your strategy or trading system on MT4 Strategy Tester like you do on TradingView, but with free offline history data provided by MT4 or your broker, which means more resposive and much more lower timeframe data available. Because MT4 Strategy Tester doesn't detect mouse events, we will use the MT4 Horizontal Line tool and Arrows tool to modify the TP/SL/Entry and etc. on the screen.
Features:
70% TradingView backtesting user experience, due to the Strategy Tester's li
FREE

Простой советник основанный на сигналах индикатора Relative Strength Index (RSI) в зоне перекупленности - продаем, в перепроданности - покупаем. Моя версия всем известного "Dynamic". Я рекомендую использовать этот советник в полуавтомате.
Добавляйтесь в друзья, присылайте свои интересные стратегии. Возможно после обсуждения всех нюансов напишу советника бесплатно . Параметры: "_Slippage" - Проскальзывание; "_ M
FREE

Th indicator is a technical analysis tool that helps identify significant changes in price trends and filter out minor price fluctuations. It is used to highlight price swings and provide a clearer picture of market movements. The Pivots are found by checking if a certain candle is the highest/lowest in a given number of candles that come before and after it. This indicator has only one input, its period. The Higher the period, the more strict the indicator is about what constitutes a Pivot. Th
FREE

The indicator displays crossing zero level by Moving Average of Oscillator (OsMA) in the form of arrows. The indicator notifies about a signal by means of a pop-up Alert window, or sending notification to e-mail.
Parameters Fast EMA Period - fast EMA. This is an exponential moving average from a price with a short period. Slow EMA Period - slow EMA. This is also an exponential moving average of a market price but with a longer period. Signal SMA Period - MACD SMA. This is a signal line which i
FREE

Main: Not martingale, not a grid; Working on all symbols;
Signals: There is a good rational algorithm. Work of two indicators: Envelopes and Moving Average (you can set a separate Timeframe for each indicator)
Stop Loss/Take Profit: There is a good money management system (there are several type for trailing stop loss); There is virtual levels of Stop Loss / Take Profit; There is smart lot (percent by risk) or fix lot
Important: EA can work on closed candles, and on current candles; Quick
FREE

A trend indicator showing the strength of bulls and bears in a trading range.
Consists of two lines:
The green line is a balanced overbought/oversold condition. The red line is the direction of trading activity. Does not redraw calculations.
Can be used on all Symbols/Instruments/Time Frames.
Easy to use and set up.
How to use the indicator and what it determines.
The basic rule is to follow the direction of the red line:
if it crosses the green line from the bottom up, the market i
FREE
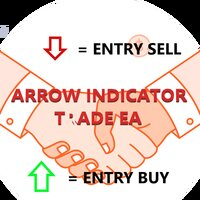
Arrow Indicator Trade EA is an Expert Adviser who trades based on custom indicators. When the indicator shows an arrow up, EA will enter into an OP BUY order. Likewise, when the indicator shows an arrow down, EA will make an OP SELL entry. Features: 1. Stop Loss and Manual and Auto TP based on the ATR indicator. 2. Auto Lot and Fixed Lot. 3. Close By Loss and Close By Profit features. 4. Target Profit Balance and Minimum Stop Balance 5. Easy to use. EA does not generate its own signals but gener
FREE
MetaTrader 마켓은 거래 로봇과 기술 지표들의 독특한 스토어입니다.
MQL5.community 사용자 메모를 읽어보셔서 트레이더들에게 제공하는 고유한 서비스(거래 시그널 복사, 프리랜서가 개발한 맞춤형 애플리케이션, 결제 시스템 및 MQL5 클라우드 네트워크를 통한 자동 결제)에 대해 자세히 알아보십시오.
트레이딩 기회를 놓치고 있어요:
- 무료 트레이딩 앱
- 복사용 8,000 이상의 시그널
- 금융 시장 개척을 위한 경제 뉴스
등록
로그인
계정이 없으시면, 가입하십시오
MQL5.com 웹사이트에 로그인을 하기 위해 쿠키를 허용하십시오.
브라우저에서 필요한 설정을 활성화하시지 않으면, 로그인할 수 없습니다.