모든 주문
모든 주문
 규칙
규칙
명시
This MT5 EA will be based on Crossover of a few of Exponential Moving Average to Support and Resistant Line as follow:
TOOLS
1. Exponential Moving Average 5
2. Exponential Moving Average 21
3. Exponential Moving Average 55
How the EMA works?
- It will be based on crossover. Case study will be provided later
4. S&R Line
- S&R Line has different VALUE every single day
- Formula calculation for VALUE of the day as per below (a little bit different for each of instruments);
For Forex : 5 decimals
· [ (Yesterday High – Yesterday Low) + 3 PIPS ] / 2 = VALUE of the day
· For example on EURUSD (High : 1.15867 , Low : 1.15491),
1.15867 - 1.15491 = 37.6 PIPS,
37.6 + 3 = 40.6
40.6 / 2 = 20.3 PIPS, in this case the value of the day will be 21 PIPS.
Here is the explanation. Since the answer is 20.3, we need to round it to next odd number which is 21. If the answer exactly 21, then that will be the value. If the answer is 22.5, then need to round to the next odd number which is 23
For GOLD Spot (XAUUSD) : 2 decimals
· [ (Yesterday High – Yesterday Low) + 300 PIPS ] / 2 = VALUE of the day
· For example, High : 1769.34 , Low : 1750.73
1769.34 - 1750.73 = 1861 PIPS
1861 + 300 PIPS = 2161
2161 / 2 = 1080.5 PIPS, in this case the VALUE of the day will be 1081 PIPS.
Here is the explanation. Since the answer is 1080.5, we need to round it to next odd number which is 1081. If the answer exactly 1081 then that will be the value. If the answer is 1082.4, then need to round to the next odd number which is 1083
For WTI Cash, Spot Crude Oil : 3 decimals
· [ (Yesterday High – Yesterday Low) + 30 PIPS ] / 2 = VALUE of the day
· For example, High : 81.681 , Low : 79.531
81.681 - 79.531 = 215 PIPS
215 + 30 = 245
245 / 2 = 122.5 PIPS, in this case the value of the day will be 123 PIPS.
Here is the explanation. Since the answer is 122.5, we need to round it to next odd number which is 123. If the answer exactly 123 then that will be the value. If the answer is 124.7, then need to round to the next odd number which is 125
For Index or Indices, for example S&P500 : 1 decimals
· [ (Yesterday High – Yesterday Low) + 30 pips ] / 2 = VALUE of the day
· For example, High : 4416.1 , Low : 4353.6
4416.1 - 4353.6 = 625 PIPS
625 + 30 = 655
655 / 2 = 327.5 PIPS, in this case the value of the day will be 329 PIPS.
Here is the explanation. Since the answer is 327.5, we need to round it to next odd number which is 329. If the answer exactly 329 then that will be the value. If the answer is 328, then need to round to the next odd number which is 329
How the S&R Line works?
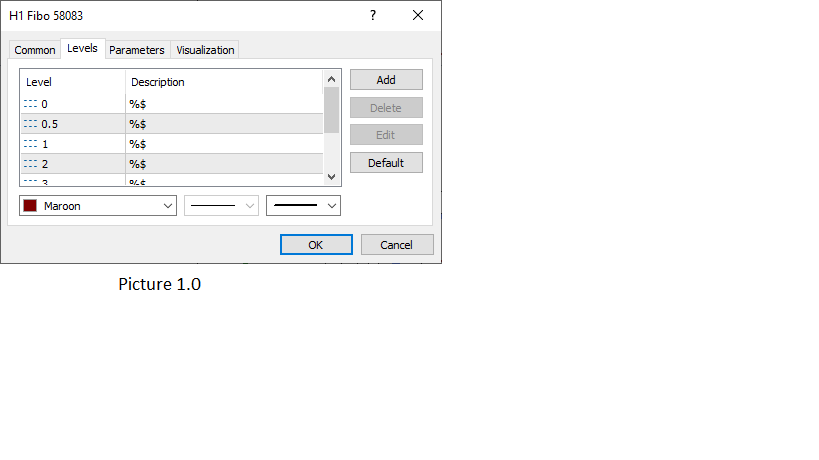
- Actually currently I use Fibonacci but I change the levels to suit my needs so it is for the purpose of Line only. Here are example;
Please refer Picture 1.0
On the Levels section, there sequence will be from 0, 0.5, 1, 2, 3, 4, 5, 6, 7, 8, 9, 10
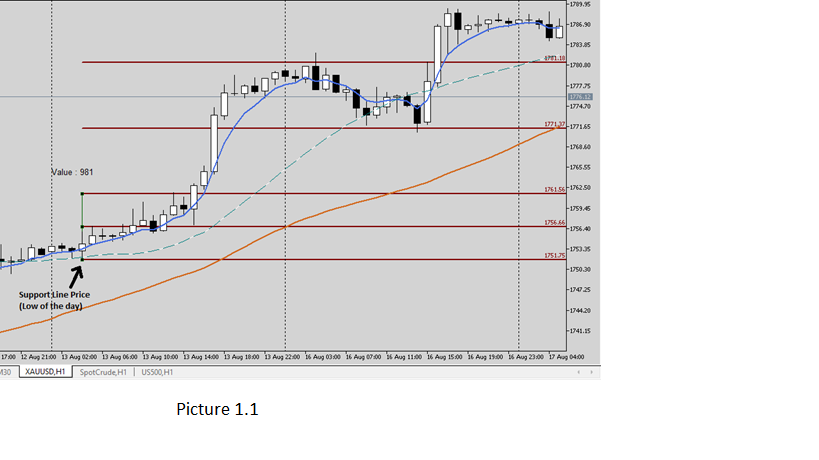
Here are the example during Uptrend;
Please refer Picture 1.1
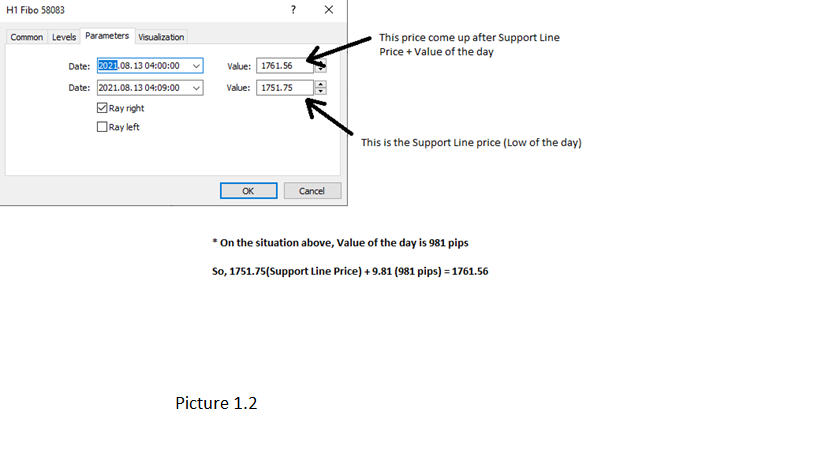
Please refer Picture 1.2
- When in an Uptrend, Base Line is at Low of that particular day and the range of each line to line will be based on VALUE of the day. Only from Base Line 0 to Resistant Line 1, there is a half (0.5).
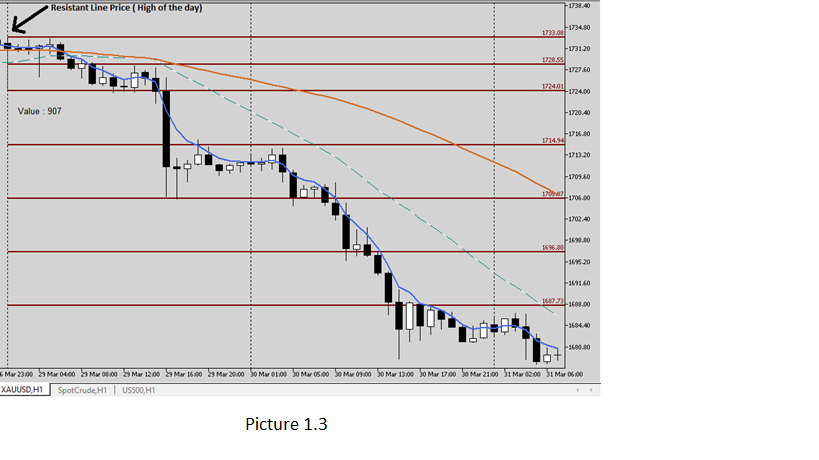
Here are example during Downtrend;
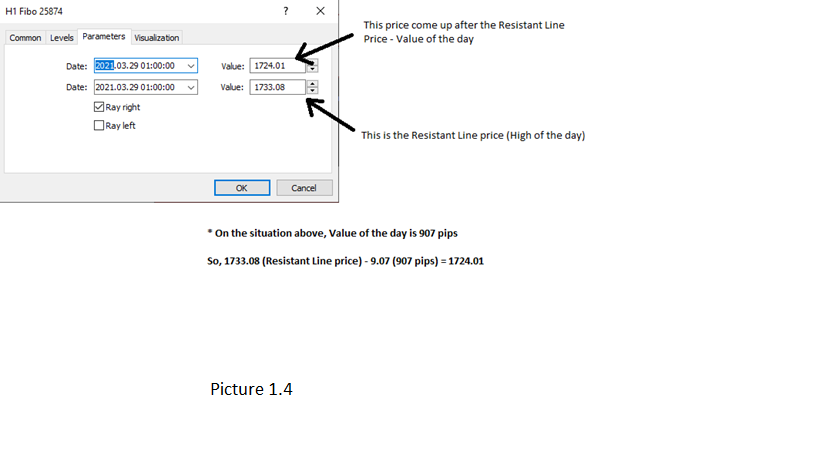
Please refer Picture 1.3
Please refer Picture 1.4
- During Uptrend if the price making new low of the day, the Base Line and the Resistant Line will be keep changing as well. And same during Downtrend if price making new high of the day, the Base Line and the next Support Line will be keep changing as well
- So basically for confirmation of entry, EMA 5 need to cross the S&R line at least 2 pips.
- EMA 5 is the only one act as confirmation. The other 2 of the EMA just for purpose of telling the trend
TREND
Uptrend
- EMA 21 above EMA 55
Downtrend
- EMA 21 below EMA 55
Entry
- Entry only made on the new open candlestick
- Once the EMA 5 cross the S&R Line, entry on next candlestick if all other rules are tick
Buy Entry Rules ;
1. Uptrend
2. EMA 5 cross at least (2 pips for fx, 20 pips for gold/indices/commodity) above Resistant Line
3. Price already touch or nearest EMA 21 (max 5 pips for fx, 50 pips for gold/indices/commodity) on that day
4. During the activation, candlestick is not closed in the black zone(between EMA21 & EMA55)
5. During the activation, EMA5 is not in the black zone(between EMA21 & EMA55)
6. During the activation, the range between high of the candlestick to next S&R line is above 7 pips
7. During the execution, the range between open candlestick to next S&R Line is above 20 pips
8. Not the last candlestick of the day (during monday-thursday)
9. Not the two last candlestick of the day (during friday)
Sell Entry Rules ;
1. Downtrend
2. EMA 5 cross at least (2 pips for fx, 20 pips for gold/indices/commodity) below Support Line
3. Price already touch or nearest EMA 21 (max 5 pips for fx, 50 pips for gold/indices/commodity) on that day
4. During the activation, candlestick is not closed in the black zone(between EMA21 & EMA55)
5. During the activation, EMA5 is not in the black zone(between EMA21 & EMA55)
6. During the activation, the range between high of the candlestick to next S&R line is above (7 pips for fx, 70 pips for gold/indices/commodity)
7. During the execution, the range between open candlestick to next S&R Line is above (20 pips for fx, 200 pips for gold/indices/commodity)
8. Not the last candlestick of the day (during monday-thursday)
9. Not the two last candlestick of the day (during friday)
Exit Rules
1. Take Profit
- Take Profit will be set to (5 pips for fx, 50 pips for gold/indices/commodity) before the S&R Line
* When ENTRY is based on crossover 0.5 s&r line, TP at 1.0 s&r line and SL at 0/base line
* When ENTRY is based on crossover 1.0 s&r line, TP at 2.0 s&r line and SL at 0/base line
* When ENTRY is based on crossover 2.0 s&r line, TP at 3.0 s&r line and SL at 1.0 s&r line
* When ENTRY is based on crossover 3.0 s&r line, TP at 4.0 s&r line and SL at 2.0 s&r line
* When ENTRY is based on crossover 4.0 s&r line, TP at 5.0 s&r line and SL at 3.0 s&r line
2. Stop Loss
- Stop Loss will be set (5 pips for fx, 50 pips for gold/indices/commodity) more than the S&R Line
3. Manual Cut Loss
- When in Buy position during uptrend, the s&r line for downtrend(from high of the day) will be keep observe if there is a crossover which means potential changing of direction
- Same as when in Sell position, the s&r line for uptrend(from low of the day) will be keep observe if there is a crossover which means potential changing of direction
- Example will be show in case study
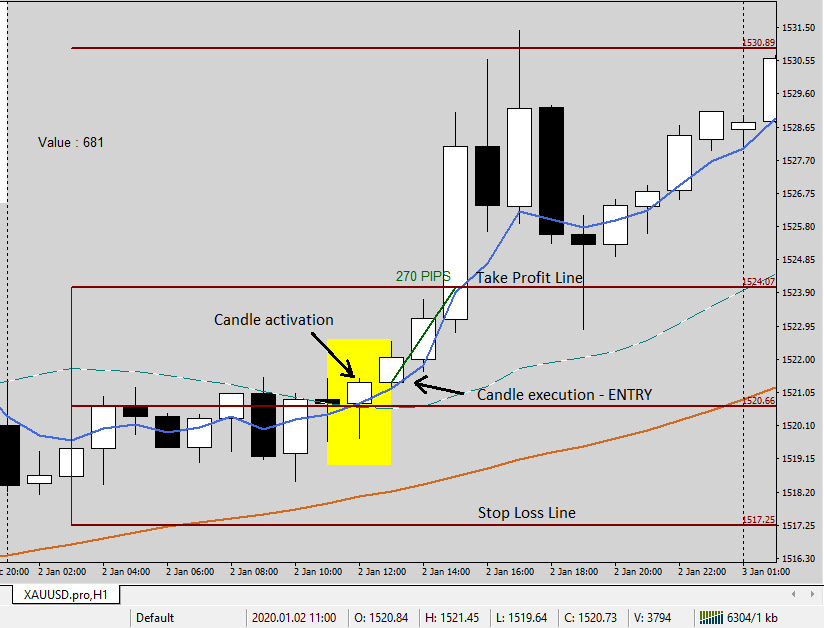
Candlestick Activation = Is when EMA 5 complete cross the S&R Line
Candlestick Execution = Is new candlestick after the candlestick activation (To enter the trade)
Case Study rules
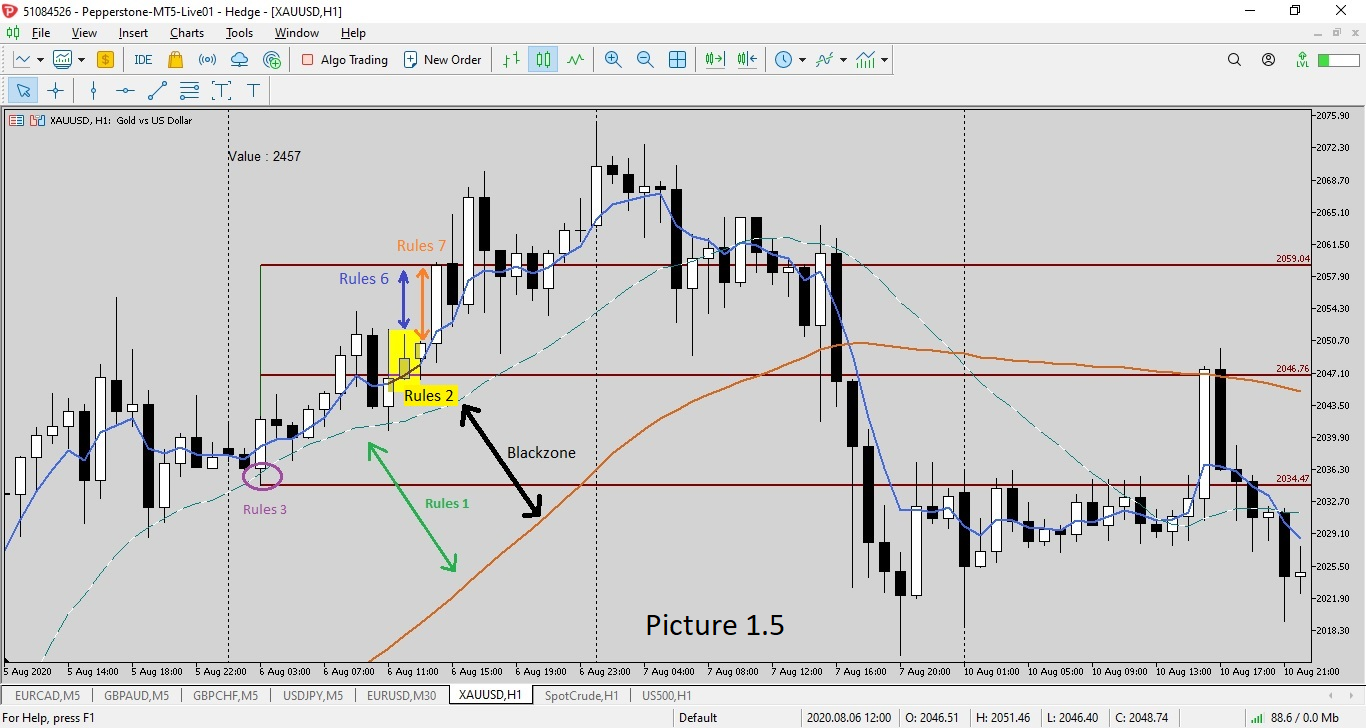
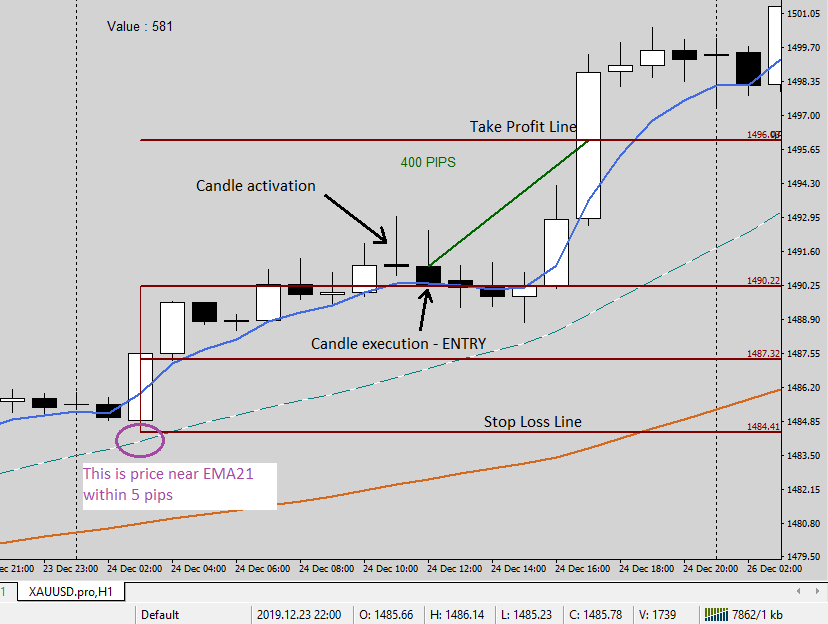
Buy Entry at 0.5 Line – All other rules are tick and correct
Please refer Picture 1.5
Rules;
1. Uptrend – MA21 above MA55
2. EMA5 cross 0.5 s&r line(more than 2 pips)
3. Price already touch MA21 on that day
4. During the activation, candlestick is not closed in the black zone(between EMA21 & EMA55)
5. During the activation, EMA5 is not in the black zone(between EMA21 & EMA55)
6. During the activation, the range between high of the candlestick to next S&R line is above 7 pips
7. During the execution, the range between open candlestick to next S&R Line is above 20 pips
8. Not the last candlestick of the day (during monday-thursday)
9. Not the two last candlestick of the day (during friday)
Case Study rules 2.0
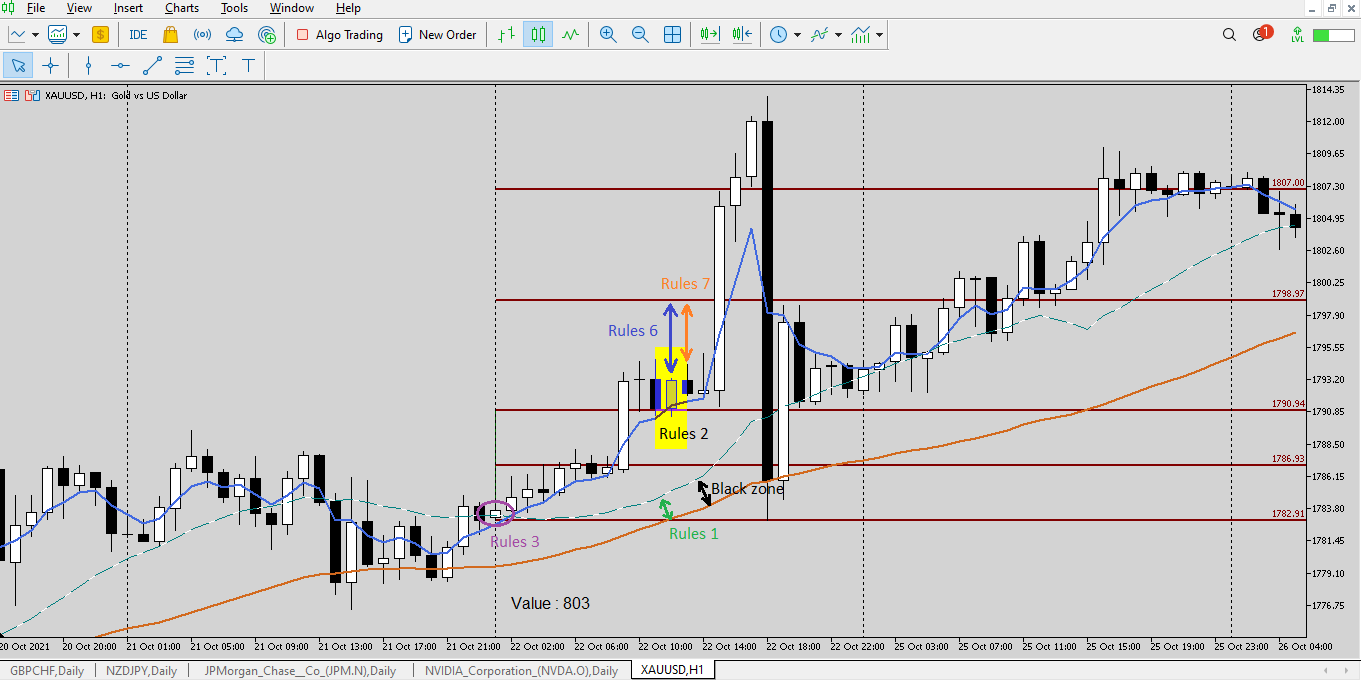
Buy Entry at 1.0 Line – All other rules are tick and correct
Please refer Picture 1.6
Rules;
1. Uptrend – MA21 above MA55
2. EMA5 cross 1.0 s&r line(more than 2 pips)
3. Price already touch MA21 on that day
4. During the activation, candlestick is not closed in the black zone(between EMA21 & EMA55)
5. During the activation, EMA5 is not in the black zone(between EMA21 & EMA55)
6. During the activation, the range between high of the candlestick to next S&R line is above 7 pips
7. During the execution, the range between open candlestick to next S&R Line is above 20 pips
8. Not the last candlestick of the day (during monday-thursday)
9. Not the two last candlestick of the day (during friday)
Case study 1.0
Buy
Entry during crossover 0.5 s&r line
TP at 1.0 s&r line
SL at 0/base line
RESULT = HIT TIP
Please refer Picture 1.7
Case study 2.0
Buy
Entry during crossover 1.0 s&r line
TP at 2.0 s&r line
SL at 0/base line
RESULT = HIT TP
Please refer Picture 1.8
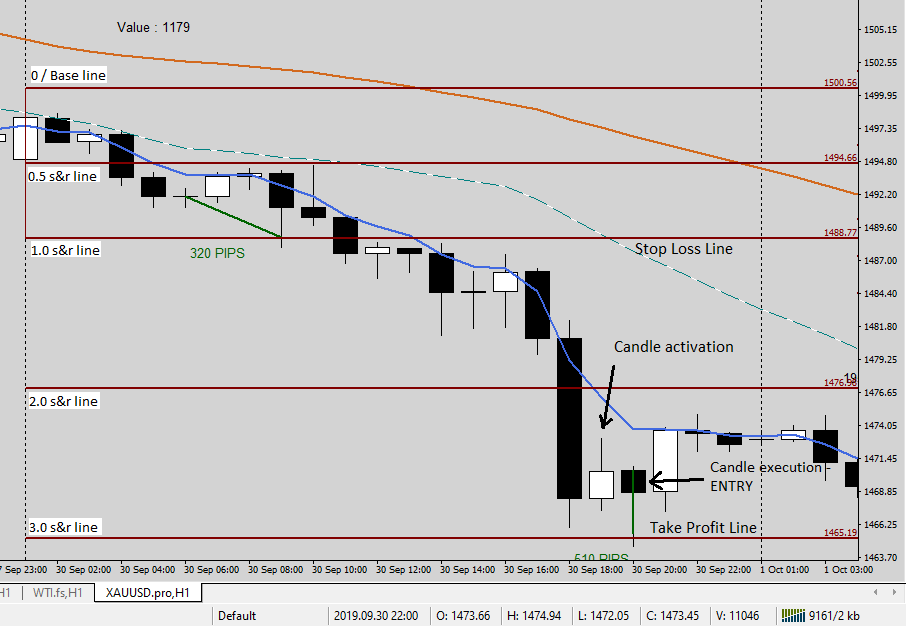
Case study 3.0
SELL
Entry during crossover 2.0 s&r line
TP at 3.0 s&r line
SL at 1.0 s&r line
RESULT = HIT TP
Please refer Picture 1.9
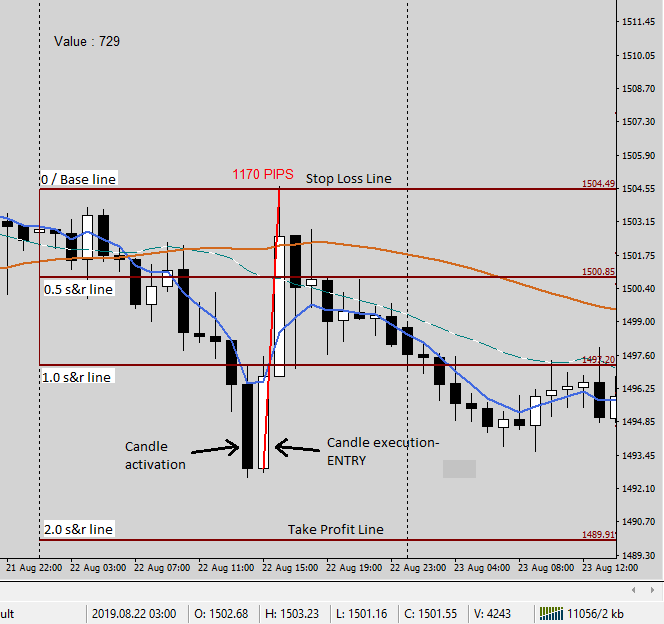
Case study 4.0
SELL
Entry during crossover 1.0 s&r line
TP at 2.0 s&r line
SL at 0/Base line
RESULT = HIT SL
Please refer Picture 2.0
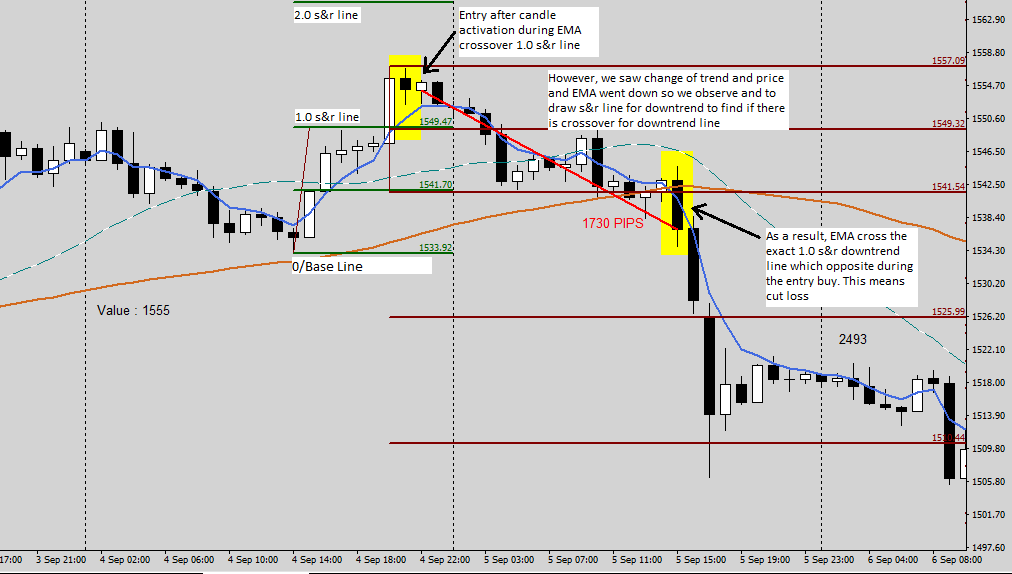
Case study 5.0
SELL
Entry during crossover 1.0 s&r line
TP at 2.0 s&r line
SL at 0/Base line
RESULT = Manual Cut Loss
Please refer Picture 2.1
NOTES FOR MANUAL CLOSE
In Uptrend Situation,
- If candle activation happened at 0.5 s&r line, then it will be cut loss when EMA 5 cross any of s&r downtrend line
- If candle activation happened at 1.0 s&r line, then it will be cut loss when EMA 5 cross 1.0 downtrend line
- If candle activation happened at 2.0 s&r line, then it will be cut loss when EMA 5 cross 1.0 downtrend line
- If candle activation happened at 3.0 s&r line, then it will be cut loss when EMA 5 cross 1.0 downtrend line
- If candle activation happened at 4.0 s&r line, then it will be cut loss when EMA 5 cross 1.0 downtrend line
And continuously
In Downtrend situation,
- If candle activation happened at 0.5 s&r line, then it will be cut loss when EMA 5 cross any of s&r uptrend line
- If candle activation happened at 1.0 s&r line, then it will be cut loss when EMA 5 cross 1.0 uptrend line
- If candle activation happened at 2.0 s&r line, then it will be cut loss when EMA 5 cross 1.0 uptrend line
- If candle activation happened at 3.0 s&r line, then it will be cut loss when EMA 5 cross 1.0 uptrend line
- If candle activation happened at 4.0 s&r line, then it will be cut loss when EMA 5 cross 1.0 uptrend line
And continuously
Please note that;
UPTREND means the 0/Base line is at the LOW price of the day
DOWNTREND means the 0/Base line is at the HIGH price of the day
- IF the position carry forward to next day or the day after, the HIGH or LOW for the 0/Base line is determine on HIGH and LOW price since the day of ENTRY position.