 MetaTrader 5
 Experts
 지표
지표
 스크립트
스크립트
 라이브러리
라이브러리
 보관함
보관함
당사 팬 페이지에 가입하십시오
- 조회수:
- 15
- 평가:
- 게시됨:
-
 이 코드를 기반으로 한 로봇이나 지표가 필요하신가요? 프리랜스로 주문하세요
프리랜스로 이동
이 코드를 기반으로 한 로봇이나 지표가 필요하신가요? 프리랜스로 주문하세요
프리랜스로 이동

거의 모든 구조 기반 분석 기법은 동일한 질문에서 출발합니다. 바로 ‘어떤 고점과 저점이 실제로 중요한가? ’라는 질문입니다. 시장 구조, BOS 및 CHoCH, 주문 블록, 유동성 수준 등 그 이후의 모든 분석은 이 한 가지 답을 바탕으로 이루어지므로, 어떤 정의를 선택하느냐에 따라 나머지 분석 결과의 방향이 결정됩니다.
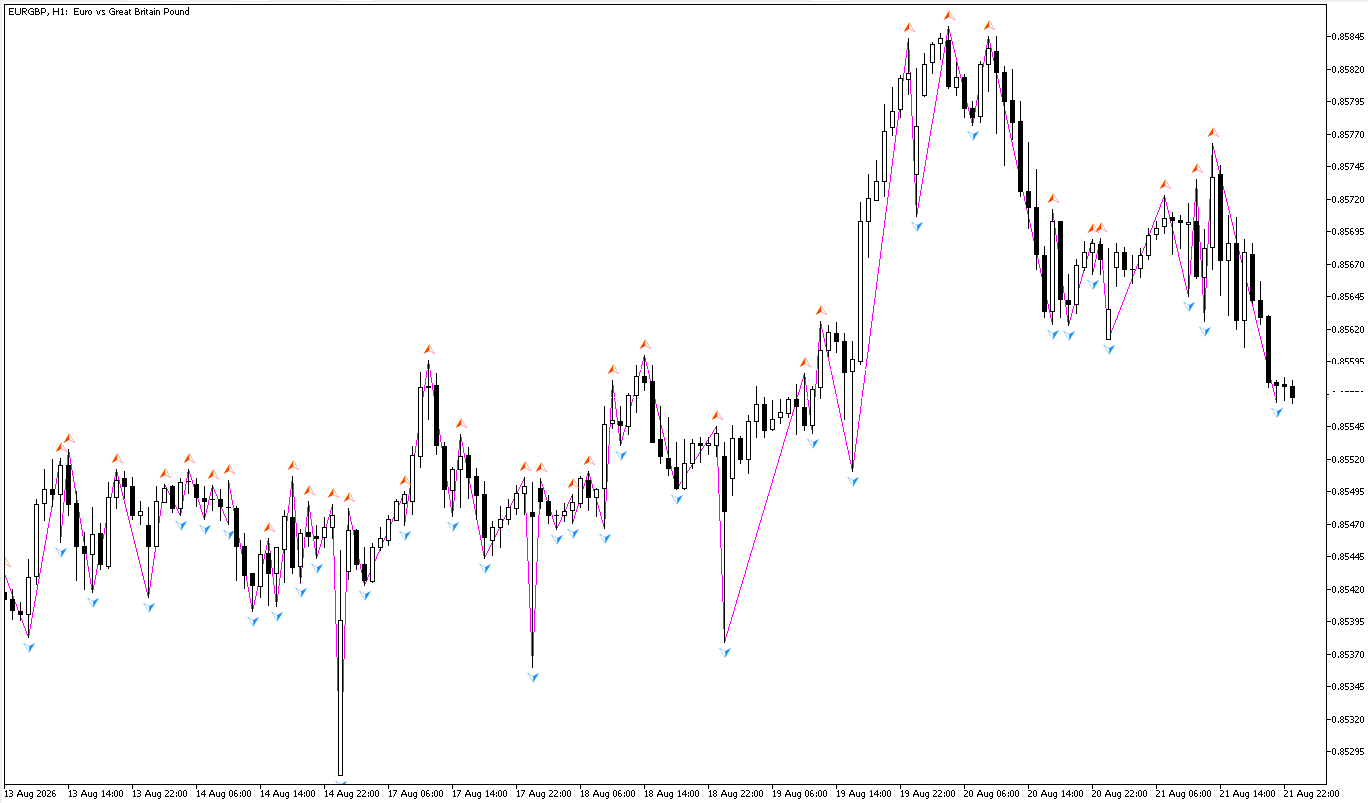
이에 대한 답을 찾는 몇 가지 일반적인 방법이 있다. 가장 잘 알려진 방법은 3캔들 패턴 (프랙탈)입니다. 즉, 고점이 양쪽 인접 캔들보다 높은 캔들은 스윙 고점으로 간주합니다. 이 방법은 대칭적이며 계산이 매우 간단하고, 대부분의 스윙 지표에서 사용됩니다. 다른 방법들은 분석 창을 5개 또는 7개 캔들로 넓히거나, 최소 포인트 변동폭이나 ATR을 기준으로 후보를 필터링하기도 합니다.
이 지표는 다른 정의, 즉 Trading Hub 3.0에서 사용되는 ‘풀백(pullback)’ 정의를 사용합니다. 캔들이 인접한 캔들보다 더 높은지 묻는 대신, 가격이 되돌아와 해당 캔들을 거부했는지 여부를 묻습니다. 고점은 시장이 그 고점을 형성한 캔들의 저점을 다시 통과해야만 스윙 고점이 됩니다. 형태에 따라 결정되는 것은 없으며, 모든 것은 그 후 가격의 움직임에 따라 결정됩니다.
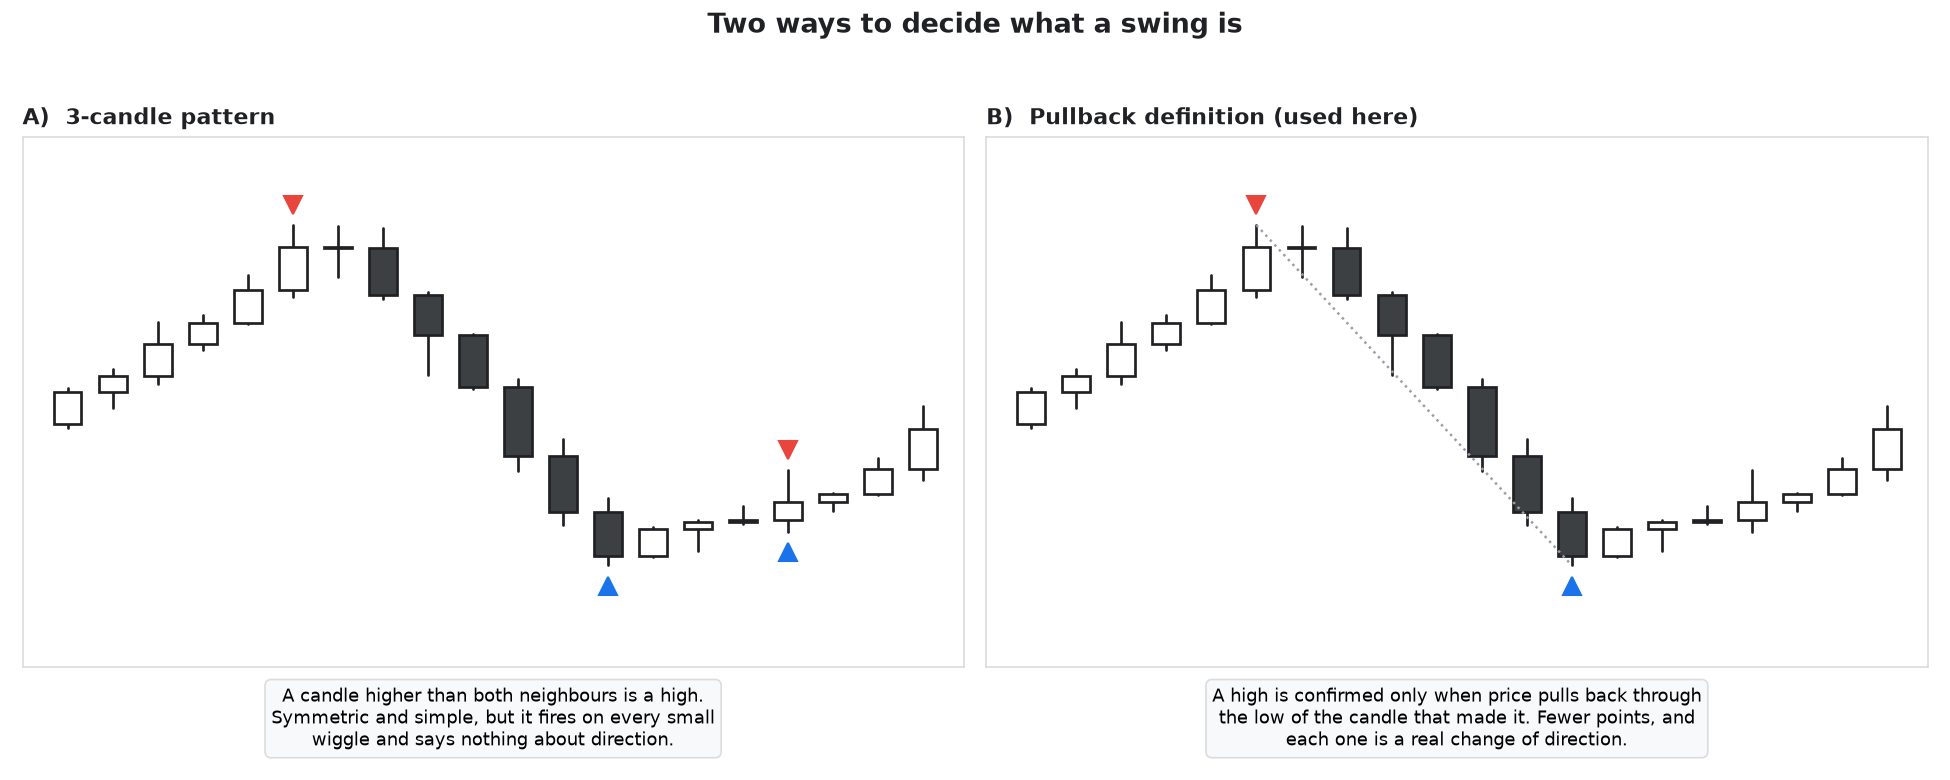
실질적인 차이점은 다음과 같습니다. 프랙탈은 기하학적 구조를 설명하는 반면, 풀백은 특정 사건을 설명합니다. 풀백은 사건이기 때문에 스윙이 언제 유효해졌는지도 알려주며, 바로 그 타임스탬프 덕분에 리페인팅이 발생하지 않는 구현이 가능해집니다.
규칙의 작동 방식
탐지기는 양쪽을 동시에 찾지 않습니다. 한 번에 한쪽만 검색하며, 정확히 세 가지 정보를 보유합니다:
| 상태 | 의미 |
|---|---|
| 방향 | 현재 어느 쪽을 탐색 중인지 — 높음(high) 또는 낮음(low) |
| 추적된 극값 | 현재 추세의 구간에서 지금까지 기록된 최고 고점(또는 최저 저점) |
| 기준선 | 해당 극값을 형성한 캔들의 반대쪽 끝 |
기준이 중요한 부분입니다. 캔들이 새로운 최고 고점을 기록하면, 그 캔들 자체가 나중에 이를 확인시켜 줄 수준, 즉 그 캔들의 저점을 제공하게 됩니다. 고점이 유효하게 인정되려면 가격이 그 저점을 다시 하향 돌파해야 합니다.
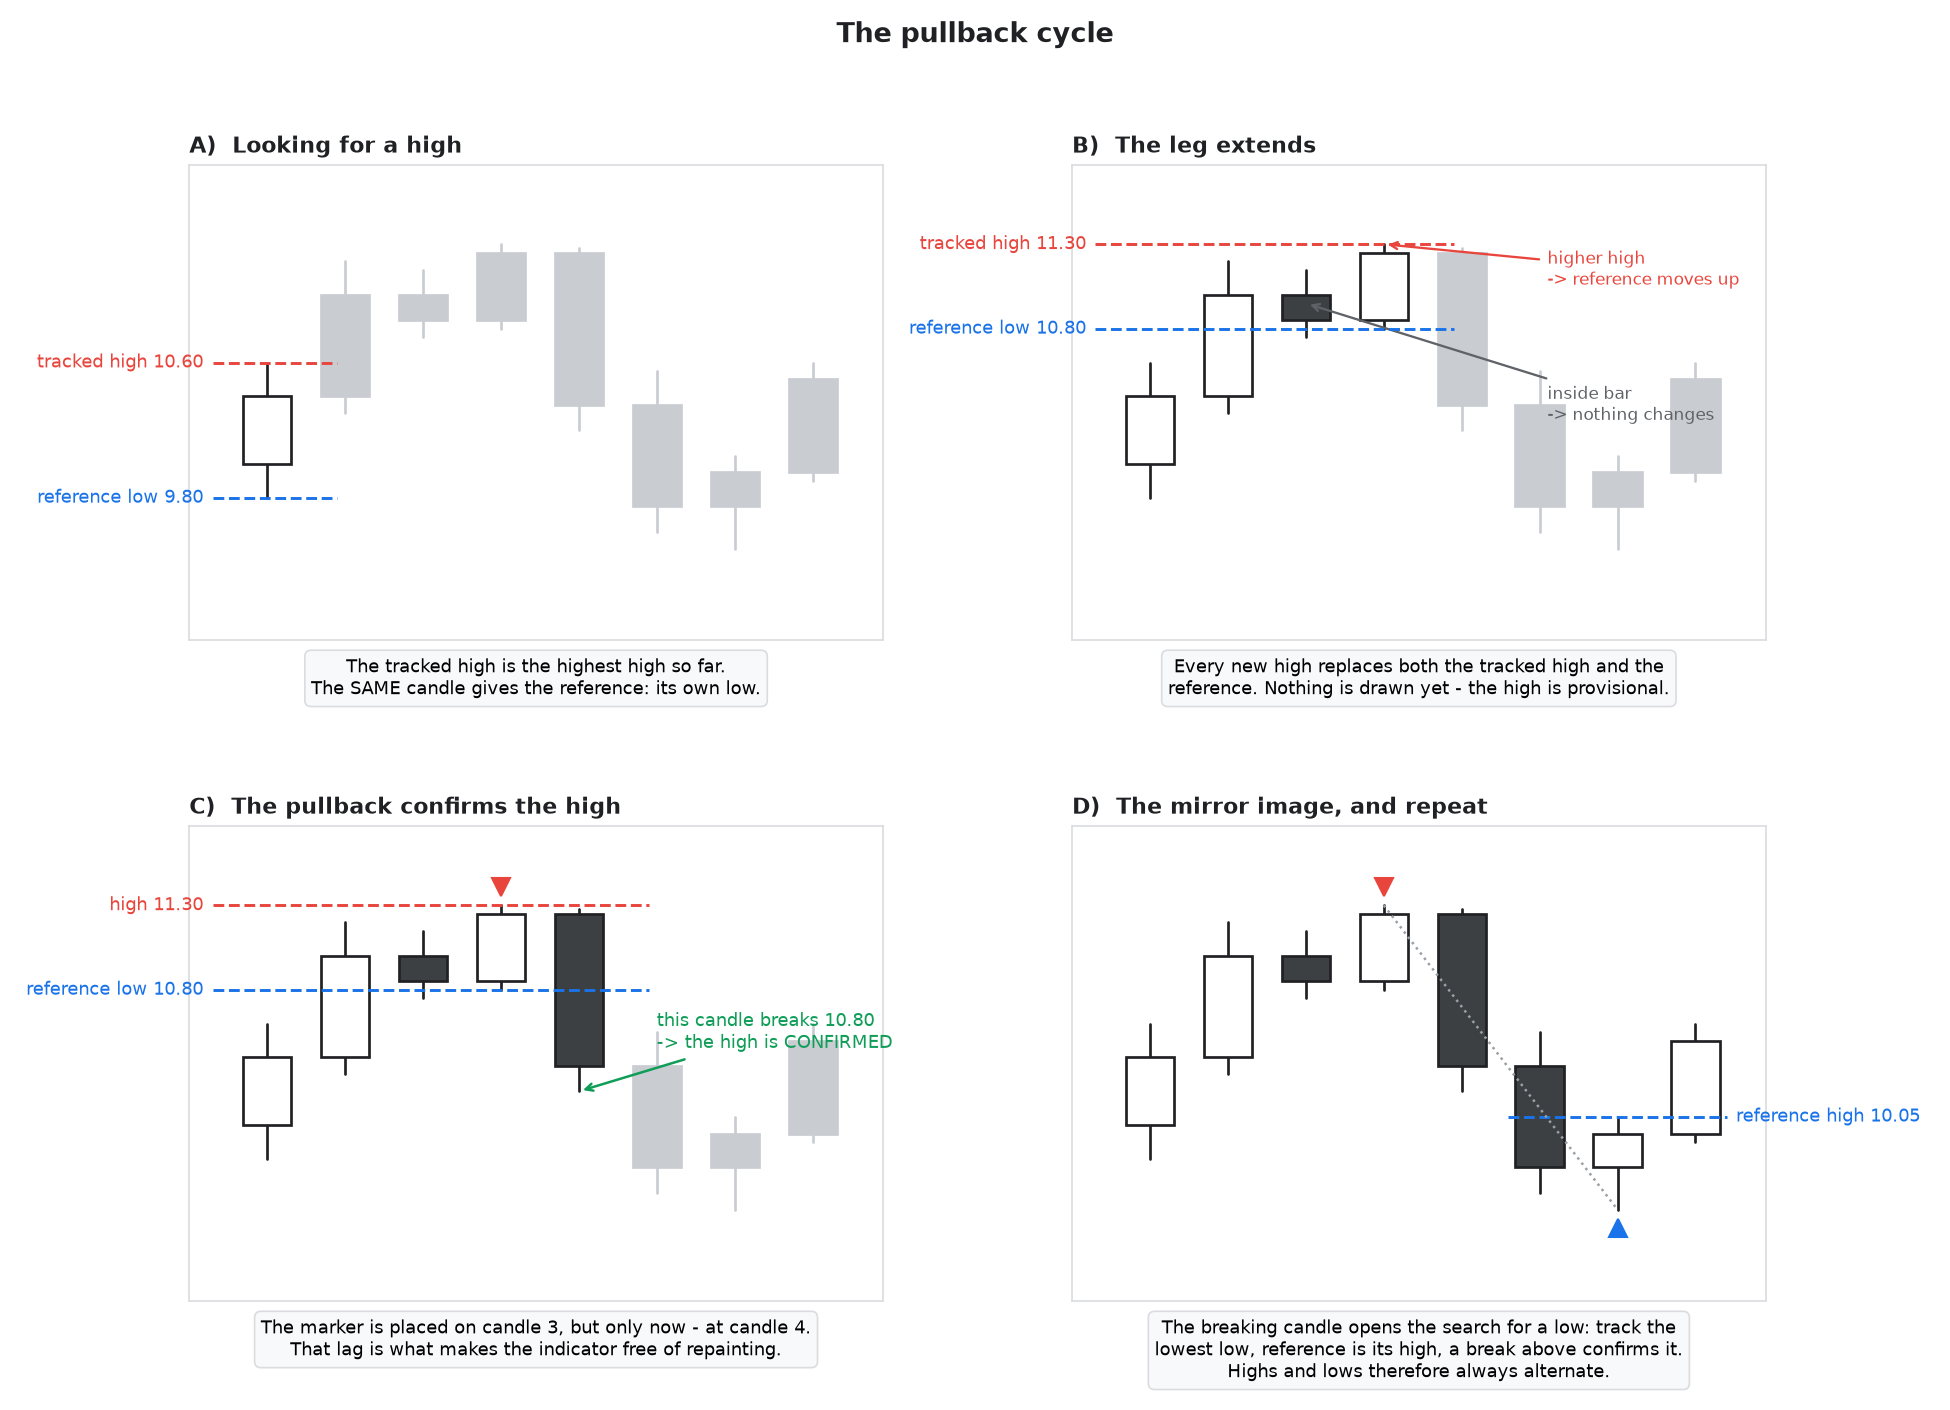
그림 해석:
- A — 추세가 시작됩니다. 추적된 고점과 기준 저점은 모두 하나의 캔들에서 나옵니다.
- B — 더 높은 고점이 형성될 때마다 두 값이 모두 대체됩니다. 이 고점은 여전히 잠정적이며, 아무것도 표시되지 않습니다.
- C — 캔들이 마침내 기준 저점 아래에서 거래됩니다. 이것이 조정 국면이며, 추적된 고점을 스윙 고점으로 확정합니다.
- D — 확인 캔들이 즉시 저점 탐색을 시작하며, 이는 대칭적으로 진행됩니다: 가장 낮은 저점을 추적하고, 기준은 그 고점이며, 이를 상향 돌파하면 확인됩니다.
한쪽이 확인되면 탐색 방향이 항상 반대쪽으로 전환되기 때문에, 스윙 고점과 저점은 자동으로 번갈아 나타납니다. 이를 강제하는 별도의 규칙도 없고, 이전 스윙과의 비교도 없습니다.
캔들별 규칙
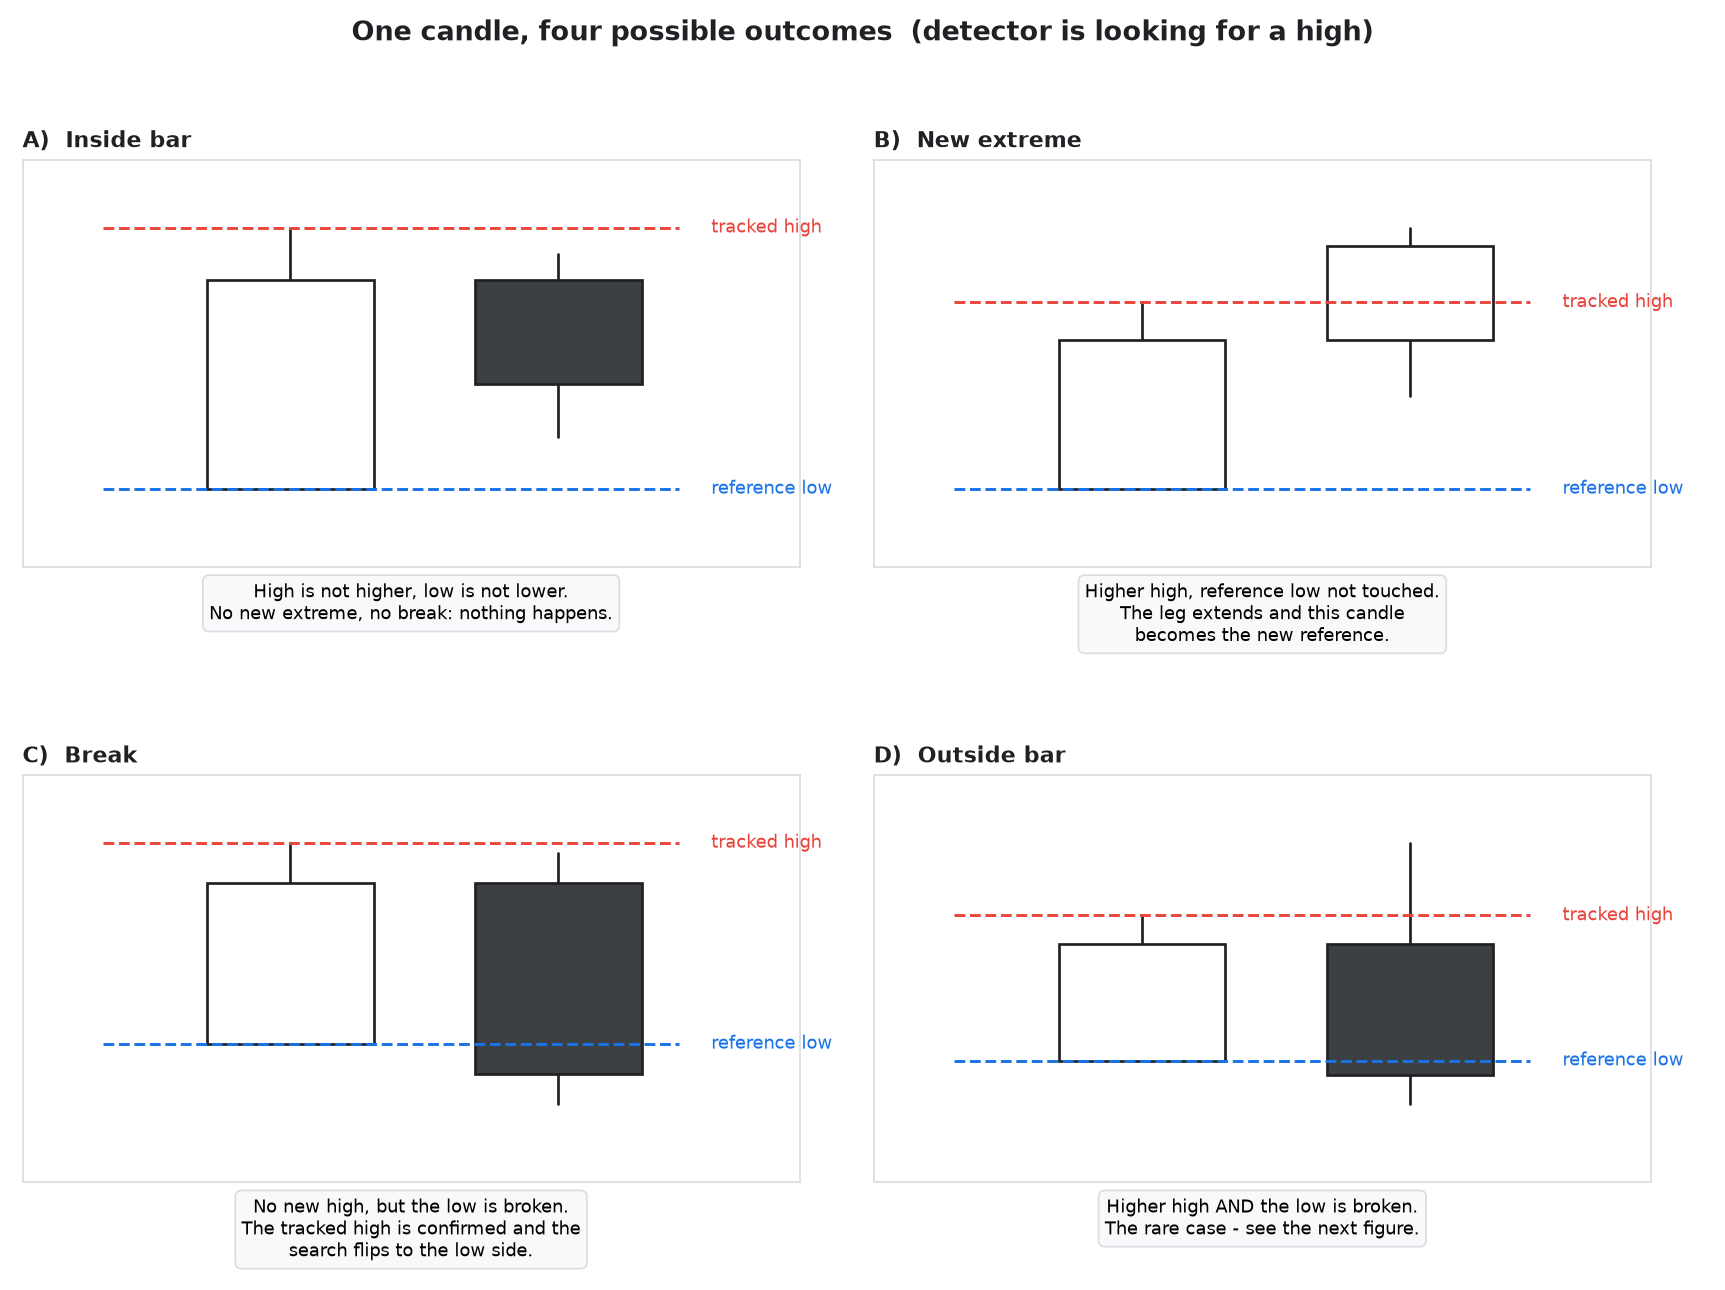
매 종가 캔들마다 감지기는 두 가지 독립적인 질문을 던집니다: 이 캔들이 새로운 극값을 기록했는가? 그리고 기준선을 돌파했는가? 방향당 네 가지 조합이 가능합니다.
| # | 현재 추세 | 현재 캔들 | 조치 1 | 조치 2 |
|---|---|---|---|---|
| 1 | 고점 확인 | 인사이드 바 — 새로운 고점 없음, 기준 저점 유지 | 없음 | 없음 |
| 2 | 고점을 주목 | 신고가, 기준 저점 유지 | 추적 고점 = 이 캔들의 고점 | 기준 저점 = 이 캔들의 저점 |
| 3 | 고점 확인 중 | 돌파 — 새로운 고점은 아니지만 기준 저점 아래에서 거래됨 | 추적된 고점을 스윙 고점으로 확인 | 저점으로 전환: 추적된 저점 = 해당 캔들의 저점, 기준 고점 = 해당 캔들의 고점 |
| 4 | 고점 확인 | 아웃사이드 바 — 새로운 고점을 기록하고 기준 저점을 돌파함 | 이 캔들의 고점을 스윙 고점으로 확인 | LOW로 전환: 추적 최저가 = 해당 캔들의 최저가, 기준 최고가 = 해당 캔들의 최고가 |
| 5 | 저점을 찾습니다 | 인사이드 바 — 새로운 저점 없음, 기준 고점 유지 | 없음 | 없음 |
| 6 | 저점을 찾고 있음 | 신저가 발생, 기준 고가 유지 | 추적된 저점 = 이 캔들의 저점 | 기준 고점 = 해당 캔들의 고점 |
| 7 | 저점을 찾고 있습니다 | 돌파 — 새로운 저점은 아니지만, 기준 고점 위에서 거래됨 | 추적된 저점을 스윙 저점으로 확인 | 고점으로 전환: 추적된 고점 = 해당 캔들의 고점, 기준 저점 = 해당 캔들의 저점 |
| 8 | 저 점을 찾음 | 아웃사이드 바 — 새로운 저점을 기록하고 기준 고점을 돌파 | 이 캔들의 저점을 스윙 저점으로 확인 | HIGH로 전환: 추적된 고점 = 해당 캔들의 고점, 기준 저점 = 해당 캔들의 저점 |
1~4행과 5~8행은 정확히 대칭을 이루므로, 전체 코드가 불과 수십 줄에 불과합니다.
드문 경우: 양방향 모두를 돌파하는 캔들
4행과 8행은 별도의 설명이 필요합니다. 보통 캔들은 추세를 연장하거나 기준선을 돌파합니다. 아웃사이드 바는 두 가지를 동시에 수행할 수 있습니다 — 같은 캔들 내에서 새로운 고점을 형성하고 기준 저점 아래에서 거래되는 것입니다.
이 경우 두 규칙 모두 해당 캔들을 적용 대상으로 주장하게 되며, 서로 모순됩니다. 이를 ‘연장’으로 간주하면 실제 돌파를 놓치게 되고, ‘돌파’로 간주하면 바로 이 캔들이 이미 넘어선 고점을 다시 확인하게 됩니다.
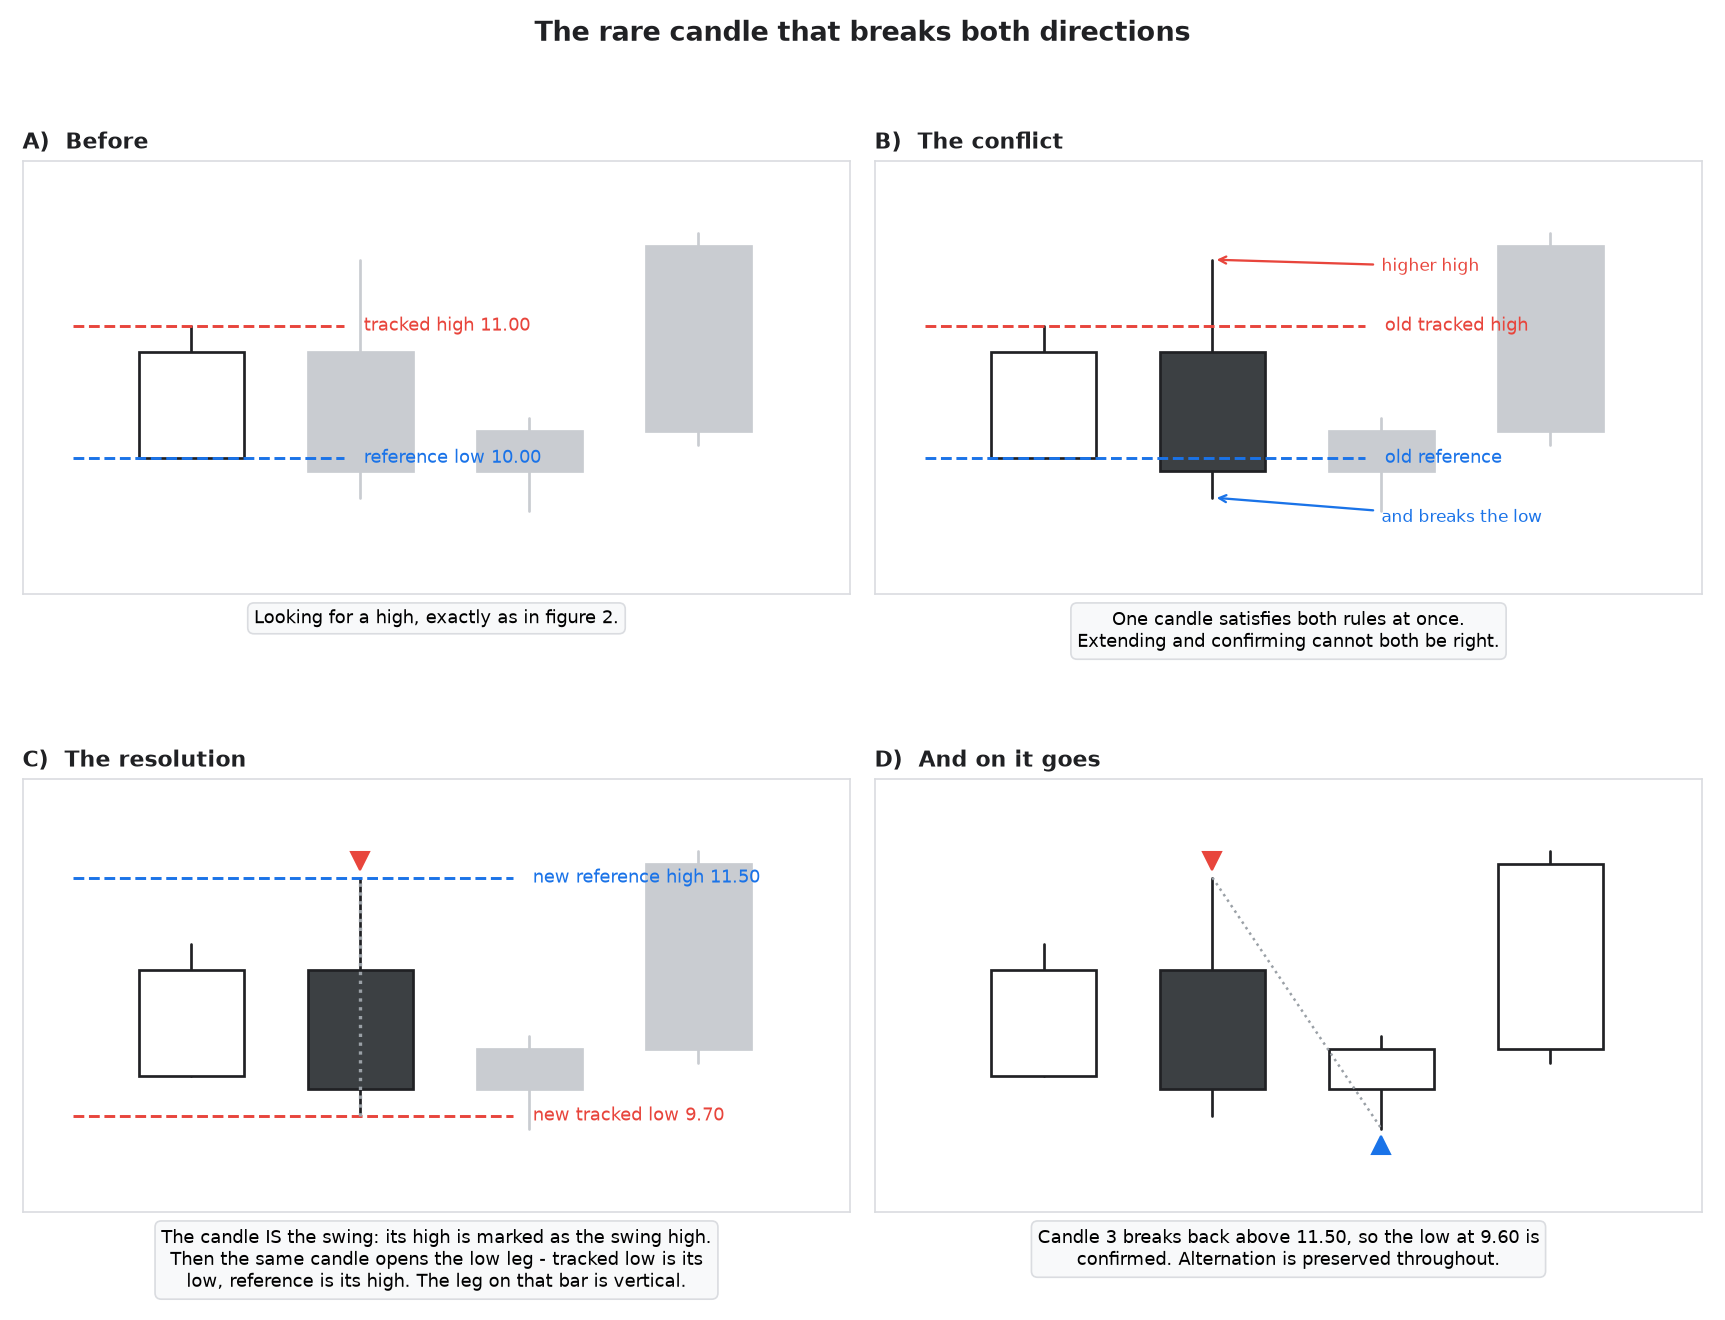
해결책은 해당 캔들 자체를 스윙으로 간주하는 것입니다:
- 해당 캔들의 고점이 스윙 고점으로 확정되는 것입니다. 방금 돌파한 이전의 추적 고점이 아닌, 바로 그 캔들 자체의 고점이 스윙 고점이 되는 것입니다.
- 그러면 같은 캔들이 반대 방향의 움직임을 시작합니다: 추적되던 저점이 이 캔들의 저점이 되고, 기준 저점이 이 캔들의 고점이 됩니다.
따라서 하나의 캔들이 스윙 고점과 하락 추세의 시작을 모두 담게 됩니다. 차트상에서는 동일한 바의 상단과 하단에 마커가 표시되고, 그 사이에 수직 선이 그려지는 형태로 나타납니다. 이는 바로 그 캔들 내부에서 일어난 현상과 정확히 일치합니다.
This is also why the legs are drawn as trend-line objects rather than a DRAW_SECTION buffer. A section plot stores one value per bar and could not hold two points on the same candle.
재표시되지 않습니다
추적된 극값은 잠정적이며 절대 그려지지 않습니다. 스윙은 이를 확인하는 캔들에서만 차트에 기록되며, 일단 기록되면 절대 이동되거나 색상이 변경되거나 제거되지 않습니다. 마감된 캔들만 평가되며, 형성 중인 캔들은 완전히 무시됩니다.
이에 따른 타협점은 명확하며 언급할 가치가 있습니다. 바로 ‘확인 지연’입니다. 가장 최근의 스윙은 이를 검증하는 돌파가 발생한 후에야 나타납니다. 새로운 고점이 형성되는 순간 바로 마커를 표시하고 싶다면, 이 도구는 적합하지 않습니다. 그런 마커는 나중에 이동해야 할 것이며, 이는 리페인팅에 해당하기 때문입니다.
입력값
탐지
| 입력 | 기본값 | 기능 설명 |
|---|---|---|
| 다음부터 확인하세요 | 스윙 고점을 찾습니다 | 가장 첫 번째 레그가 어느 쪽을 탐색하는지 확인합니다. 이 설정은 차트에서 가장 오래된 바에만 영향을 미치며, 첫 번째 확인 이후 방향은 전적으로 돌파에 의해 결정됩니다. 기록상 첫 번째 스윙이 잘못된 것으로 보이지 않는 한 이 설정을 그대로 두십시오. |
| 다음에 의해 돌파가 확인됨 | 윅 | ‘윅(Wick)’은 캔들의 고가/저가를 사용하며, 이는 트레이딩 허브(Trading Hub)의 문자 그대로의 규칙이자 더 민감한 설정입니다. ‘종가(Close)’는 캔들이 기준선을 돌파한 상태로 마감해야 하므로, 단일 윅에 의한 일시적인 접촉은 무시하고 눈에 띄게 적은 수의 더 큰 스윙을 제공합니다. |
선택 방법: 위크(Wick) 로 시작하세요. M1~M15 시간대를 사용하거나, 금이나 지수 CFD처럼 길고 잡음이 많은 윅이 나타나는 종목을 거래하는 경우, 클로즈 ( Close )로 전환하세요. 이는 다른 논리를 변경하지 않으면서도 단일 스파이크로 인한 스윙의 대부분을 제거해 줍니다. 더 큰 시간대를 사용하는 것도 더 큰 구조를 파악하는 또 다른 방법입니다. 이 규칙 자체에는 조정할 수 있는 민감도나 기간 설정이 없습니다.
표시
| 입력 | 기본값 | 기능 |
|---|---|---|
| 스윙 마커 그리기 | true | 화살표를 표시하거나 숨깁니다. 어느 쪽이든 버퍼는 채워진 상태를 유지하므로, iCustom은 여전히 매 스윙마다 반환됩니다. |
| 화살표 코드 — 스윙 하이 / 로우 | 217 / 218 | Wingdings 코드입니다. 일반적으로 사용되는 대체 코드:234/233,241/242, 점 표시용 159. |
| 막대와의 화살표 간격 | 10 | 캔들과 화살표 사이의 픽셀 단위 간격. 차트 밀도가 높은 경우 이 값을 늘리세요. |
| 스윙 사이의 다리 그리기 | true | 연속된 스윙을 연결하는 점선 지그재그. 이미 지그재그를 표시하고 있다면 이 기능을 끄십시오. |
| 선 색상 / 스타일 / 두께 | 은색, 점선, 1 | 선 모양. |
마커와 선을 모두 비활성화하면 순수한 계산 인스턴스만 남게 됩니다. EA가 버퍼를 읽을 때 차트에 아무것도 표시되지 않게 하려는 경우에 유용합니다.
알림
| 입력 | 기본값 | 기능 |
|---|---|---|
| 확인된 스윙 시 팝업 알림 | false | 스윙이 확인되면 터미널에 팝업이 표시됩니다. |
| 스윙이 확인되면 푸시 알림이 전송됩니다. | false | '도구 → 옵션 → 알림'에서 설정된 MetaQuotes ID로 푸시 알림이 전송됩니다. |
알림은 실시간 업데이트 시에만 발생하며, 지표가 이력을 불러오는 동안에는 발생하지 않고 스윙당 한 번만 발생합니다.
EA에서 사용하는 방법
두 개의 버퍼가 있으며, 둘 다 확인된 스윙 시에만 비어 있지 않습니다(비어 있는 값은 0.0):
| 버퍼 | 내용 |
|---|---|
| 0 | 확인된 스윙 고점 의 가격 |
| 1 | 확정된 스윙 저점 의 가격 |
int h = iCustom(_Symbol, _Period, "SMC_Pullback");
double buf[];
CopyBuffer(h, 0, 0, 100, buf);   // 스윙 고점
이 감지 엔진은 차트나 버퍼에 의존하지 않는 독립적인 단일 클래스인 CPullbackDetector에 포함되어 있습니다. 이 클래스는 가격 배열을 받아 확인된 스윙을 보고하므로, iCustom을 거치지 않고 바로 EA에 복사하여 사용할 수 있습니다.
의도적으로 수행하지 않는 기능
이 인디케이터는 스윙 지점에서만 작동합니다. HH/HL/LH/LL을 표시하지 않으며, BOS, CHoCH, IDM, 주문 블록 또는 유동성 레벨을 도출하지도 않습니다. 이러한 작업들은 먼저 신뢰할 수 있는 스윙 데이터 세트가 필요한 별도의 단계이며, 바로 이것이 이 인디케이터가 제공하는 것입니다.
이 프로젝트는 MQL5 Algo Forge에서 지원됩니다. 아래 링크에서 코드와 향후 업데이트를 확인하실 수있습니다 .
저장소는 여기입니다: https://forge.mql5.io/SandroBegashvil/SMC-Pullback-CodeBase
MetaQuotes Ltd에서 영어로 번역함.
원본 코드: https://www.mql5.com/en/code/76451
 One-Click Trade Manager — risk-based lot size with entry, stop and target in one click
Works out the lot from your risk percent and the stop distance, then opens the trade with the stop loss and take profit already attached. Never trades by itself.
RegimeRouter — trend/range classifier with a per-regime win rate ledger
Classifies the market with ADX, the Hurst exponent and lag-1 autocorrelation, routes each bar to a breakout module or a mean-reversion module, and keeps a separate win rate ledger for each regime with a Wilson 95% lower bound, so you can see which half of it is actually working.
PropFirm Equity Protector - 기관용 리스크 관리자 (오픈 소스)
프로프 펌의 리스크 관리를 위한 전문 유틸리티 EA입니다. 이 제품은 일일 순자산 모니터링, 손실 포지션에 대한 단계적 손실 제한, 그리고 자가 복구 기능이 탑재된 그래픽 대시보드를 통한 절대적인 강제 청산 기능을 제공합니다.
 Session Candle Counter: candles numbered from the cash open, DST aware
Numbers every candle of the current trading day starting at the cash open of Frankfurt, London, New York or Tokyo. The anchor is converted from exchange local time to broker server time with automatic daylight saving, so the first candle after the open is always number one, in summer and in winter.