 MetaTrader 5
 Experts
 지표
지표
 스크립트
스크립트
 라이브러리
라이브러리
 보관함
보관함
당사 팬 페이지에 가입하십시오

Footprint XRay (Order Flow Volume Delta) - MetaTrader 5용 지표

- 조회수:
- 41
- 평가:
- 게시됨:
- 업데이트됨:
-
 이 코드를 기반으로 한 로봇이나 지표가 필요하신가요? 프리랜스로 주문하세요
프리랜스로 이동
이 코드를 기반으로 한 로봇이나 지표가 필요하신가요? 프리랜스로 주문하세요
프리랜스로 이동

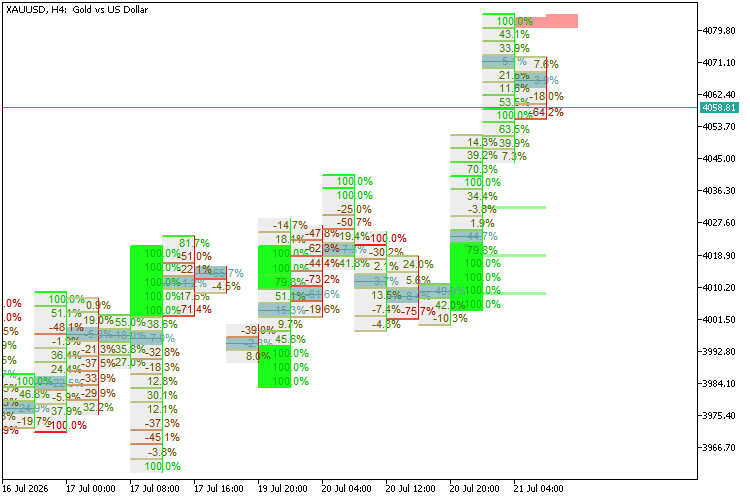
Pine Script에서 MQL5로 이식된 기관급 주문 흐름 및 풋프린트 차트 지표입니다.
이 지표는 하위 시간대(LTF)의 과거 틱/실제 거래량을 활용하여 주요 시간대의 바를 동적으로 분해하고, 각 가격 수준에서 매수/매도 거래량 차이를 계산합니다.
이 지표는 자동 시간대 선택, POC(Point of Control) 강조 표시, 누적 불균형 기능을 제공합니다.
극단적인 흡수 감지, 실시간 완화 기능을 갖춘 미결제 물량(UB) 추적, 실시간 알림 트리거 기능을 제공합니다.
주요 기능:
-
동적 열 너비: 풋프린트 셀은 MT5의 차트 확대/축소 비율에 따라 가로 크기를 자동으로 조정하여 간격을 유지합니다.
-
자동 크기 조정 글꼴 엔진:확대 비율이 낮을수록 텍스트 글꼴 크기가 자동으로 축소되며, 가독성을 넘어 확대했을 때는 깔끔하게 숨겨집니다.
-
배경 캔들 표시/숨기기:원래의 배경 캔들을 숨겨 깔끔한 주문 흐름 레이아웃을 제공하며, 지표가 제거되면 안전하게 시각적 상태를 복원합니다.
-
성능 최적화:CPU 부하 및 UI 멈춤 현상을 방지하기 위해 사용자 정의 룩백(lookback) 창으로 계산 범위를 제한합니다 .
-
종료된 봉 알림:틱별 알림 스팸을 방지하기 위해 완료된 봉을 기준으로 신호를 평가합니다.
사용자용 간단한 가이드
1. 설치
-
MetaTrader 5 터미널을 엽니다.
-
F4 키를눌러 MetaEditor를엽 니다 .
-
왼쪽의 네비게이터 트리에서 ‘지표(Indicators)’ 폴더를 마우스 오른쪽 버튼으로클릭하고 ‘새 파일( New File)’을 선택합니다.
-
'사용자 정의 지표'를선택하고 이름을'FootPrint_X_Ray'로 지정한 후, 완료될 때까지 '다음'을 클릭합니다.
-
컴파일된.mq5 코드 전체를작업 영역에붙여넣어기존 코드를 모두 덮어씁니다.
-
상단의 '컴파일' 버튼을 클릭하세요.
-
MetaTrader 5로 돌아가서내비게이터의 '지표(Indicators)' 폴더에서 FootPrint_X_Ray를찾아차트로 드래그합니다.
2. 모범 사례 및 세부 조정
-
기본 MT5 캔들 숨기기:가장 깔끔한 시각적 레이아웃을 위해 ‘Hide Background Candles’를true로 설정해 두십시오.
-
이렇게 하면 기본 캔들이 숨겨지므로 풋프린트 셀에만 집중할 수 있습니다.
-
지표를 차트에서 분리하면 기본 차트 템플릿 색상이 안전하게 복원됩니다.
-
열 간격 조정:모니터에서 열이 너무 얇거나 두껍게 보이면 ‘Width Spacing Multiplier’ 매개변수를 사용하세요.
-
이 값을0.80으로설정하면상자가 약간 압축되고 ,1.20으로설정하면상자가 확장됩니다 .
-
글꼴 가독성:숫자가 너무 작거나 겹치는 경우 ,'기본 풋프린트 글꼴 크기 ( 기본값8)'를 조정하십시오.
-
계산 제한: 이 지표는기본적으로 가장 최근 25개의 막대에 풋프린트를 그릴 수 있도록 최적화되어 있습니다.
-
더 긴 기간을 되돌아볼 필요가 있고 터미널의 프로세서 성능이 빠르다면,입력 항목 에서 'Max Bars to Render'를늘릴 수 있습니다.
-
데이터 요구 사항:브로커가 거래량 데이터(틱 또는 실제 거래량)를 제공하는지 확인하십시오 .
-
새로운 차트에 로드할 때, MT5는 델타를 계산하는 데 필요한 하위 시간대(M1/M5)의 과거 데이터를 다운로드하는 데 잠시 시간이 걸릴 수 있습니다.
MetaQuotes Ltd에서 영어로 번역함.
원본 코드: https://www.mql5.com/en/code/75210
Portfolio Correlation and Margin Risk Calculator
임의의 상품 세트와 해당 상품들을 모두 동시에 보유하기 위해 계좌에 필요한 총 마진 간의 과거 피어슨 상관계수를, 순자산 대비 백분율로 계산합니다. 외부 라이브러리, Python, AI 없이 MetaTrader 5에서 네이티브로 실행됩니다. 심볼 목록과 랏 크기를 입력값으로 설정하면 ‘전문가’ 탭과 차트에 전체 행렬이 표시되며, 타이머에 따라 자동으로 갱신됩니다.
 Interactive Supply and Demand Zone Trading Prototype
이번 릴리스에서는 ‘Interactive Supply and Demand Zone Manager’ 프레임워크를 기반으로 구축된 경량 자동 거래 프로토타입을 소개합니다. 이 프레임워크를 통해 트레이더는 자신만의 매수·매도 구역을 직접 그리며 관리할 수 있으며, 각 구역은 시장 상황이 변화함에 따라 고유한 수명 주기, 상호작용 이력 및 변화하는 상태를 유지합니다. 이 하이브리드 방식은 사용자 정의 구역과 자동화된 모니터링, 검증, 거래 관리 기능을 결합합니다. 이 전략은 구조화된 의사결정 과정을 통해 적격 구역을 평가한 후 거래 실행을 생성합니다. 상세한 로깅 기능을 통해 구역의 동작을 파악할 수 있으므로, 트레이더는 상호작용을 분석하고 수집된 정보를 활용하여 자신만의 접근 방식을 구축할 수 있습니다.
Value Area Levels / BhanuCodeLab
'Value Area Levels'는 MetaTrader 5용 세션 기반 밸류 에어리어 지표입니다. 이 지표는 현재 형성 중인 프로파일, 이전 프로파일 및 과거 프로파일에 대한 밸류 에어리어 고점, 제어점(Point of Control), 밸류 에어리어 저점 수준을 계산하여 표시합니다.
PRO SCREENER
Pro 대시보드 스크리너로 거래 성과를 직접 관리해 보세요. 진지한 트레이더를 위해 설계된 이 유틸리티는 차트 화면에서 바로 계좌의 상태를 깔끔하고 전문적이며 실시간으로 한눈에 파악할 수 있게 해줍니다.