 MetaTrader 5
 Experts
 지표
지표
 스크립트
스크립트
 라이브러리
라이브러리
 보관함
보관함
당사 팬 페이지에 가입하십시오

Envelope SAR - MetaTrader 5용 지표

- 조회수:
- 44
- 평가:
- 게시됨:
- 업데이트됨:
-
 이 코드를 기반으로 한 로봇이나 지표가 필요하신가요? 프리랜스로 주문하세요
프리랜스로 이동
이 코드를 기반으로 한 로봇이나 지표가 필요하신가요? 프리랜스로 주문하세요
프리랜스로 이동

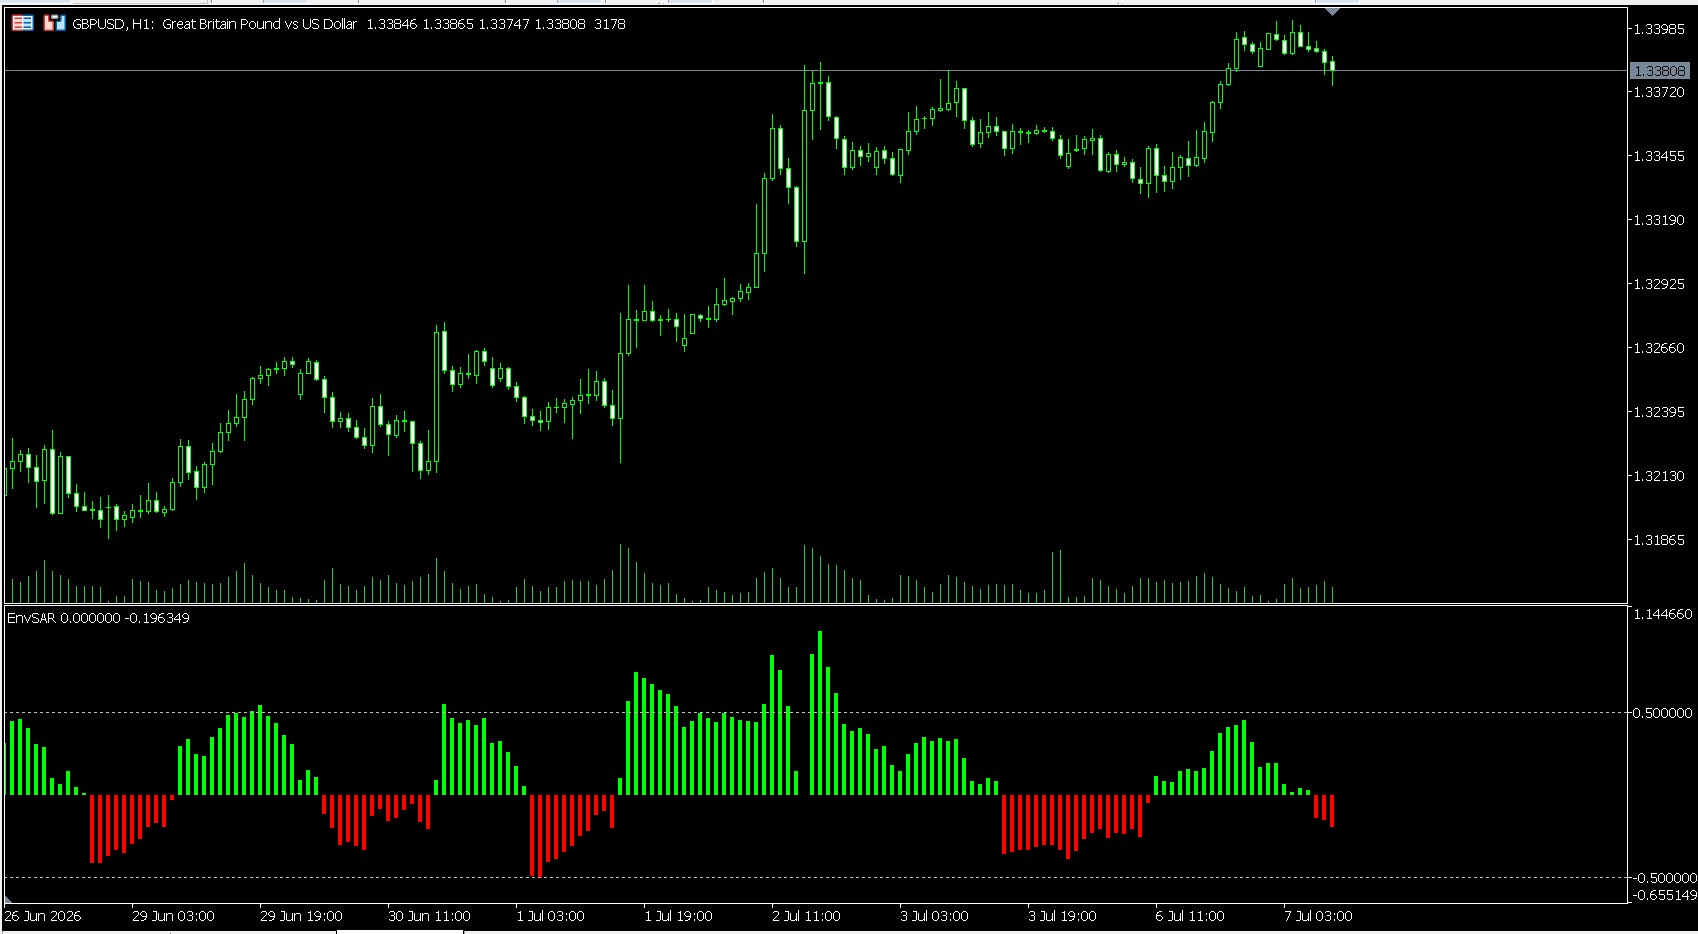
이 지표가 정확히 어떻게 작동하고 어떻게 해석해야 하는지 설명해 드리겠습니다. 핵심 개념: 이 지표는 가격 차트에 직접 선을 그리는 대신, 현재 캔들과 파라볼릭 SAR 점 사이의 거리를 계산합니다.
그런 다음 그 거리를 엔벨로프 채널의 총 폭으로 나누어 정규화합니다.$$Level = \frac{\text{가격} - \text{SAR}}{\text{엔벨로프 상한} - \text{엔벨로프 하한}}$$엔벨로프 폭을 나눗수로 사용함으로써, 이 지표는 자동으로 스케일링됩니다. 값이 1.0 또는 -1.0인 경우, 가격과 SAR 사이의 거리가 엔벨로프 채널의 총 높이와 정확히 동일함을 의미합니다.
히스토그램 해석 방법라임색 막대(상승 레벨 / 강세 모멘텀): 시가/종가의 최저값이 파라볼릭 SAR보다 높을 때 나타납니다.
더 높은 녹색 막대는 공격적인 상승 가속도를 나타내며, 가격이 트레일링 스탑에서 빠르게 멀어지고 있음을 보여줍니다. 빨간색 막대(하락 레벨 / 약세 모멘텀): 시가/종가의 최고가가 파라볼릭 SAR 아래에 있을 때 나타납니다. 더 짙은 빨간색 막대는 가격이 트레일링 스탑 아래로 급격히 떨어지면서 강한 하락 모멘텀이 있음을 의미합니다.
공백/빈 칸: 파라볼릭 SAR이 반전되거나 캔들 몸통 내부에 정확히 위치할 때(upLevel > 0 또는 downLevel < 0 조건 위반), 히스토그램은 빈 값을 표시하며, 이는 구조적인 추세 전환점이나 극심한 시장 횡보 국면을 시사합니다.가장 효과적인 용도: 추세 강도 측정: 단순히 추세가 상승인지 하락인지만 파악하는 대신, 고정 그리드 라인(0.5, 1.5, 2.5)을 통해 추세가 가속화되고 있는지, 아니면 약화되고 있는지 확인할 수 있습니다. 허위 돌파 필터링: 가격이 돌파했으나 히스토그램이 주요 구조적 수준(예: 0.5)을 넘지 못할 경우, 이는 약한 움직임임을 경고합니다.
MetaQuotes Ltd에서 영어로 번역함.
원본 코드: https://www.mql5.com/en/code/74734
 T5Copier - MT 5 client to client Local trade copier
C#으로 구현된 맞춤형 대시보드를 갖춘 로컬 클라이언트 간 트레이딩 카피어이며, Go 언어로 작성된 전송 파이프를 포함합니다. 아카이브에 전체 소스 코드가 포함되어 있습니다(소켓 기반 버전). 초저지연
Previous Day High Low Open Close Indicator
Plots the previous trading day's High, Low and Close as horizontal reference levels across the current session, with optional multi-day history for context. No repainting, no discretion — the levels are read directly from the completed Daily bar
Trend Regime Inspector for MetaTrader 5
Open-source indicator combining moving-average direction, ADX and Kaufman's Efficiency Ratio into a transparent trend-condition score. Informational only; no trade execution.
 MT5 Broker Environment Report
Prints a privacy-conscious snapshot of the current MT5 broker, account, symbol and terminal environment to the Experts log for diagnostics and support.