당사 팬 페이지에 가입하십시오

Institutional Market Reversal - The SMC way - MetaTrader 5용 지표

- 조회수:
- 25
- 평가:
- 게시됨:
-
 이 코드를 기반으로 한 로봇이나 지표가 필요하신가요? 프리랜스로 주문하세요
프리랜스로 이동
이 코드를 기반으로 한 로봇이나 지표가 필요하신가요? 프리랜스로 주문하세요
프리랜스로 이동
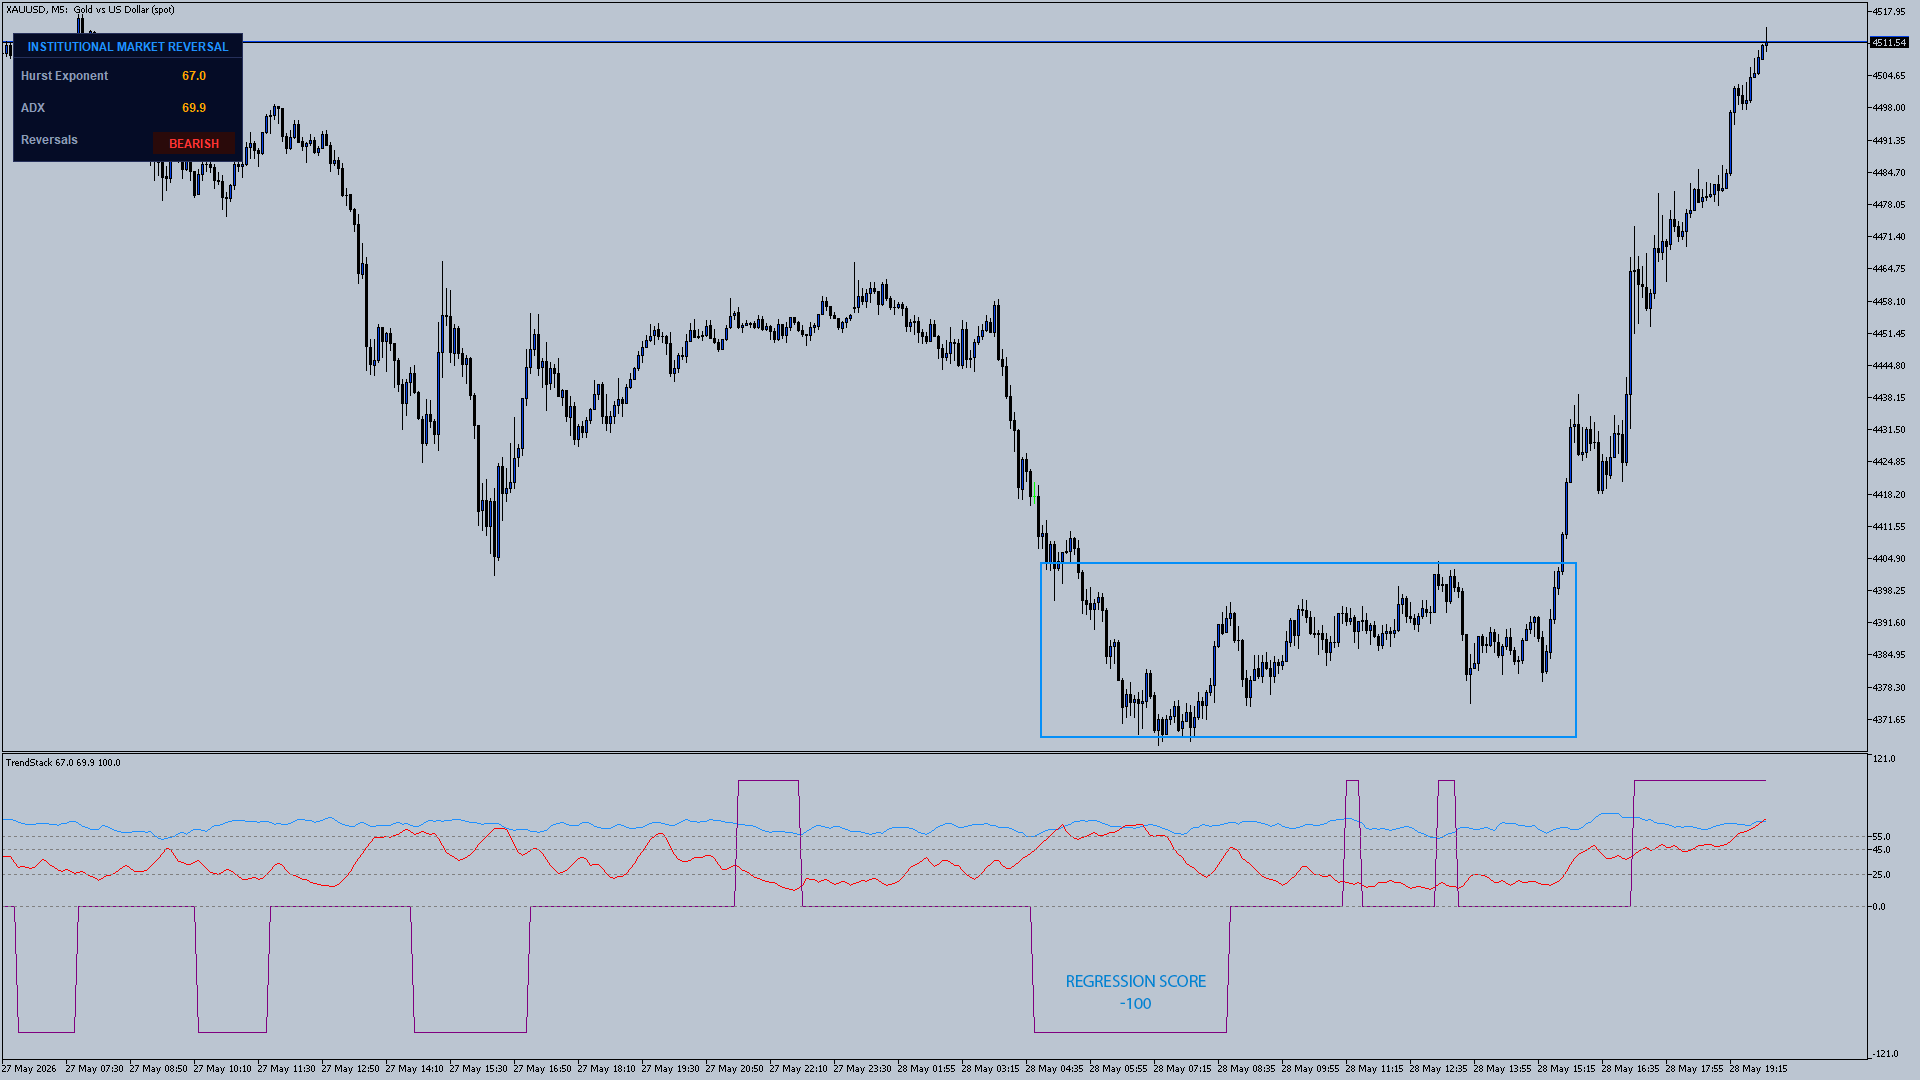
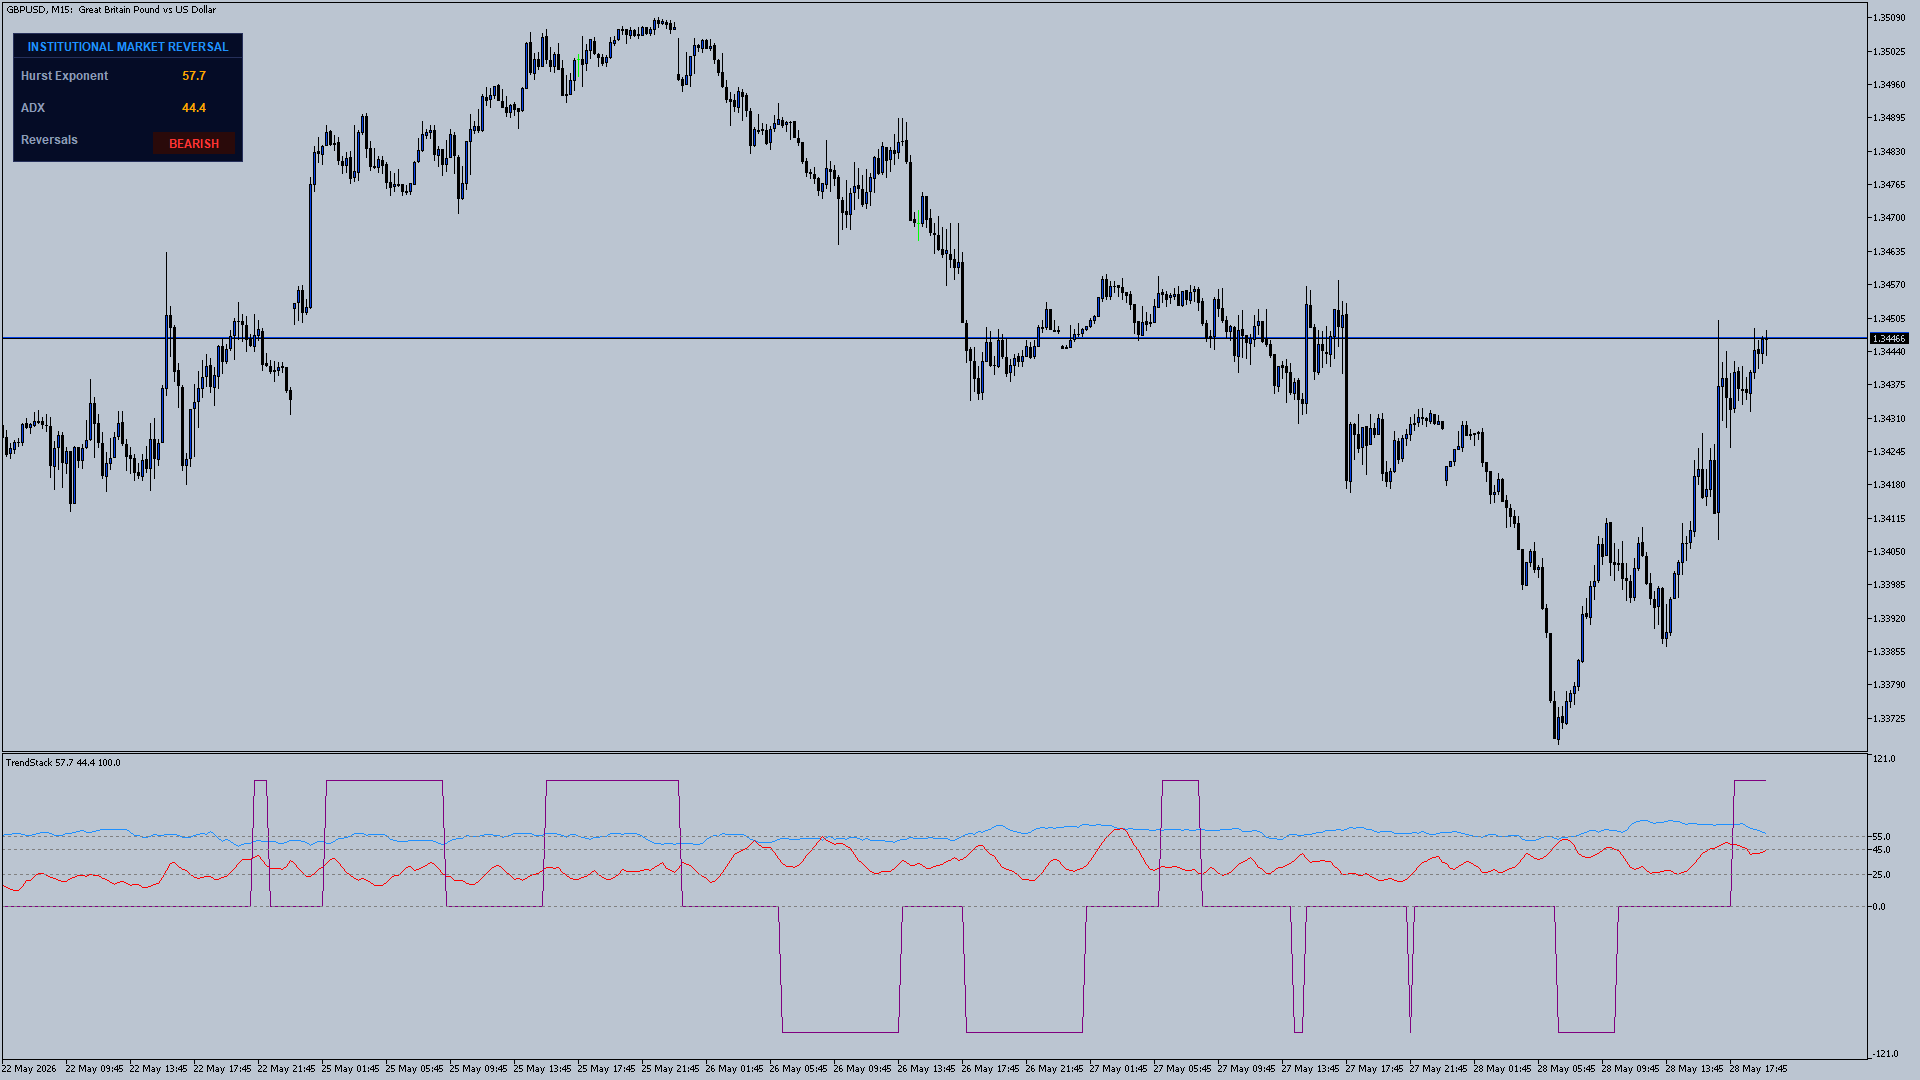
IMR을가격 움직임 전략의 기반이 되는 진단 대시보드 라고 생각하십시오. 이는 ICT/SMC 거래 접근 방식에 대한 확신을 심어줍니다.
이것이 중요한 이유
대부분의 개인 투자자들이 실패하는 이유는 전략 자체가 잘못되었기 때문이 아니라, 올바른 전략을시장의 단계(축적, 분배 또는 지속) 에 제대로 적용하지 못하기 때문입니다.
SMC/ICT 트레이더를 위한: 축적 및 분배 읽기
- RegScore가+100에 도달하면, 이는 가격이 과거 분석 기간 동안 통계적으로 완벽한 직선을 그리며 상승했음을 의미합니다. 회귀 적합도가 매우 높습니다(R² ≥ 0.60). SMC 용어로 말하자면, 이는 종종축적 단계의 막 바지나 유동성 조작에 의한 랠리를 의미합니다. 이러한 움직임은 “너무 깔끔”합니다. 특정 시간대에서 움직임이 너무 깔끔할 때, 이는 종종 반전이나 더 높은 시간대의 주문 블록으로의 되돌림이 일어나기 전 마지막 상승 모멘텀입니다.
- RegScore가–100에 도달하면, 하락 국면에도 동일한 논리가 적용됩니다. 가격이 체계적이고 선형적인 방식으로 매도되었습니다. 이는 종종분배 사이클이 완료되거나 축적이 시작되는 시점입니다. ChoCh를 찾기 시작하거나
- +100이나 –100을 진입 신호로 삼지 마 십시오. 이는사전 경고 로 받아들이십시오.
- RegScore가 +100에 도달하고 허스트(Hurst)가 0.45 미만(평균 회귀 국면)일 때, 프리미엄 배열이 과도하게 확장되었다는 통계적 경고 신호가 나타납니다. 이제 왼쪽을 살펴보며약세 주문 블록이나 브레이커를 찾아 숏 포지션을 구성하십시오 .
- RegScore가 –100에 도달하고 허스트 지수가 0.45 미만일 때는, 할인 구역에서 강세 주문 블록 을 찾아야 합니다.
- 허스트 지수가 0.55 이상일 때(추세 국면), RegScore가 +100을 기록하면 추세가확고하다는 신호입니다. 이 추세를 거스르지 마십시오. 프리미엄 영역의 강세 주문 블록까지 가격이 되돌려질 때까지 기다린 후, 추세에 맞서기보다는 흐름에 동참하십시오.
구성 요소 1: 허스트 지수
- 로그 수익률(원시 가격이 아님)에 대해재조정 범위(R/S) 방법을 통해 계산되는 허스트 지수는 0에서 1 사이의 값을 산출합니다.
- H > 0.55: 시장에 양의 기억성이 존재합니다. 가격이 상승했다면 계속 상승할 가능성이 높습니다. 이 경우 브레이크아웃 전략, 오더 블록 지속 거래, 추세 추종형 공정가치 갭 진입 전략이 효과적입니다.
- H < 0.45: 시장에 부정적 기억 ( 평균 회귀)이 존재합니다. 가격이 상승했다면 통계적으로 반락할 가능성이 높습니다. 이곳은 반전 기회를 노릴 수 있는 사냥터로, 인위적으로 조성된 유동성 확보 시도를 역이용하려는 SMC/ICT 트레이더에게 이상적입니다.
- H ≈ 0.50: 랜덤 워크. 통계적 우위가 없습니다. 시장은 효율적입니다. 주문 블록이 완벽해 보일 수 있지만, 수학적 분석에 따르면 방향성 편향은 없습니다.포지션을 유지하지 마십시오.
패널과 지표 창에서 이 값들은 55, 45, 50(100을 곱한 값)으로 표시된다는 점에 유의하십시오.
구성 요소 2: ADX
- ADX < 20–25: 시장이 잠들어 있습니다. 추세 강세가 없습니다. 명확한 주문 블록이 보이더라도 그 이면에 동력이 없습니다. 진입을 피하십시오.
- ADX 25–50: 추세 강도가 형성되고 있습니다. 이는 대부분의 가격 움직임(Price Action) 진입 시나리오에 있어 최적의 구간입니다. 기관 자금 흐름이 특정 방향으로 집중되어 있으므로, 주문 블록과 공정가치 갭이 해소될 가능성이 더 높습니다.
- ADX > 50: 움직임이 절정에 달했습니다. SMC/ICT 용어로 말하자면, 이는 종종조작 단계, 즉 반전 전에 유동성을 확보하기 위한 마지막 공격적인 추진 단계입니다. ADX가 극단적이고 RegScore가 최대치에 도달했을 때, 스마트 머니는 축적/분배 단계에서 다음 단계로 전환되고 있을 가능성이 높습니다.
ADX는 방향을 알려주지 않습니다. 대신 시장참여의 강도를 보여줍니다. 이를 활용하여 주시하고 있는 주문 블록이 단순한 소매 투자자들의 무작위 잡음이 아닌, 실제 거래량과 의도에 의해 뒷받침되고 있는지 확인하십시오.
구성 요소 3: R²를 활용한 선형 회귀 분석
- 기울기: 선이 어느 방향을 가리키고 있는가?
- R² (결정계수): 실제 가격이 그 선을 얼마나 잘 따르고 있는가?
- +100: 강한 양의 기울기와 높은 신뢰도의 적합도(R² ≥ 0.60). 가격이 규칙적이고 요동치지 않는 방식으로 상승하고 있습니다. 약세 반전이 곧 발생할 것입니다.
- –100: 강한 음의 기울기와 높은 신뢰도의 적합도를 보입니다. 가격이 질서 정연하게 하락하고 있습니다. 강세 반전이 곧 일어날 것입니다.
- 0: 신뢰도가 없음 . 가격 움직임이 너무 요동쳐서 명확한 선으로 적합하게 나타낼 수 없음. 회귀 분석 결과가 신뢰할 수 없음.
- 더 낮은 시간대의 RegScore가 +100일 때, 이를 더 높은 시간대의 프리미엄 배열과 대조해 보면인위적인 움직임이 완료되었음을 시사합니다. 축적을 유발한 알고리즘/기관 매수가 통계적 포화 상태에 도달했습니다. 이제 분배 흔적을 찾아볼 때입니다.
- 할인 배열에서 –100의 RegScore는 매도세가 통계적 한계에 도달했음을 시사합니다. 이제 축적 흔적, 즉 강세 주문 블록이나 주요 저점의 휩쓸림을 찾아볼 때입니다.
MetaQuotes Ltd에서 영어로 번역함.
원본 코드: https://www.mql5.com/en/code/73414
fair value gap/imbalance
동적 공정가치 격차(FVG)는 시장 가격의 불균형을 자동으로 감지하는 MetaTrader 5용 MQL5 지표입니다. 이 지표는 스마트 머니 컨셉(SMC) 전략을 활용하는 트레이더에게 안성맞춤입니다.
ATR Ranked Support and Resistance Zones
An educational MT5 indicator that builds support and resistance as price zones from confirmed pivots. Nearby reactions are merged using ATR-based distance, then ranked by repeated tests, rejection strength and recency. Only the strongest zones are displayed to keep the chart readable.
Pip Value Calculator
Live pip value, risk-based lot sizing, custom volume risk analysis & open position P/L — all in one panel.
 Result - type-safe error handling for MQL5 without exceptions
A small, dependency-light library that brings a Rust-style Result type to MQL5. Functions return a single value-or-error object instead of relying on the global GetLastError() state, so failures are explicit and impossible to ignore. Includes ResultValue (value types) and Result (pointer-held objects), an Error struct, early-return macros (TRY, RETURN_ON_ERROR, ...) and optional Then/Match/MapError callbacks.