당사 팬 페이지에 가입하십시오

잔액 및 지분 차트를 기록하고 추가 최적화 기준을 계산하는 코드 - MetaTrader 5용 라이브러리

- 조회수:
- 103
- 평가:
- 게시됨:
- 업데이트됨:
-
 이 코드를 기반으로 한 로봇이나 지표가 필요하신가요? 프리랜스로 주문하세요
프리랜스로 이동
이 코드를 기반으로 한 로봇이나 지표가 필요하신가요? 프리랜스로 주문하세요
프리랜스로 이동
저는 별도의 라이브러리에 디자인된 대규모 프로젝트 의코드 를공유하기로 결정했습니다 .
Expert Advisor 코드에 액세스할 수 있는 경우 이 라이브러리에서 코드를 추가하여 잔고 및 주식 차트를 저장하고 추가 최적화 기준을 계산할 수 있습니다.
첨부된 링크에서 고급 최적화 보고서 세이버.mqh 파일을 다운로드하여 터미널 폴더 \MQL5\Include\
다운로드한 파일을 연결하는 코드 추가: (Expert Advisor 코드의 마지막 줄 아래 또는 다른 위치에 추가할 수 있습니다.)
#include <Advanced Optimization Report Saver.mqh> //https://www.mql5.com/ko/code/68706 그런 다음 내보낸 함수에 대한 호출을 Expert Advisor의 기존 함수에 추가해야 합니다: (함수가 없는 경우 추가).
void OnTick(){
   //... 코드

   //잔고 및 주식 차트 저장
   save_OnTick(TimeCurrent(), AccountInfoDouble(ACCOUNT_BALANCE), AccountInfoDouble(ACCOUNT_EQUITY));
}

void OnTesterInit()  {
   //... 코드

   save_OnTesterInit();//차트에 인쇄 "최적화가 완료될 때까지 이 창을 닫지 마세요!"
}
void OnTesterDeinit(){
   //... 코드

    save_OnTesterDeinit();// 프레임 가져오기
}

//void OnTesterPass(){
   //... 코드

// save_OnTesterPass();//옵션. 각 패스 직후에 그래프를 저장합니다. 이 옵션을 삭제하면 최적화가 끝날 때 저장Charts(Custom)에 그래프가 저장됩니다;
//}

double OnTester(){
   //... 코드

   //사용자 지정 값을 저장합니다:
   double AvgPips=0;
   save_Add( AvgPips, 2, "Custom 1", true);//값, 숫자, 이름, sort_min_to_max
   save_Add( TesterStatistics( STAT_PROFIT ), 2, "Custom 2");
   double Custom = 0;//맞춤형 피트니스
   saveCharts(Custom);//최종 자본, 모든 거래 저장...
   return Custom;
}
저장_추가 함수를 사용하여 보고서에 포함할 자신만의 기준을 추가할 수 있습니다:
   save_Add( AvgPips, 2, "Custom 1", true);//값, 숫자, 이름, sort_min_to_max
   save_Add( TesterStatistics( STAT_PROFIT ), 2, "Custom 2");
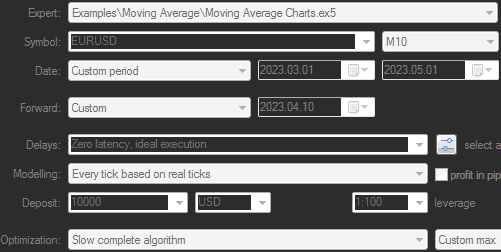
예를 들어, 예제 폴더(...\MQL5\전문가\예제\이동평균\이동평균.mq5)의 이동평균 전문가 조언자에 이 코드를 추가해 보겠습니다. 먼저 원본 Expert Advisor를 복사하고 이름을 이동평균 차트.mq5로 지정합니다. 이제 위 지침의 코드를 여기에 추가합니다.
변경 사항은 코드의 맨 끝, CheckForOpen(); 줄 뒤의 OnTick() 함수부터 시작됩니다.
void OnTick(void)
  {
//---
   if(SelectPosition())
      CheckForClose();
   else
      CheckForOpen();
   //잔고 및 주식 차트 저장
   save_OnTick (TimeCurrent(), AccountInfoDouble( ACCOUNT_BALANCE), AccountInfoDouble( ACCOUNT_EQUITY));
  }

void OnTesterInit()  {
   //... 코드

   save_OnTesterInit();//차트에 인쇄 "최적화가 완료될 때까지 이 창을 닫지 마세요!"
}
void OnTesterDeinit(){
   //... 코드

    save_OnTesterDeinit();// 프레임 가져오기
}

//void OnTesterPass(){
   //... 코드

// save_OnTesterPass();//옵션. 각 패스 직후에 그래프를 저장합니다. 이 옵션을 삭제하면 최적화가 끝날 때 저장Charts(Custom)에 그래프가 저장됩니다;
//}

double OnTester(){
   //... 코드

   //사용자 지정 값을 저장합니다:
   double AvgPips=0;
   save_Add( AvgPips, 2, "Custom 1", true);//값, 숫자, 이름, sort_min_to_max
   save_Add( TesterStatistics( STAT_PROFIT ), 2, "Custom 2");
   double Custom = 0;//맞춤형 피트니스
   saveCharts(Custom);//최종 자본, 모든 거래 저장...
   return Custom;
}

#include <Advanced Optimization Report Saver.mqh>
보시다시피 매우 간단하며 몇 분 밖에 걸리지 않습니다.
그 후 최적화를 실행할 수 있습니다:
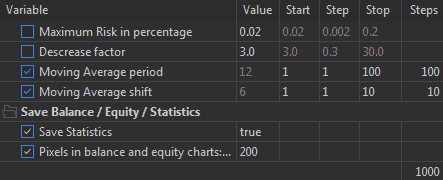
마지막 스크린샷은 연결된 코드가 2개의 매개변수를 추가했음을 보여줍니다:
- 통계저장 - 통계 수집을 활성화 또는 비활성화합니다.
- 잔고 및 주식 차트의 픽셀 - 미니 차트 너비의 픽셀 수를 지정합니다.
최적화가 완료되면 저장된 프레임을 파싱하는 프로그램을 사용하여 보고서를 작성하면 다음과 같은 내용을 확인할 수 있습니다:
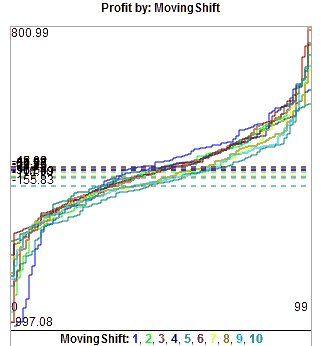
| 이동주기를 사용한 100줄 | MovingShift를 사용한10줄 |
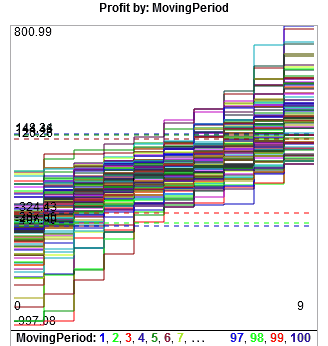
20줄을 초과하는 경우 평균값의 가로줄 3개만 표시됩니다:
100줄은 인식하기 어려우므로 줄 수를 줄여야 합니다.
입력 변수를 동일한 단계가 아닌 열거형(열거형)을 통한 척도로 사용하는 경우(예: 1,2,3,5,7,10,15,20,30,50,70,100)에는 100줄이 아닌 12줄만 표시됩니다.
enum nums1 {__0=0, __1=1, __2=2, __3=3, __5=5, __7=7, __10=10, __15=15, __20=20, __30=30, __50=50, __70=70, __100=100, __150=150, __200=200, __300=300, __500=500};
input nums1 MovingPeriod = 10; // 이동 평균 기간
첨부 파일에서 열거형 버전의 Expert Advisor를 다운로드할 수 있습니다.
최적화 패스가 1000개가 아닌 120개가 되며, 계산 시간은 최대 8배 빨라지고 파일 크기는 최대 8배 작아집니다.
결과가 더 잘 보입니다:
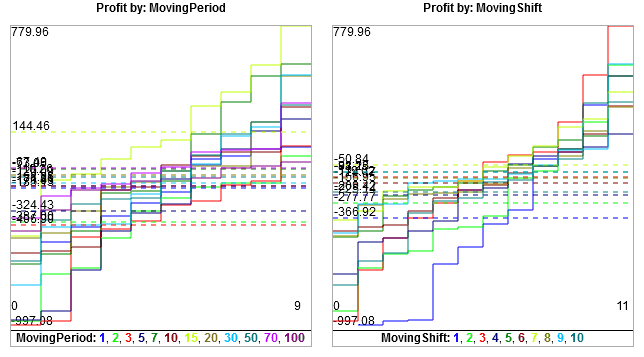
이동 기간 = 15의 결과는 평균 선이 가장 높고 최대값이 가장 높아 즉시 눈에 띕니다.
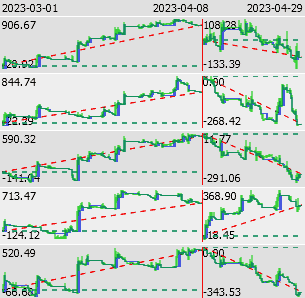
그러나 종종 그렇듯이 백 테스트에서 가장 좋은 결과가 포워드 테스트에서 가장 좋은 결과는 아닙니다.
저장된 프레임을 파싱하는 프로그램은 이와 같은 차트를 표시할 수 있습니다:
그리고 다음과 같은 추가 기준도 표시할 수 있습니다:
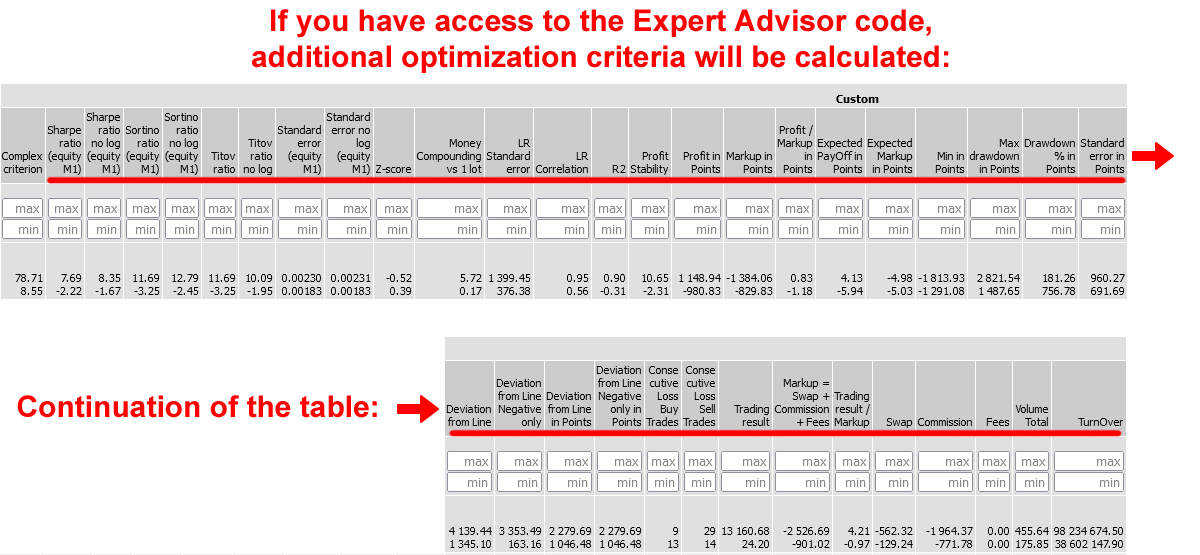
다른 흥미로운 기준에 대한 코드가 있는 경우 라이브러리에 추가하도록 제안할 수 있습니다.
저장된 파일은 마켓의 고급 최적화 보고서 유틸리티를 사용하여 HTML 보고서로 변환할 수 있습니다.
이 예제의 전체 보고서는 Advanced_Optimization_Report_Sample.zip 아카이브에 첨부되어 있습니다.
보고서 사용에 대한 동영상:
업데이트:
- 2026-02-02: 사용자 지정 기준 이름에 UTF 문자 지원이 추가되었습니다.
- 2026-03-19: 각 패스에 대한 최적화 시간이 추가되었습니다.

기타 변경 사항.
MetaQuotes Ltd에서 영어로 번역함.
원본 코드: https://www.mql5.com/en/code/68706
 Previous Day highs and lows
Draws the previous day High, Low, and Close as horizontal reference lines on the chart for a configurable number of past days. Yesterday's levels extend into today as live support and resistance, with optional touch alerts.
Trade With MA
Trade using MA. An easy indicator to identify the trend direction on a specific timeframe.
Binary tradng based on candle colors
캔들 색상을 계산하는 간단한 바이너리 트레이딩 전략입니다.
 ShowTradeLines Service
기존 포지션/딜의 진입/청산 시점을 차트에 추세선 및/또는 화살표로 표시하는 서비스입니다.