Urayayi Kwinika / プロファイル
- 情報
|
no
経験
|
0
製品
|
0
デモバージョン
|
|
0
ジョブ
|
0
シグナル
|
0
購読者
|
Urayayi Kwinika
there is an indicator on this thread: https://c.mql5.com/forextsd/forum/141/murrey_math_alltf.mq4 which was posted by Andrew Ho, i dont know if anyone has a clue say i make a conversion of it from MT4 to MT5 then share it for the sake of those who want to use Murrey Math Lines on MT5. Is it allowed or permitted, any moderators to help me on that.
Urayayi Kwinika
Trade History Display Clutter on MetaTrader 5 Charts: A Proposal for Improved Visual Clarity & Cleaner Visual Design
MetaTrader 5 has established itself as one of the most widely used Trading Platforms in the world - I believe not only by Retail Traders, valued for its analytical depth, algorithmic capabilities, and multi-asset support. For the majority of traders, the Chart remains the Primary Workspace—the space where price action is interpreted, levels are identified, and decisions are formed. Any element that systematically reduces the readability of that workspace therefore deserves careful attention.
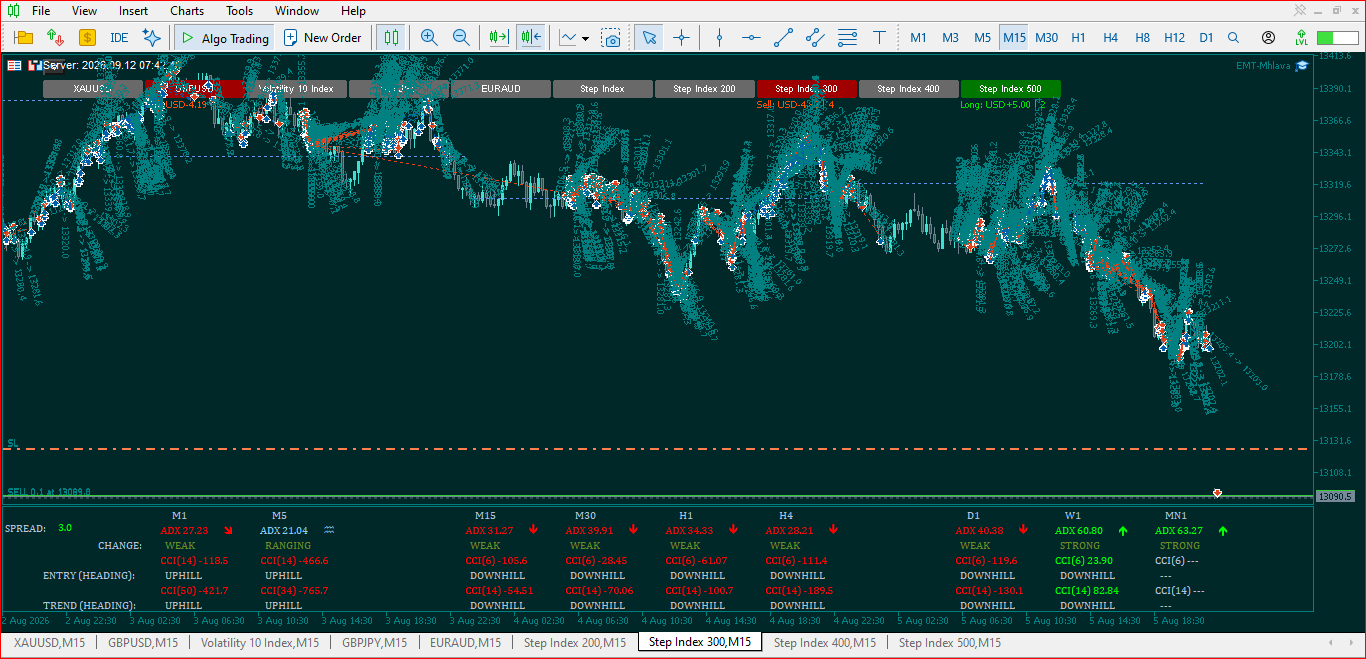
One such element is the current method of displaying Trade History on the Chart. When Historical Trades are shown, the Terminal places not only Directional Arrows but also a dense collection of numerical price values directly onto the candles. Over time, and especially on active instruments or multi-session charts, these numbers accumulate into a form of visual noise that competes with the very price data traders need to see clearly.
This article examines the nature of the problem in detail, analyses its practical consequences for different styles of trading, and presents concrete, measured suggestions for improvement. The aim is not criticism for its own sake, but a constructive contribution toward a cleaner, more professional charting experience.
The Nature of the Current Display
When Trade History is activated, MetaTrader 5 overlays each closed position with:
Directional arrows (Buy/Sell Markers), and
Associated Numerical Labels showing entry and exit prices (and, in some configurations, additional trade-related figures).
On a short time frame or a lightly traded instrument the effect may remain manageable. On an instrument such as XAUUSD, or on any chart that spans several days of active trading, the numerical labels multiply rapidly. They overlap one another, and sit directly across candle bodies, wicks, and indicator lines. The result is a chart surface that becomes progressively more difficult to interpret.
The arrows themselves remain useful. They provide an immediate visual cue of trade direction and approximate location without requiring the trader to decode additional text. The numerical values, by contrast, add limited incremental information once a trade has been closed, yet they occupy substantial visual real estate.
Practical Consequences for Chart Analysis
The impact of this clutter is not merely aesthetic; it has direct operational consequences:
Obscured Price Structure
Support and Resistance Levels, Swing Highs and Lows, and Candlestick Patterns become partially or fully hidden beneath layers of numerical text. Traders are forced to zoom, pan, or temporarily disable history simply to regain a clear view of price action.
2. Interference with Technical Indicators
Moving averages, oscillators, volume profiles, and custom indicators frequently share the same visual space. When Trade-History numbers overlay these tools, the trader must constantly mentally filter competing information, increasing cognitive load.
3. Multi-Timeframe and Multi-Symbol Work
Workflows often involve simultaneous monitoring of several time frames or correlated instruments. When each chart carries its own accumulation of historical price labels, the overall workspace becomes visually exhausting.
4. Historical Review and Journaling
Many traders use Chart History as part of their post-trade review process. Excessive numerical clutter slows this process and reduces the clarity of lessons that might otherwise be drawn from past decisions.
5. Psychological Effect
A cluttered chart subtly raises the sense of visual pressure. Clean charts support calm, focused decision-making; dense charts work against it.
These effects are felt across trading styles—scalping, day trading, swing trading, and position trading alike—though the intensity varies with the density of historical activity on the instrument.
Comparison with Effective Visual Design Principles
In professional trading interfaces, the guiding principle is that every visual element should earn its place. Information that is rarely consulted in real time should not permanently occupy the primary visual field.
Directional arrows already satisfy the core requirement of historical trade identification. Additional numerical detail is useful primarily for the most recent activity or during deliberate review sessions. Displaying every historical price value by default violates the principle of progressive disclosure—showing detail only when it is needed.
Many modern analytical platforms and charting packages have moved toward minimal trade markers by default, with optional detailed labels available on demand or limited to recent trades. MetaTrader 5’s current approach, while comprehensive, has not kept pace with this evolution in visual economy.
Proposed Improvements
The following suggestions are offered as practical, low-disruption enhancements:
Default to Arrows Only
Retain the existing directional arrow system as the primary and default historical trade marker. Arrows are clear, compact, and sufficient for most analytical purposes.
Restrict Numerical Price Labels to Recent Activity
If price values are to remain available, limit their automatic display to the most recent closed trades—perhaps the last five to ten positions, or trades closed within a user-defined look-back period (for example, the current session or the last 24–48 hours). Older trades would show arrows only.
User-Controlled Display Modes
Introduce a clear preference setting, ideally accessible both from the chart context menu and from the global Options dialogue, offering at least three modes:
Arrows only
Arrows + recent price labels
Full Historical price labels (current behaviour)
Such a setting would respect different trader preferences while establishing a cleaner default for the majority of users.
Optional On-Demand Detail
Allow traders to hover over or click an arrow to reveal the associated price values temporarily. This preserves access to precise data without permanent visual cost.
These changes would require no alteration to the underlying trade history data; they concern only the presentation layer.
Anticipated Benefits
Implementation of the above refinements would deliver several tangible advantages:
Immediate improvement in chart readability across all time frames and instruments.
Reduced cognitive load during live trading and multi-chart analysis.
Greater consistency with modern interface design standards.
Preservation of full historical data for those who explicitly require it.
Enhanced professional appearance of the platform, reinforcing MetaTrader 5’s position as a serious analytical environment.
The cost of implementation appears modest relative to the daily improvement in usability for a large user base.
In Conclusion
The current method of rendering Trade History on MetaTrader 5 charts prioritises completeness of information at the expense of visual clarity. While the intention is understandable, the practical result is a form of progressive clutter that interferes with the primary purpose of the chart: the clear observation of price.
By elevating the existing arrow system to the default historical marker, restricting numerical labels to recent activity, and providing traders with explicit control over display modes, MetaQuotes can restore a cleaner, more professional charting experience without sacrificing analytical capability.
Clean charts support better decisions. A measured refinement of trade-history presentation would be a meaningful step in that direction and would be welcomed by a substantial portion of the MetaTrader Community.
I respectfully submit this analysis for consideration by the MetaQuotes Development Team and look forward to any future improvements in this area.
Urayayi Kwinika
パブリッシュされたコードMT5 Symbol Changer Profit Display
EMTOrdersUtilityは、複数の金融商品にわたる建玉状況をリアルタイムで把握したいと考えるアクティブなトレーダー向けに設計された、リアルタイム取引モニタリングおよび銘柄切り替えユーティリティです。
ソーシャルネットワーク上でシェアする
40
180
Urayayi Kwinika
Hoping this XAUUSD Bullish Move after the Reaction on Murrey Math Level: W1[7/8] D[6/8] H4 Pivot H1 SUP which proved to be a Strong Support Level pushes through to Murrey Math Level: H4 [5/8] H1 [1/8] M30 [1/8] M15 PIVOT
: