RvR Ventures / プロファイル
財務分析、トレーディング&ストラテジープロフェッショナル、Forex Tradingで9年間のトータル経験
スマートな外国為替ブローカー&企業にあなたの困難な収入を失うのを止めなさい。
私たちは、失うことがなく、リアルタイムで失い、実際の取引を実験することによって、どうやって学ぶのかを学びました。経験豊富な技術力と優れた技術力で、我々は持続可能で一貫した取引シグナルを共有することを楽しみにしています。私たちの創業者が言うように:貿易は少なくなりますが、貿易はよくなります。 1つの間違いは100%の資本と利益を殺すのに十分であり、1つの正しい時間に正しい権利を移すことは、あなたの資本に100%の利益を乗じるのに十分です。
あなたに最高のお祈りを!詳細とクエリについては、ask.rvr@gmail.comまで電子メールでお問い合わせください。
高リスク・リスク:外国為替取引は、すべての投資家にとって適切ではない可能性のある高いレベルのリスクを伴います。レバレッジは、追加のリスクと損失の被害をもたらします。外国為替の取引を決める前に、投資目標、経験レベル、リスク許容度を慎重に検討してください。初期投資の一部または全部を失う可能性があります。あなたが失うことができないお金を投資しないでください。私たちは、国際的なマネーロンダリング規制とポリシーに厳密に従います。信号サービスの加入は、直接的または間接的な方法で利益を保証するものではありません。このシグナルを購読することにより、このサブスクリプションのためにあなたが行った利益または損失の100%責任を負います。
お客様は、この信号の情報/分析/計算を、電子的、印刷的、またはワイヤレスのあらゆるプラットフォーム上で、直接的または間接的な方法で、第三者に共有/公表しないことを約束します。
詳細とクエリについては、ask.rvr@gmail.comまで電子メールでお問い合わせください。
Zaimu bunseki, torēdingu& sutoratejīpurofesshonaru, forekkusu Trading de 9-nenkan no tōtaru keiken sumātona gaikoku kawase burōkā& kigyō ni anata no kon'nan'na shūnyū o ushinau no o tome nasai. Watashitachiha, ushinau koto ga naku, riarutaimu de ushinai, jissai no torihiki o jikken suru koto ni yotte, dō yatte manabu no ka o manabimashita. Keiken hōfuna gijutsu-ryoku to sugureta gijutsu-ryoku de, wareware wa jizoku kanōde ikkan shita torihiki shigunaru o kyōyū suru koto o tanoshiminishiteimasu. Watashitachi no sōgyō-sha ga iu yō ni: Bōeki wa sukunaku narimasuga, bōeki wa yoku narimasu. 1Tsu no machigai wa 100-pāsento no shihon to rieki o korosu no ni jūbundeari, 1tsu no tadashī jikan ni tadashī kenri o utsusu koto wa, anata no shihon ni 100-pāsento no rieki o jōjiru no ni jūbundesu. Anata ni saikō no oinori o! Shōsai to kueri ni tsuite wa, ask. Rvr@ gmail. Komu made denshi mēru de o toiawase kudasai. Kō risuku risuku: Gaikoku kawase torihiki wa, subete no tōshi-ka ni totte tekisetsude wanai kanōsei no aru takai reberu no risuku o tomonaimasu. Rebarejji wa, tsuika no risuku to sonshitsu no higai o motarashimasu. Gaikoku kawase no torihiki o kimeru mae ni, tōshi mokuhyō, keiken reberu, risuku kyoyō-do o shinchō ni kentō shite kudasai. Shoki tōshi no ichibu matawa zenbu o ushinau kanōsei ga arimasu. Anata ga ushinau koto ga dekinai okane o tōshi shinaide kudasai. Watashitachiha, kokusai-tekina manērondaringu kisei to porishī ni genmitsu ni shitagaimasu. Shingō sābisu no kanyū wa, chokusetsuteki matawa kansetsu-tekina hōhō de rieki o hoshō suru monode wa arimasen. Kono shigunaru o kōdoku suru koto ni yori, kono sabusukuripushon no tame ni anata ga okonatta rieki matawa sonshitsu no 100-pāsento sekinin o oimasu. Okyakusama wa, kono shingō no jōhō/ bunseki/ keisan o, denshi-teki, insatsu-teki, matawa waiyaresu no arayuru purattofōmu-jō de, chokusetsuteki matawa kansetsu-tekina hōhō de, daisansha ni kyōyū/ kōhyō shinai koto o yakusoku shimasu. Shōsai to kueri ni tsuite wa, ask. Rvr@ gmail. Komu made denshi mēru de o toiawase kudasai.
RvR Ventures
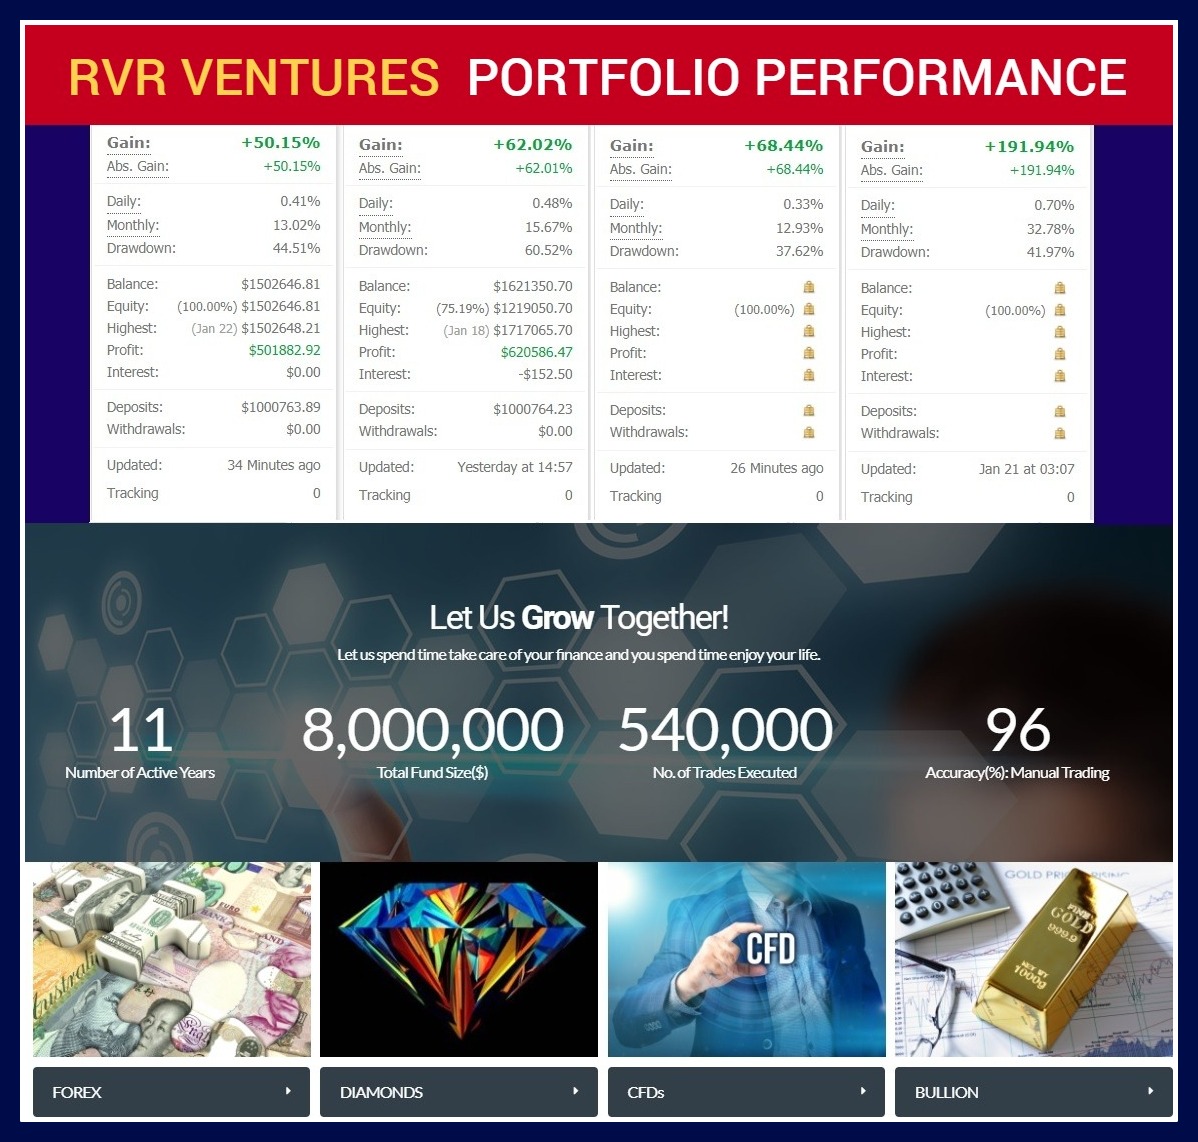
RvR Ventures Portfolio Performance.
#Forex #ForexTraders #Fundmanagers #Investment
Check verified performance on MyFxBook at:
myfxbook. com/ members/RVRventures /rvr005/ 2739956
For more details:
Email at info@rvr.ventures | Chat with us at +971-581958582
#Forex #ForexTraders #Fundmanagers #Investment
Check verified performance on MyFxBook at:
myfxbook. com/ members/RVRventures /rvr005/ 2739956
For more details:
Email at info@rvr.ventures | Chat with us at +971-581958582

RvR Ventures
51% Profits booked in 75 Trading Days!
Date of video recording & posting: 28 January, 2019
Account type: Real ECN Account | 1:500
Total Currencies Traded: GBPJPY, GBPUSD, EURUSD, USDJPY, EURGBP, XAUUSD, AUDUSD, EURJPY, NZDUSD, EURNZD, GBPNZD, USDCAD, USDCHF, NZDJPY.
Traders: KvN & RvR
Trading Strategy: Aggressive Intraday, Retracement & Fundamental
Indicators Used: RSI, Fibonacci, RvRetrace, SOC, Trend, SMA50, EMA100
Analytical Algorithm: RvR9669 | Highest Drawdown: 6.46%
Daily Gain: 0.39% | Monthly Gain: 12.51% | Total Profit Booked: 51%
Check our MyFxBook Verified Performance History:
www. myfxbook. com/ members/ RVRventures/ rvr005/ 2739956
RvR Ventures
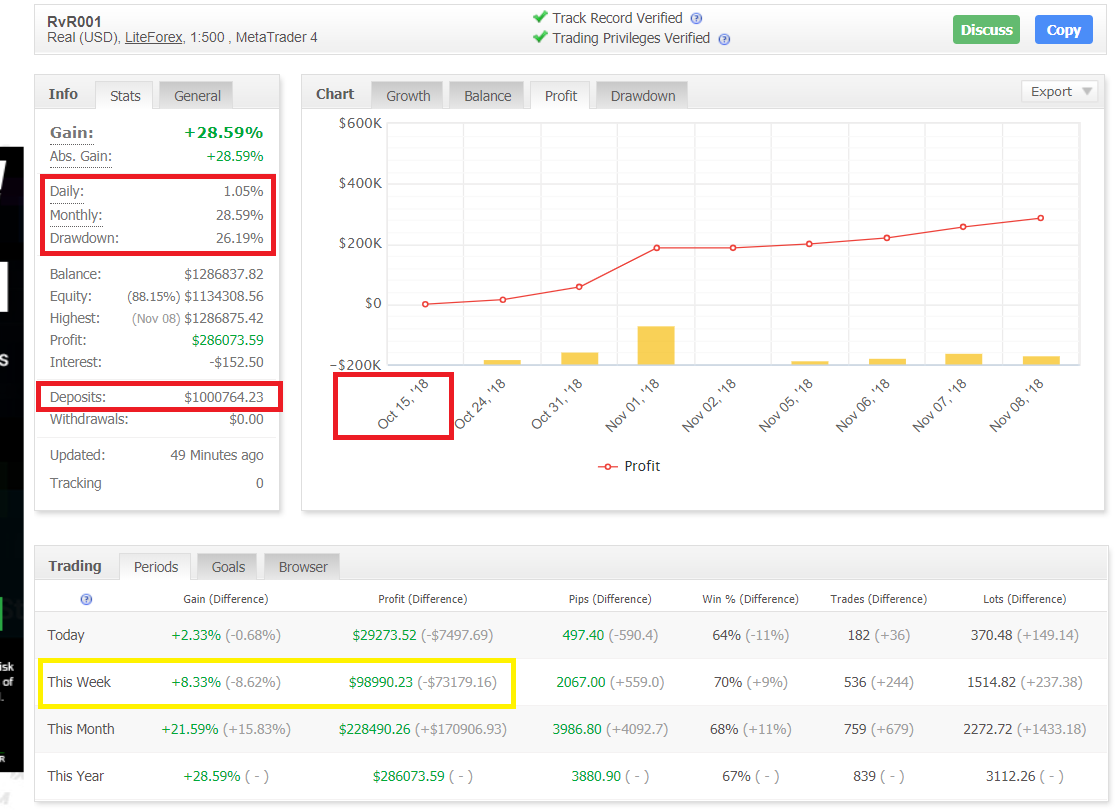
28% Profits booked in 20 Trading Days on Real ECN Account.
Check detailed LIVE Trading results on Myfxbook: myfxbook.com/ members/ RVRventures/ rvr001/ 2739856
You can simply copy our trades, and trade #Forex with ease.
Open YOUR account, under YOUR name with YOUR own money with YOUR complete control & share/pay profits only if YOU EARN. Simply copy the trades of RvR Ventures on LiteForex - Forex Broker's Trading Platform through Social Trading in a single click through the following simple steps:
1. Register your self at bit.ly/OpenFxAccount
2. Add minimum 10,000$ to your account
3. Choose to copy our trades at bit.ly/CopyTradesOfRvR
OR search @RvR under Traders, and choose to copy RvR
4. Get weekly reports of trading results.
5. Withdraw Profits, as and when you wish to.
6. We get paid only if you earn profits.
For more details, please WhatsApp at +971-581958582 or Email us at info@rvrventures.in
Invest as much as you can lose. #RvRventures #Forex #XAUSUSD #EURUSD #ForexTraders

RvR Ventures

28% Profits booked in 20 Trading Days on Real ECN Account.
Check detailed LIVE Trading results on Myfxbook: myfxbook.com/ members/ RVRventures/ rvr001/ 2739856
You can simply copy our trades, and trade #Forex with ease.
Open YOUR account, under YOUR name with YOUR own money with YOUR complete control & share/pay profits only if YOU EARN. Simply copy the trades of RvR Ventures on LiteForex - Forex Broker's Trading Platform through Social Trading in a single click through the following simple steps:
1. Register your self at bit.ly/OpenFxAccount
2. Add minimum 10,000$ to your account
3. Choose to copy our trades at bit.ly/CopyTradesOfRvR
OR search @RvR under Traders, and choose to copy RvR
4. Get weekly reports of trading results.
5. Withdraw Profits, as and when you wish to.
6. We get paid only if you earn profits.
For more details, please WhatsApp at +971-581958582 or Email us at info@rvrventures.in
Invest as much as you can lose. #RvRventures #Forex #XAUSUSD #EURUSD #ForexTraders
Check detailed LIVE Trading results on Myfxbook: myfxbook.com/ members/ RVRventures/ rvr001/ 2739856
You can simply copy our trades, and trade #Forex with ease.
Open YOUR account, under YOUR name with YOUR own money with YOUR complete control & share/pay profits only if YOU EARN. Simply copy the trades of RvR Ventures on LiteForex - Forex Broker's Trading Platform through Social Trading in a single click through the following simple steps:
1. Register your self at bit.ly/OpenFxAccount
2. Add minimum 10,000$ to your account
3. Choose to copy our trades at bit.ly/CopyTradesOfRvR
OR search @RvR under Traders, and choose to copy RvR
4. Get weekly reports of trading results.
5. Withdraw Profits, as and when you wish to.
6. We get paid only if you earn profits.
For more details, please WhatsApp at +971-581958582 or Email us at info@rvrventures.in
Invest as much as you can lose. #RvRventures #Forex #XAUSUSD #EURUSD #ForexTraders

RvR Ventures
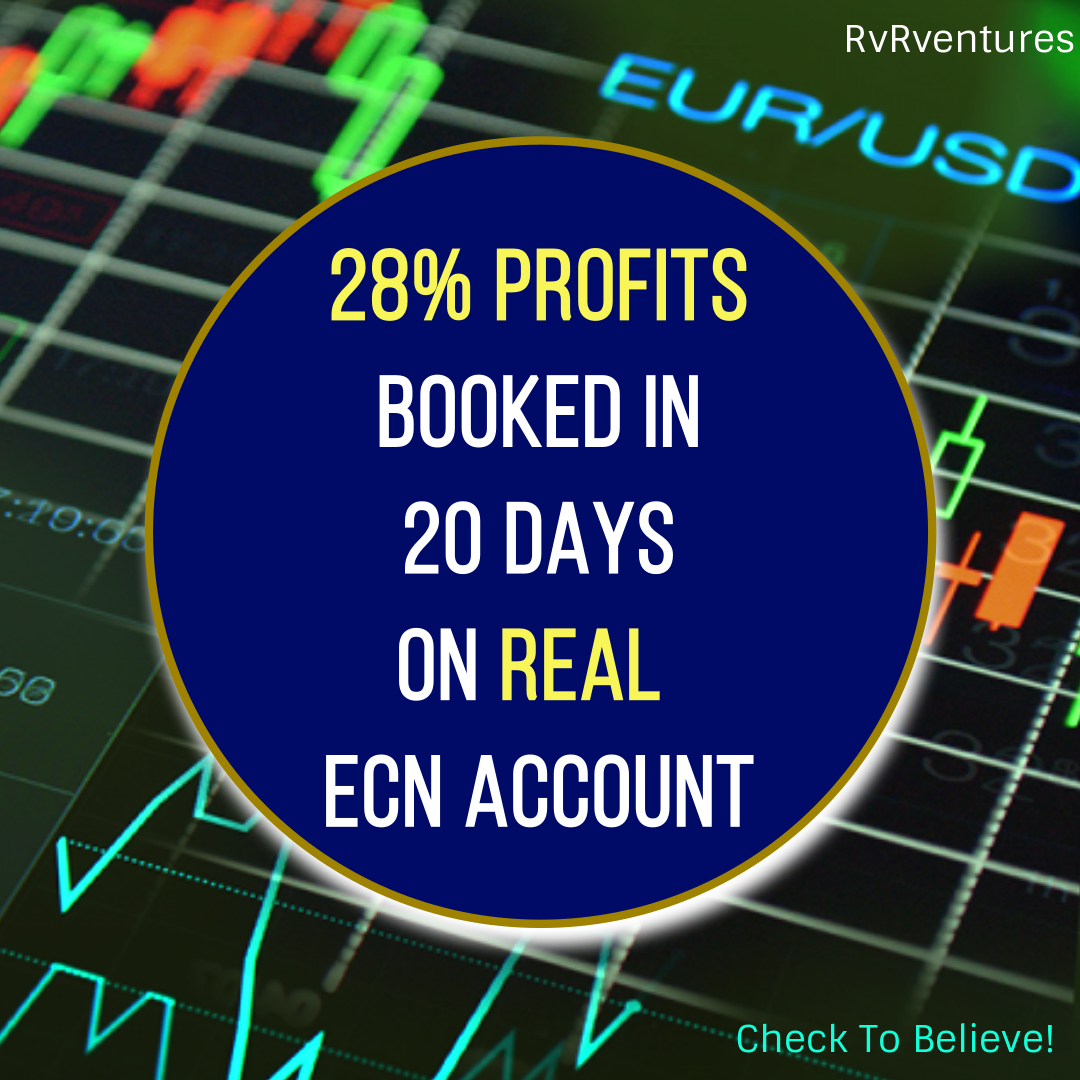
28% Profits booked in 20 Trading Days on Real ECN Account.
Check detailed LIVE Trading results on Myfxbook: myfxbook.com/ members/ RVRventures/ rvr001/ 2739856
You can simply copy our trades, and trade #Forex with ease.
Open YOUR account, under YOUR name with YOUR own money with YOUR complete control & share/pay profits only if YOU EARN. Simply copy the trades of RvR Ventures on LiteForex - Forex Broker's Trading Platform through Social Trading in a single click through the following simple steps:
1. Register your self at bit.ly/OpenFxAccount
2. Add minimum 10,000$ to your account
3. Choose to copy our trades at bit.ly/CopyTradesOfRvR
OR search @RvR under Traders, and choose to copy RvR
4. Get weekly reports of trading results.
5. Withdraw Profits, as and when you wish to.
6. We get paid only if you earn profits.
For more details, please WhatsApp at +971-581958582 or Email us at info@rvrventures.in
Invest as much as you can lose. #RvRventures #Forex #XAUSUSD #EURUSD #ForexTraders
Check detailed LIVE Trading results on Myfxbook: myfxbook.com/ members/ RVRventures/ rvr001/ 2739856
You can simply copy our trades, and trade #Forex with ease.
Open YOUR account, under YOUR name with YOUR own money with YOUR complete control & share/pay profits only if YOU EARN. Simply copy the trades of RvR Ventures on LiteForex - Forex Broker's Trading Platform through Social Trading in a single click through the following simple steps:
1. Register your self at bit.ly/OpenFxAccount
2. Add minimum 10,000$ to your account
3. Choose to copy our trades at bit.ly/CopyTradesOfRvR
OR search @RvR under Traders, and choose to copy RvR
4. Get weekly reports of trading results.
5. Withdraw Profits, as and when you wish to.
6. We get paid only if you earn profits.
For more details, please WhatsApp at +971-581958582 or Email us at info@rvrventures.in
Invest as much as you can lose. #RvRventures #Forex #XAUSUSD #EURUSD #ForexTraders

RvR Ventures
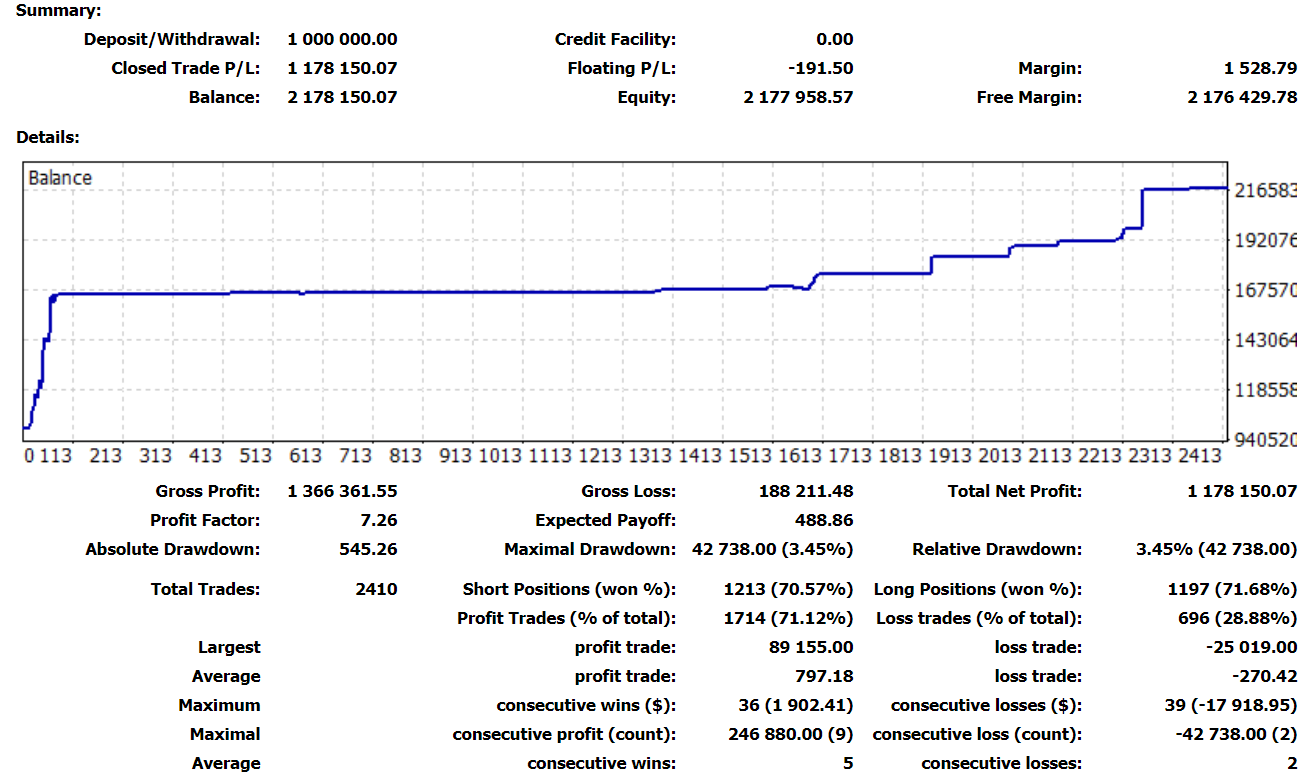
Most Accurate Forex Trading Robot | EURUSD | EURGBP | EURJPY | GBPJPY | XAUUSD | AUDUSD | NZDUSD
#RvREA #RvRventures #Forex #Trading #Robots #AiFxRobots
#RvREA #RvRventures #Forex #Trading #Robots #AiFxRobots

RvR Ventures
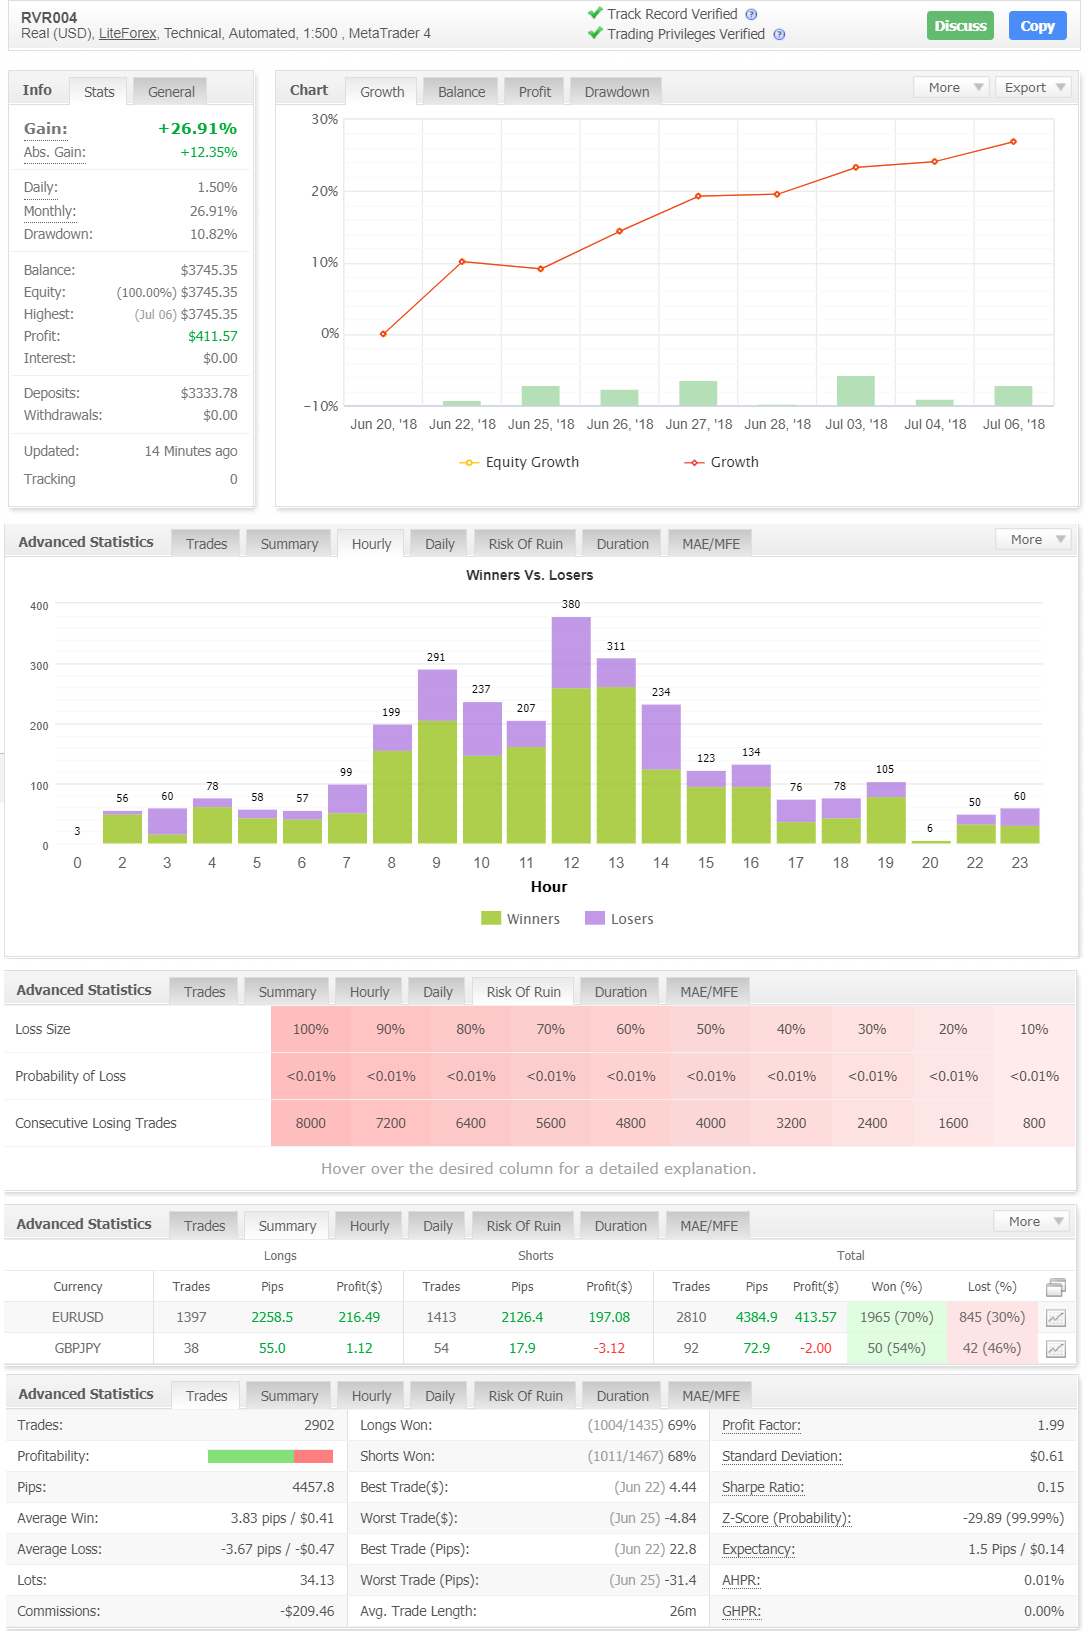
Gain: +26.91% | Abs. Gain:+12.35% | Daily Profit: 1.50% | Monthly Profit: 26.91%
Drawdown: 10.82% | Balance: $3745.35 | Equity:(100.00%) $3745.35
Profit: $411.57 | Interest: $0.00 | Deposits: $3333.78
#RvRventures | #ForexTrading | #EURUSD Forex Trading | Forex Traders
Drawdown: 10.82% | Balance: $3745.35 | Equity:(100.00%) $3745.35
Profit: $411.57 | Interest: $0.00 | Deposits: $3333.78
#RvRventures | #ForexTrading | #EURUSD Forex Trading | Forex Traders

RvR Ventures
Gain: +26.91%
Abs. Gain:+12.35%
Daily Profit: 1.50%
Monthly Profit: 26.91%
Drawdown: 10.82%
Balance: $3745.35
Equity:(100.00%) $3745.35
Floating Losses: 0
Profit: $411.57
Interest: $0.00
Deposits: $3333.78
Abs. Gain:+12.35%
Daily Profit: 1.50%
Monthly Profit: 26.91%
Drawdown: 10.82%
Balance: $3745.35
Equity:(100.00%) $3745.35
Floating Losses: 0
Profit: $411.57
Interest: $0.00
Deposits: $3333.78
RvR Ventures
How to trade XAUUSD | Spot Gold vs Dollar with 100% accuracy?
Some say that gold is one of the most difficult markets to trade and there is some truth to that – gold doesn’t move like other markets and if investors want to be successful in trading it (and it can be very rewarding), they have to keep several things in mind. Over the years of monitoring and analyzing the gold market we noticed many profitable rules and patterns. We successfully applied them and are still applying them for our precious metals trades.
Gold Can PUNISH Bad Trading: Oh boy, if you aren’t 100% good at identifying proper areas or the moves around them, gold can make you lose quickly and in both directions. Common mistakes like “shooting from the hip” by taking gut moves, or “revenge trading” which can usually be rectified after you calm down in forex, are usually too late to do anything about with gold. You need a plan, and HAVE to stick to it to even have a hope of success.
Keep the sizes of your gold, silver and mining stock trading positions small. The higher the chance of being correct, the bigger the position can be (that’s why sizes of long-term investments are bigger than sizes of short-term trades).
Pay attention to cycles and turning points – many markets have cyclical nature (for instance the USD Index and silver) and cycles can be a great help in the case of short- and long-term trades.
Check the efficiency of each indicator that you want to use on the gold market (or other markets) before applying it and trading real capital based on it.
Consider using RSI and Stochastic indicators for gold, silver and mining stocks as they have proven to be useful over many years. Other indicators can be useful as well, but be sure that you examine them before you decide to make trading decisions based on them.
If a given indicator works “almost as well” as you’d like it, but you see that it has potential, don’t be afraid to modify it. For example in case of RSI, you see good selling opportunities when this indicator moves to 65 or so instead of the classic 70 level) then it can be useful and profitable to either add additional overbought / oversold level, breaking which would generate a signal (in this case a sell signal) or to change the parameters of the indicator, deviating from the standard values.
Use moving averages only if they have been working for a given market in the past – if a given market has been ignoring a certain moving average, most likely so can you.
Keep track of the price seasonality – in our opinion its best to use True Seasonals as expiration of derivatives can also have an important impact on the price of gold, but if you can’t get access to them, it’s better to use regular seasonality than none at all.
Use trend lines and trend channels – they have often proven useful as support and resistance lines / levels in the case of gold, silver and mining stocks. The more significant lows or highs are used for creating a given trend line or channel, the stronger the support or resistance is.
The previous highs and lows can and often serve as support/ resistance levels as well – in the case of the precious metals market, the strength of the support / resistance is strength of the support / resistance created as rising or declining trend lines. The more significant the high or low is, the stronger the resistance or support.
Note that markets have not only a cyclical nature, but a fractal one, too. The rallies and declines are self-similar, which means that price patterns that we saw on a bigger scale are quite likely to be seen on a smaller scale (proportionately). This observation can be of great help when determining how low or how high gold, silver or mining stocks will move.
Pay attention to volume. The volume is a very important, yet often overlooked, piece of information. If a rally is accompanied by rising volume, then it’s likely a start of an even bigger rally. If a rally is accompanied by low or visibly declining volume, then it’s likely ending. If a decline is accompanied by high or rising volume (unless there is a day when the price visibly reverses), then the decline is likely to continue. If a decline is accompanied by low volume, then there are no meaningful implications (yes, the situation is not symmetrical in this case). The above are general guidelines, and before applying them to the current market situation, be sure to check if the above (the part of the above that currently represents the situation on the market) really worked in the way above – if it didn’t, then it’s generally better to expect the same type of reaction that previously accompanied a certain price/volume pattern.
Look for price formations (like a head and shoulders formation), but before you apply them (believe that a certain formation is “in play” and likely to cause a certain move which would cause you to enter or close a given trade) be sure to check if this kind of formation worked on this market previously. For instance “breakouts” (which are not a formation by themselves, but this example illustrates what we mean) in silver have quite often resulted in price declines (breakouts were invalidated) instead of rallies, so their real implications were the opposite of what one might have expected based on the classic definition of a breakout.
Wait for confirmations. It’s usually best to wait for breakouts / breakdowns confirmation before taking action. In the case of the precious metals market, based on our experience, it’s worth waiting for three consecutive closing prices below / above the critical price level before viewing the breakout / breakdown as “confirmed” and thus meaningful. Invalidation of a breakout is a bearish sign and invalidation of a breakdown is a bullish sign.
Analyze more than the market in which you want to trade. In today’s global economy no market can move totally independently. Gold and the rest of the precious metals sector are no exception – their price moves are often linked to the moves on the currency market, moves on the general stock market, interest rates, Fed’s comments, and performance of gold stocks and silver stocks are just the most important ones. Be sure to check what markets were moving in tune or in the opposite direction to gold before and make sure that their impact is likely to be supportive of the trading position that you are about to open. For example, if gold was moving in the exact opposite to the USD Index and you’re considering opening a long position – if you see that the USD Index is very close to a major resistance level and it’s already heavily overbought, then the odds are that the USD Index will top and contribute to or even trigger gold’s decline.
Analyze ratios. Of course, not just any ratios – the ratios that have proven to provide important signals for gold (like the gold stocks to gold ratio or gold to silver ratio – they both have a history of leading gold, but this has not been the case during the post-2011 decline), that are important due to fundamental factors (gold vs. bonds ratio – both can be seen as safe-haven assets and major bottoms and tops in this ratio take place along with major tops and bottoms in gold, so it can be used as a confirmation) or because they are often discussed (gold to oil ratio). Sometimes ratios can be utilized to see something from a non-USD perspective (gold to UDN ratio is the weighted average of gold priced in currencies other than the US dollar, with weights as in the USD Index – this ratio can be used to confirm major moves in gold or suggest that these moves are just temporary as they are only visible from the USD perspective).
Analyze other time-frames than the one that you’re focusing on. Even if you are placing a short-term trade, be sure to check the medium- and long-term trend. Generally, the longer the time frame, the stronger the support and resistance levels, so even if you analyzed the short-term picture, it can be the case that a given move will be stopped by a medium- or long-term resistance. If you’re focusing on the medium- or long-term trades, the short-term picture can help you fine-tune the moment of entering or exiting the market.
Be on the constant lookout for anomalies. When you see something odd, investigate and find the reason behind it and check if anything similar happened previously – if yes, check what happened next. If similar things were always followed by the same kind of price pattern in gold, silver and/or mining stocks, it might be a good idea to trade it. If not, then perhaps the reason behind the anomaly resulted in something else that had a more specific effect on the precious metals prices.
Monitor investor sentiment. If the vast majority (!) of precious metals investors and traders are bullish, then gold is likely close to a top (in this case it makes sense to look for selling signals and / or confirmations that the top is in and – if they are present – exit long positions and / or enter short ones). Conversely, if everyone and their brother is bearish on the market, then a bottom is very likely close to being in or already in. The ways to estimate sentiment include checking how often people look for gold-related terms (like “gold stocks”) in Google Trends, monitoring outcomes of surveys with questions like “where will gold price be in 3 months” and similar queries, and also checking the traffic of gold-related websites on Alexa. On a side note when you see that a certain, big gold-related website is very slow or crashes after a big move up or down, then it likely means that the traffic / interest in gold was enormous, which is another way of detecting that a major price extreme is well-nigh (we saw that in 2011 when gold topped).
Even if your primary approach is to trade gold, we still encourage you to consider dedicating a part of the capital to long-term investments – it should lower the overall variability of your returns and making gains more stable. There are also other benefits that we outlined in our very first report in which we discussed whether trading gold or investing in it is more profitable. Our gold portfolio report includes a sample portfolio for “Trader John”, which might serve as an example (of course, it’s not investment advice) of how traders could structure their portfolios and benefit from diversified strategies.
Before you decide to follow an analyst, be sure to check how long they have been in the business and if they are known for their good performance.
Check our 100% Accurate Trading on XAUUSD | Spot Gold vs Dollar on Myfxbook .com / members / rvrventures

RvR Ventures
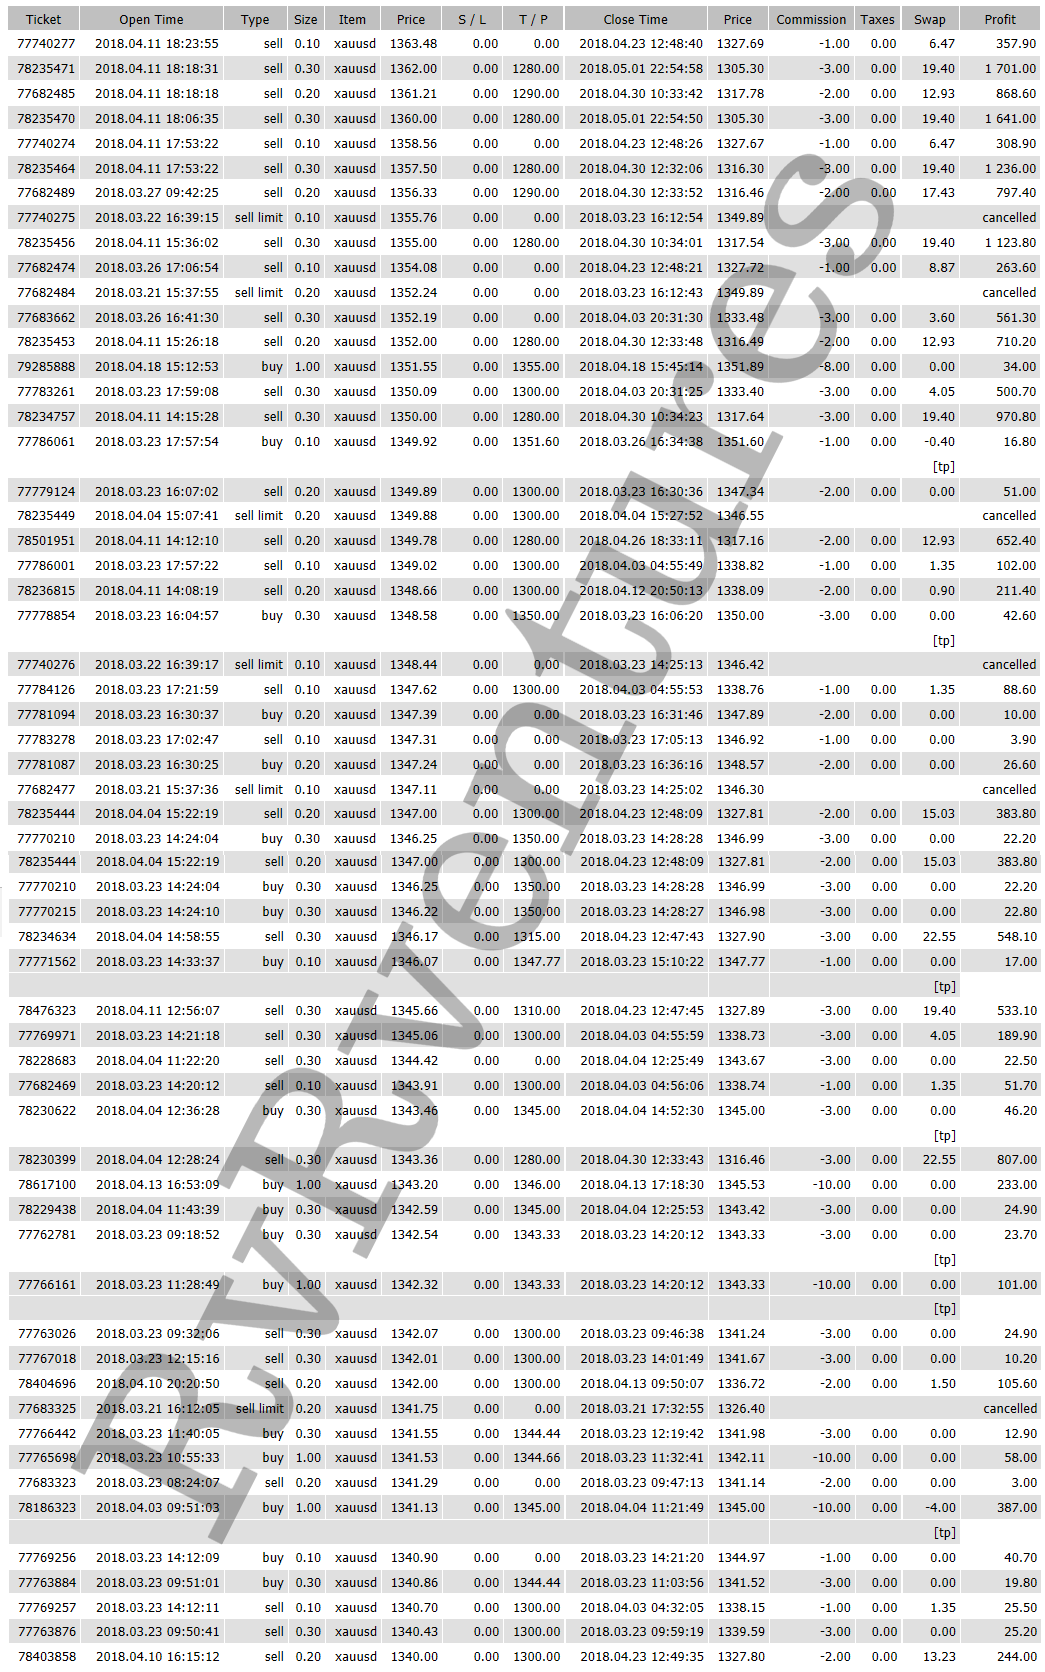
How to trade XAUUSD | Spot Gold vs Dollar with 100% accuracy?
Some say that gold is one of the most difficult markets to trade and there is some truth to that – gold doesn’t move like other markets and if investors want to be successful in trading it (and it can be very rewarding), they have to keep several things in mind. Over the years of monitoring and analyzing the gold market we noticed many profitable rules and patterns. We successfully applied them and are still applying them for our precious metals trades.
Gold Can PUNISH Bad Trading: Oh boy, if you aren’t 100% good at identifying proper areas or the moves around them, gold can make you lose quickly and in both directions. Common mistakes like “shooting from the hip” by taking gut moves, or “revenge trading” which can usually be rectified after you calm down in forex, are usually too late to do anything about with gold. You need a plan, and HAVE to stick to it to even have a hope of success.
Keep the sizes of your gold, silver and mining stock trading positions small. The higher the chance of being correct, the bigger the position can be (that’s why sizes of long-term investments are bigger than sizes of short-term trades).
Pay attention to cycles and turning points – many markets have cyclical nature (for instance the USD Index and silver) and cycles can be a great help in the case of short- and long-term trades.
Check the efficiency of each indicator that you want to use on the gold market (or other markets) before applying it and trading real capital based on it.
Consider using RSI and Stochastic indicators for gold, silver and mining stocks as they have proven to be useful over many years. Other indicators can be useful as well, but be sure that you examine them before you decide to make trading decisions based on them.
If a given indicator works “almost as well” as you’d like it, but you see that it has potential, don’t be afraid to modify it. For example in case of RSI, you see good selling opportunities when this indicator moves to 65 or so instead of the classic 70 level) then it can be useful and profitable to either add additional overbought / oversold level, breaking which would generate a signal (in this case a sell signal) or to change the parameters of the indicator, deviating from the standard values.
Use moving averages only if they have been working for a given market in the past – if a given market has been ignoring a certain moving average, most likely so can you.
Keep track of the price seasonality – in our opinion its best to use True Seasonals as expiration of derivatives can also have an important impact on the price of gold, but if you can’t get access to them, it’s better to use regular seasonality than none at all.
Use trend lines and trend channels – they have often proven useful as support and resistance lines / levels in the case of gold, silver and mining stocks. The more significant lows or highs are used for creating a given trend line or channel, the stronger the support or resistance is.
The previous highs and lows can and often serve as support/ resistance levels as well – in the case of the precious metals market, the strength of the support / resistance is strength of the support / resistance created as rising or declining trend lines. The more significant the high or low is, the stronger the resistance or support.
Note that markets have not only a cyclical nature, but a fractal one, too. The rallies and declines are self-similar, which means that price patterns that we saw on a bigger scale are quite likely to be seen on a smaller scale (proportionately). This observation can be of great help when determining how low or how high gold, silver or mining stocks will move.
Pay attention to volume. The volume is a very important, yet often overlooked, piece of information. If a rally is accompanied by rising volume, then it’s likely a start of an even bigger rally. If a rally is accompanied by low or visibly declining volume, then it’s likely ending. If a decline is accompanied by high or rising volume (unless there is a day when the price visibly reverses), then the decline is likely to continue. If a decline is accompanied by low volume, then there are no meaningful implications (yes, the situation is not symmetrical in this case). The above are general guidelines, and before applying them to the current market situation, be sure to check if the above (the part of the above that currently represents the situation on the market) really worked in the way above – if it didn’t, then it’s generally better to expect the same type of reaction that previously accompanied a certain price/volume pattern.
Look for price formations (like a head and shoulders formation), but before you apply them (believe that a certain formation is “in play” and likely to cause a certain move which would cause you to enter or close a given trade) be sure to check if this kind of formation worked on this market previously. For instance “breakouts” (which are not a formation by themselves, but this example illustrates what we mean) in silver have quite often resulted in price declines (breakouts were invalidated) instead of rallies, so their real implications were the opposite of what one might have expected based on the classic definition of a breakout.
Wait for confirmations. It’s usually best to wait for breakouts / breakdowns confirmation before taking action. In the case of the precious metals market, based on our experience, it’s worth waiting for three consecutive closing prices below / above the critical price level before viewing the breakout / breakdown as “confirmed” and thus meaningful. Invalidation of a breakout is a bearish sign and invalidation of a breakdown is a bullish sign.
Analyze more than the market in which you want to trade. In today’s global economy no market can move totally independently. Gold and the rest of the precious metals sector are no exception – their price moves are often linked to the moves on the currency market, moves on the general stock market, interest rates, Fed’s comments, and performance of gold stocks and silver stocks are just the most important ones. Be sure to check what markets were moving in tune or in the opposite direction to gold before and make sure that their impact is likely to be supportive of the trading position that you are about to open. For example, if gold was moving in the exact opposite to the USD Index and you’re considering opening a long position – if you see that the USD Index is very close to a major resistance level and it’s already heavily overbought, then the odds are that the USD Index will top and contribute to or even trigger gold’s decline.
Analyze ratios. Of course, not just any ratios – the ratios that have proven to provide important signals for gold (like the gold stocks to gold ratio or gold to silver ratio – they both have a history of leading gold, but this has not been the case during the post-2011 decline), that are important due to fundamental factors (gold vs. bonds ratio – both can be seen as safe-haven assets and major bottoms and tops in this ratio take place along with major tops and bottoms in gold, so it can be used as a confirmation) or because they are often discussed (gold to oil ratio). Sometimes ratios can be utilized to see something from a non-USD perspective (gold to UDN ratio is the weighted average of gold priced in currencies other than the US dollar, with weights as in the USD Index – this ratio can be used to confirm major moves in gold or suggest that these moves are just temporary as they are only visible from the USD perspective).
Analyze other time-frames than the one that you’re focusing on. Even if you are placing a short-term trade, be sure to check the medium- and long-term trend. Generally, the longer the time frame, the stronger the support and resistance levels, so even if you analyzed the short-term picture, it can be the case that a given move will be stopped by a medium- or long-term resistance. If you’re focusing on the medium- or long-term trades, the short-term picture can help you fine-tune the moment of entering or exiting the market.
Be on the constant lookout for anomalies. When you see something odd, investigate and find the reason behind it and check if anything similar happened previously – if yes, check what happened next. If similar things were always followed by the same kind of price pattern in gold, silver and/or mining stocks, it might be a good idea to trade it. If not, then perhaps the reason behind the anomaly resulted in something else that had a more specific effect on the precious metals prices.
Monitor investor sentiment. If the vast majority (!) of precious metals investors and traders are bullish, then gold is likely close to a top (in this case it makes sense to look for selling signals and / or confirmations that the top is in and – if they are present – exit long positions and / or enter short ones). Conversely, if everyone and their brother is bearish on the market, then a bottom is very likely close to being in or already in. The ways to estimate sentiment include checking how often people look for gold-related terms (like “gold stocks”) in Google Trends, monitoring outcomes of surveys with questions like “where will gold price be in 3 months” and similar queries, and also checking the traffic of gold-related websites on Alexa. On a side note when you see that a certain, big gold-related website is very slow or crashes after a big move up or down, then it likely means that the traffic / interest in gold was enormous, which is another way of detecting that a major price extreme is well-nigh (we saw that in 2011 when gold topped).
Even if your primary approach is to trade gold, we still encourage you to consider dedicating a part of the capital to long-term investments – it should lower the overall variability of your returns and making gains more stable. There are also other benefits that we outlined in our very first report in which we discussed whether trading gold or investing in it is more profitable. Our gold portfolio report includes a sample portfolio for “Trader John”, which might serve as an example (of course, it’s not investment advice) of how traders could structure their portfolios and benefit from diversified strategies.
Before you decide to follow an analyst, be sure to check how long they have been in the business and if they are known for their good performance.
Check our 100% Accurate Trading on XAUUSD | Spot Gold vs Dollar on Myfxbook .com / members / rvrventures
Some say that gold is one of the most difficult markets to trade and there is some truth to that – gold doesn’t move like other markets and if investors want to be successful in trading it (and it can be very rewarding), they have to keep several things in mind. Over the years of monitoring and analyzing the gold market we noticed many profitable rules and patterns. We successfully applied them and are still applying them for our precious metals trades.
Gold Can PUNISH Bad Trading: Oh boy, if you aren’t 100% good at identifying proper areas or the moves around them, gold can make you lose quickly and in both directions. Common mistakes like “shooting from the hip” by taking gut moves, or “revenge trading” which can usually be rectified after you calm down in forex, are usually too late to do anything about with gold. You need a plan, and HAVE to stick to it to even have a hope of success.
Keep the sizes of your gold, silver and mining stock trading positions small. The higher the chance of being correct, the bigger the position can be (that’s why sizes of long-term investments are bigger than sizes of short-term trades).
Pay attention to cycles and turning points – many markets have cyclical nature (for instance the USD Index and silver) and cycles can be a great help in the case of short- and long-term trades.
Check the efficiency of each indicator that you want to use on the gold market (or other markets) before applying it and trading real capital based on it.
Consider using RSI and Stochastic indicators for gold, silver and mining stocks as they have proven to be useful over many years. Other indicators can be useful as well, but be sure that you examine them before you decide to make trading decisions based on them.
If a given indicator works “almost as well” as you’d like it, but you see that it has potential, don’t be afraid to modify it. For example in case of RSI, you see good selling opportunities when this indicator moves to 65 or so instead of the classic 70 level) then it can be useful and profitable to either add additional overbought / oversold level, breaking which would generate a signal (in this case a sell signal) or to change the parameters of the indicator, deviating from the standard values.
Use moving averages only if they have been working for a given market in the past – if a given market has been ignoring a certain moving average, most likely so can you.
Keep track of the price seasonality – in our opinion its best to use True Seasonals as expiration of derivatives can also have an important impact on the price of gold, but if you can’t get access to them, it’s better to use regular seasonality than none at all.
Use trend lines and trend channels – they have often proven useful as support and resistance lines / levels in the case of gold, silver and mining stocks. The more significant lows or highs are used for creating a given trend line or channel, the stronger the support or resistance is.
The previous highs and lows can and often serve as support/ resistance levels as well – in the case of the precious metals market, the strength of the support / resistance is strength of the support / resistance created as rising or declining trend lines. The more significant the high or low is, the stronger the resistance or support.
Note that markets have not only a cyclical nature, but a fractal one, too. The rallies and declines are self-similar, which means that price patterns that we saw on a bigger scale are quite likely to be seen on a smaller scale (proportionately). This observation can be of great help when determining how low or how high gold, silver or mining stocks will move.
Pay attention to volume. The volume is a very important, yet often overlooked, piece of information. If a rally is accompanied by rising volume, then it’s likely a start of an even bigger rally. If a rally is accompanied by low or visibly declining volume, then it’s likely ending. If a decline is accompanied by high or rising volume (unless there is a day when the price visibly reverses), then the decline is likely to continue. If a decline is accompanied by low volume, then there are no meaningful implications (yes, the situation is not symmetrical in this case). The above are general guidelines, and before applying them to the current market situation, be sure to check if the above (the part of the above that currently represents the situation on the market) really worked in the way above – if it didn’t, then it’s generally better to expect the same type of reaction that previously accompanied a certain price/volume pattern.
Look for price formations (like a head and shoulders formation), but before you apply them (believe that a certain formation is “in play” and likely to cause a certain move which would cause you to enter or close a given trade) be sure to check if this kind of formation worked on this market previously. For instance “breakouts” (which are not a formation by themselves, but this example illustrates what we mean) in silver have quite often resulted in price declines (breakouts were invalidated) instead of rallies, so their real implications were the opposite of what one might have expected based on the classic definition of a breakout.
Wait for confirmations. It’s usually best to wait for breakouts / breakdowns confirmation before taking action. In the case of the precious metals market, based on our experience, it’s worth waiting for three consecutive closing prices below / above the critical price level before viewing the breakout / breakdown as “confirmed” and thus meaningful. Invalidation of a breakout is a bearish sign and invalidation of a breakdown is a bullish sign.
Analyze more than the market in which you want to trade. In today’s global economy no market can move totally independently. Gold and the rest of the precious metals sector are no exception – their price moves are often linked to the moves on the currency market, moves on the general stock market, interest rates, Fed’s comments, and performance of gold stocks and silver stocks are just the most important ones. Be sure to check what markets were moving in tune or in the opposite direction to gold before and make sure that their impact is likely to be supportive of the trading position that you are about to open. For example, if gold was moving in the exact opposite to the USD Index and you’re considering opening a long position – if you see that the USD Index is very close to a major resistance level and it’s already heavily overbought, then the odds are that the USD Index will top and contribute to or even trigger gold’s decline.
Analyze ratios. Of course, not just any ratios – the ratios that have proven to provide important signals for gold (like the gold stocks to gold ratio or gold to silver ratio – they both have a history of leading gold, but this has not been the case during the post-2011 decline), that are important due to fundamental factors (gold vs. bonds ratio – both can be seen as safe-haven assets and major bottoms and tops in this ratio take place along with major tops and bottoms in gold, so it can be used as a confirmation) or because they are often discussed (gold to oil ratio). Sometimes ratios can be utilized to see something from a non-USD perspective (gold to UDN ratio is the weighted average of gold priced in currencies other than the US dollar, with weights as in the USD Index – this ratio can be used to confirm major moves in gold or suggest that these moves are just temporary as they are only visible from the USD perspective).
Analyze other time-frames than the one that you’re focusing on. Even if you are placing a short-term trade, be sure to check the medium- and long-term trend. Generally, the longer the time frame, the stronger the support and resistance levels, so even if you analyzed the short-term picture, it can be the case that a given move will be stopped by a medium- or long-term resistance. If you’re focusing on the medium- or long-term trades, the short-term picture can help you fine-tune the moment of entering or exiting the market.
Be on the constant lookout for anomalies. When you see something odd, investigate and find the reason behind it and check if anything similar happened previously – if yes, check what happened next. If similar things were always followed by the same kind of price pattern in gold, silver and/or mining stocks, it might be a good idea to trade it. If not, then perhaps the reason behind the anomaly resulted in something else that had a more specific effect on the precious metals prices.
Monitor investor sentiment. If the vast majority (!) of precious metals investors and traders are bullish, then gold is likely close to a top (in this case it makes sense to look for selling signals and / or confirmations that the top is in and – if they are present – exit long positions and / or enter short ones). Conversely, if everyone and their brother is bearish on the market, then a bottom is very likely close to being in or already in. The ways to estimate sentiment include checking how often people look for gold-related terms (like “gold stocks”) in Google Trends, monitoring outcomes of surveys with questions like “where will gold price be in 3 months” and similar queries, and also checking the traffic of gold-related websites on Alexa. On a side note when you see that a certain, big gold-related website is very slow or crashes after a big move up or down, then it likely means that the traffic / interest in gold was enormous, which is another way of detecting that a major price extreme is well-nigh (we saw that in 2011 when gold topped).
Even if your primary approach is to trade gold, we still encourage you to consider dedicating a part of the capital to long-term investments – it should lower the overall variability of your returns and making gains more stable. There are also other benefits that we outlined in our very first report in which we discussed whether trading gold or investing in it is more profitable. Our gold portfolio report includes a sample portfolio for “Trader John”, which might serve as an example (of course, it’s not investment advice) of how traders could structure their portfolios and benefit from diversified strategies.
Before you decide to follow an analyst, be sure to check how long they have been in the business and if they are known for their good performance.
Check our 100% Accurate Trading on XAUUSD | Spot Gold vs Dollar on Myfxbook .com / members / rvrventures

RvR Ventures
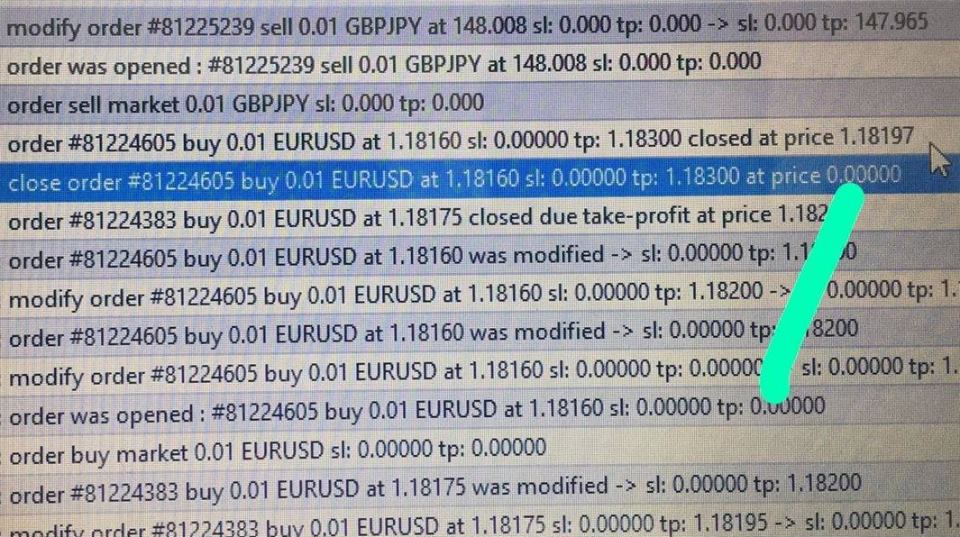
#ThisIsHow #ForexBrokers earn money.
Their trading teams log in / trade on your accounts without your permission, not only this they also temper the logs & manipulate the price in tickets & logs. Otherwise how can be an order closed at 0.00000 Price with TP set at 1.18300?
#Forex #Fraud #Scam #ForexBrokers #ForexScams #Scams
Their trading teams log in / trade on your accounts without your permission, not only this they also temper the logs & manipulate the price in tickets & logs. Otherwise how can be an order closed at 0.00000 Price with TP set at 1.18300?
#Forex #Fraud #Scam #ForexBrokers #ForexScams #Scams

RvR Ventures
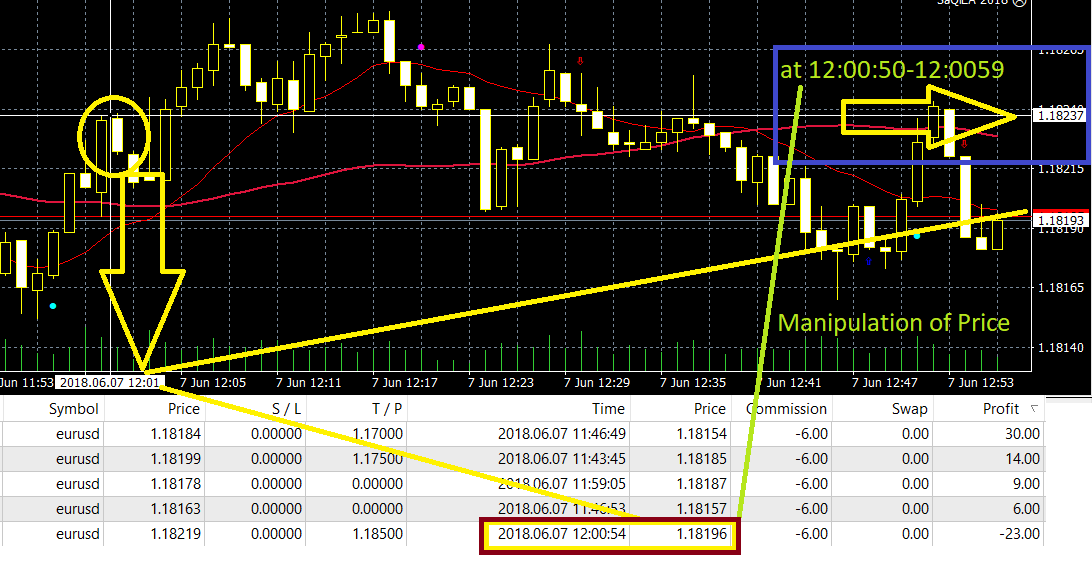
This is how price, real charts and trading tickets are manipulated by Forex Companies, to hurt clients.
At the time of booking orders, Price was 1.18237 at 12:00:50 - 12:00:59, however ticket was booked at 1.18197 which cannot be price by any chance, to mark a loss of -23$ on the name of customer. That's how Forex companies earn money - by cheating their clients!!
#StayAlert #ForexFraud #Manipulation #Scam #ForexBrokers #ForexCompanies

RvR Ventures
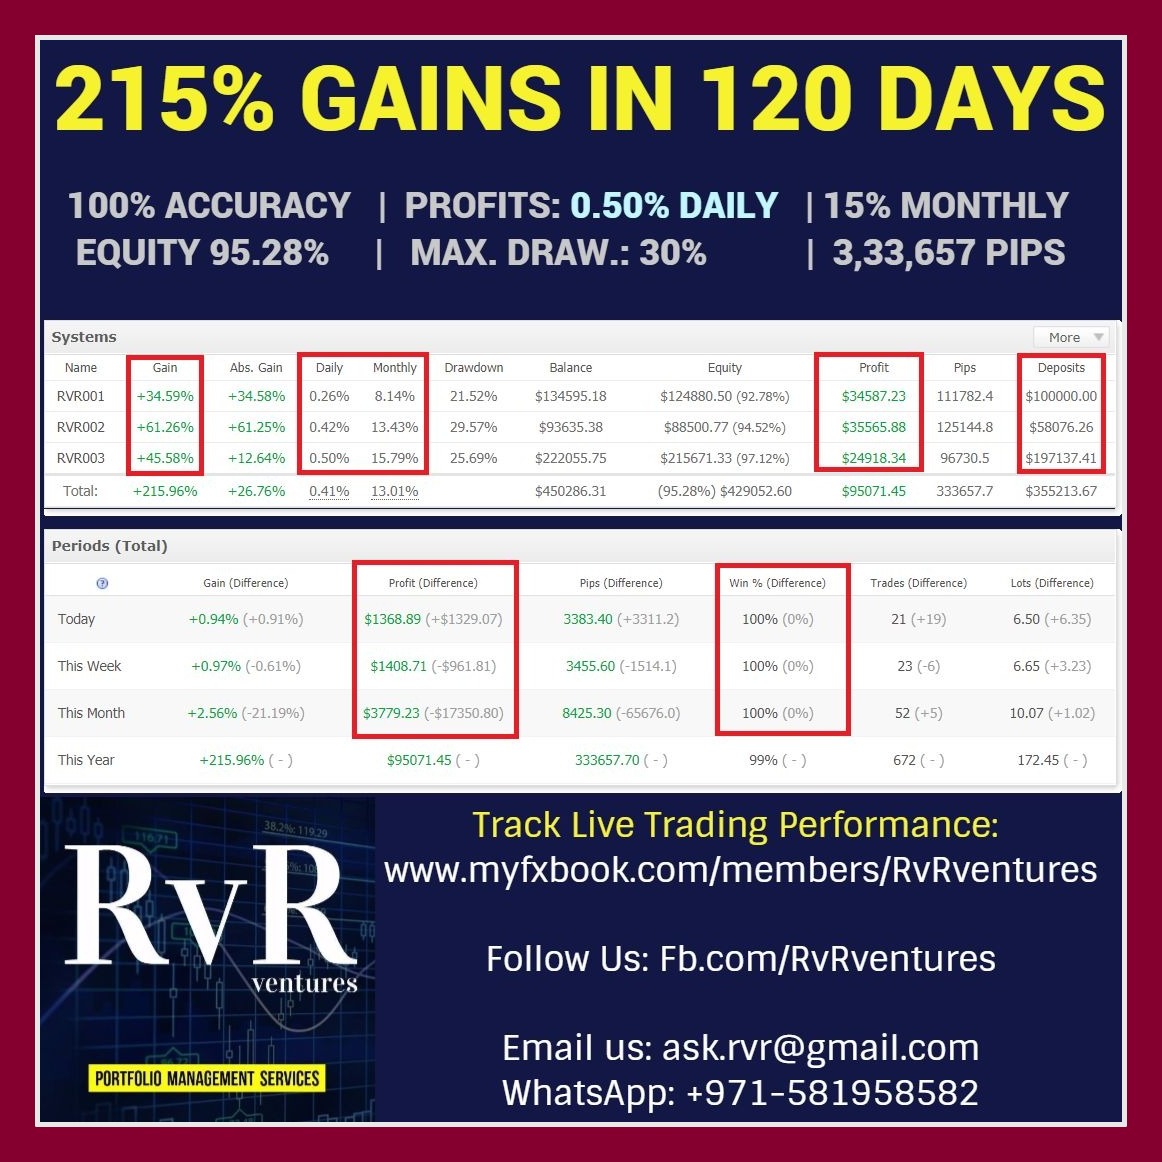
215% Profits Booked in 120 Trading Days | #RvRventures
100% accuracy | Profits: 0.50% daily | 15% monthly
Equity 95.28% | Max. draw.: 30% | 3,33,657 PIPS
Live Performance: myfxbook.com/members/RvRventures
100% accuracy | Profits: 0.50% daily | 15% monthly
Equity 95.28% | Max. draw.: 30% | 3,33,657 PIPS
Live Performance: myfxbook.com/members/RvRventures

RvR Ventures

43% Profits in 34 Trading Days || 60% Profits in 70 Trading Days.
Track Live... Our Trading Performance at Myfxbook:
Track Live... Our Trading Performance at Myfxbook:

RvR Ventures

67,000$ profit booked in 67 Trading Days on Real ECN A/C.
Trading Pairs: XAUUSD GBPCAD GBPJPY USDJPY EURUSD
No Robots. No EA. No Signals. Purely Manual Trading.
Check LIVE & Verified Trading Performance at: myfxbook.com/members/rvrventures
#ForexTrading #Forex #ForexTraders #RvRventures #RPMG
Trading Pairs: XAUUSD GBPCAD GBPJPY USDJPY EURUSD
No Robots. No EA. No Signals. Purely Manual Trading.
Check LIVE & Verified Trading Performance at: myfxbook.com/members/rvrventures
#ForexTrading #Forex #ForexTraders #RvRventures #RPMG

RvR Ventures
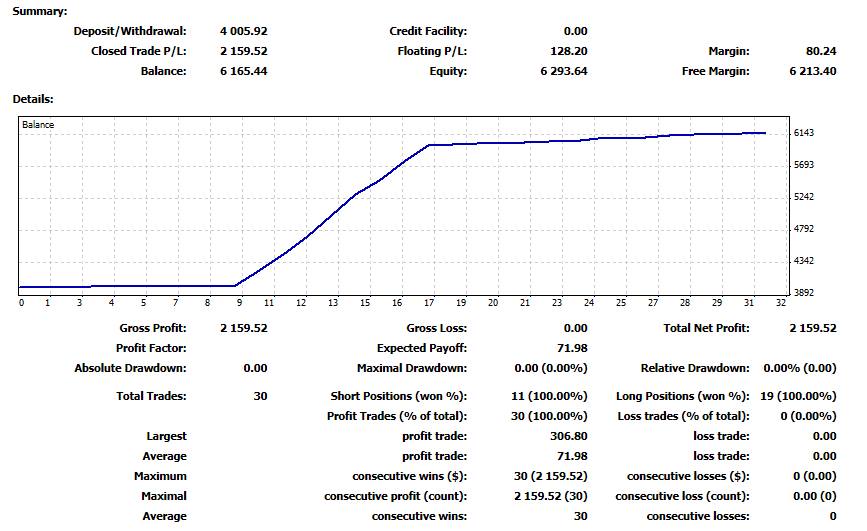
53% profits booked in 14 trading days. #NoRobots
Follow us at Https://www.FB.com/RvRventures | Join our Telegram channel: https://t.me/ForexFundManagers
#RvRventures | #ForexTrading| XAUUSD | GBPJPY | #Forex
Follow us at Https://www.FB.com/RvRventures | Join our Telegram channel: https://t.me/ForexFundManagers
#RvRventures | #ForexTrading| XAUUSD | GBPJPY | #Forex

RvR Ventures
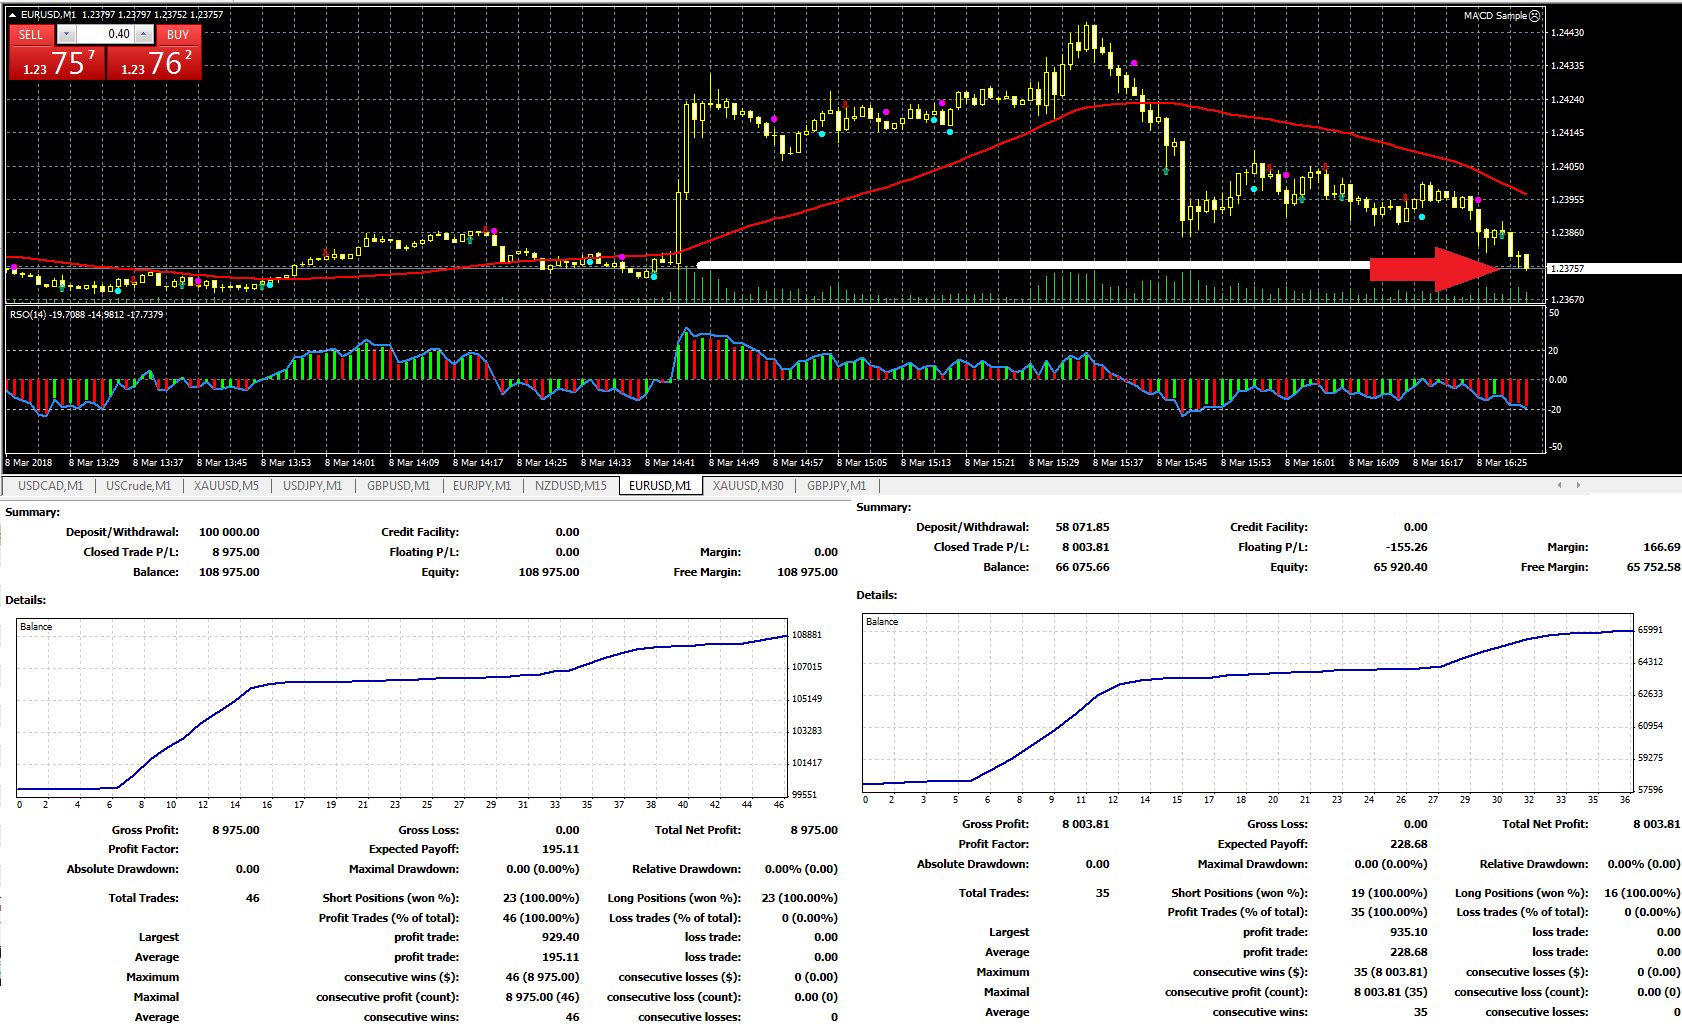
16975$ Profit booked in 13 trading days in 2 Real ECN accounts. Account size: 58000 $ & 100,000$ | %: 10% & 14% profits booked. Total trade: 81 | Profit trades: 81 | 100% accuracy | Drawdown: 0.00% | Expected Pay off: 195.11 & 228.68
Follow us at FB.com/RvRventures | Join our Telegram channel: https://t.me/ForexFundManagers
#RvRventures | #ForexTrading| XAUUSD | GBPJPY | #Forex
Follow us at FB.com/RvRventures | Join our Telegram channel: https://t.me/ForexFundManagers
#RvRventures | #ForexTrading| XAUUSD | GBPJPY | #Forex

RvR Ventures
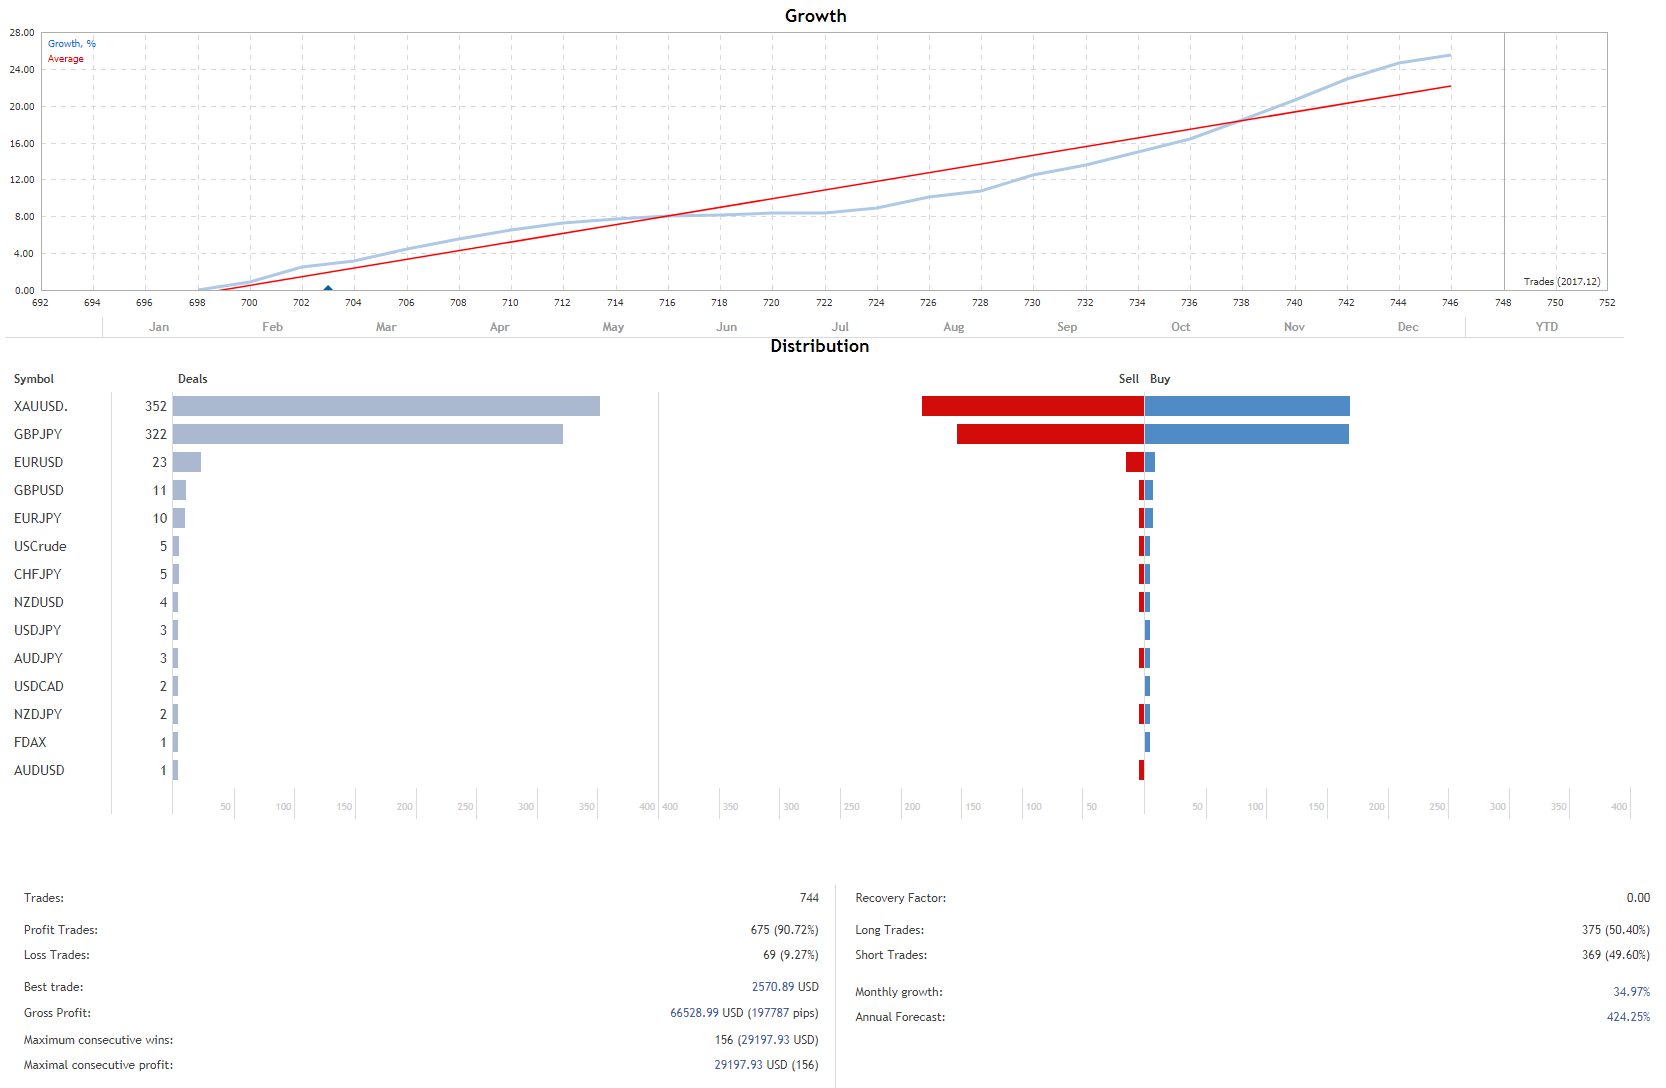
Here are the annual results of our Forex Trading Strategy:
Gross Profit Booked in 2017: 66,528 $
Profit Trades: 675 (91%) | Loss Trades: 69 (9%)
Monthly Growth: 34% | Annual Forecast: 424%
Long Trades: 375 | Short Trades: 369
Best Trade: 2570$ Maximum Consecutive Wins: 156
#RvRVentures | Portfolio RVR001 | www.FB.com/RvRventures
Validated Profile: https://www.mql5.com/en/users/rvr9669

RvR Ventures
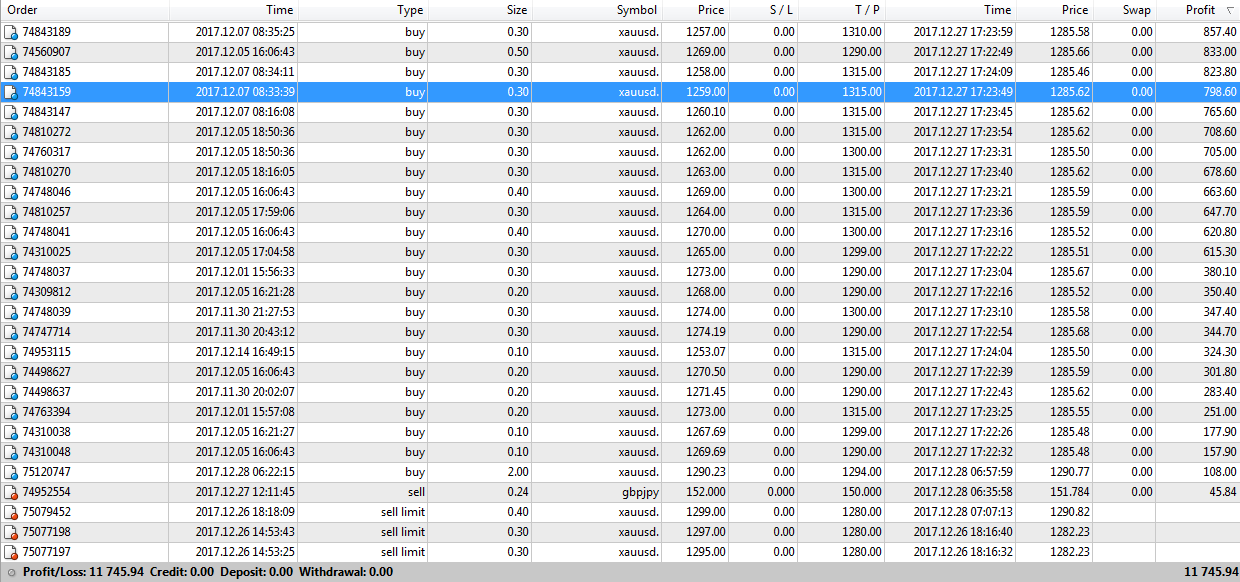
Profit Booked: 11,700$ | Total Trades: 25 trades | Accuracy: 100%
XAUUSD | No Robots | Manual Trading | No Signals | Potfolio: 45000 $
#RvRventures | #RvR | #ForexTrading | #Forex #Traders | www.FB.com/RvRventures
Join our Telegram channel: https://t.me/ForexFundManagers
XAUUSD | No Robots | Manual Trading | No Signals | Potfolio: 45000 $
#RvRventures | #RvR | #ForexTrading | #Forex #Traders | www.FB.com/RvRventures
Join our Telegram channel: https://t.me/ForexFundManagers

RvR Ventures
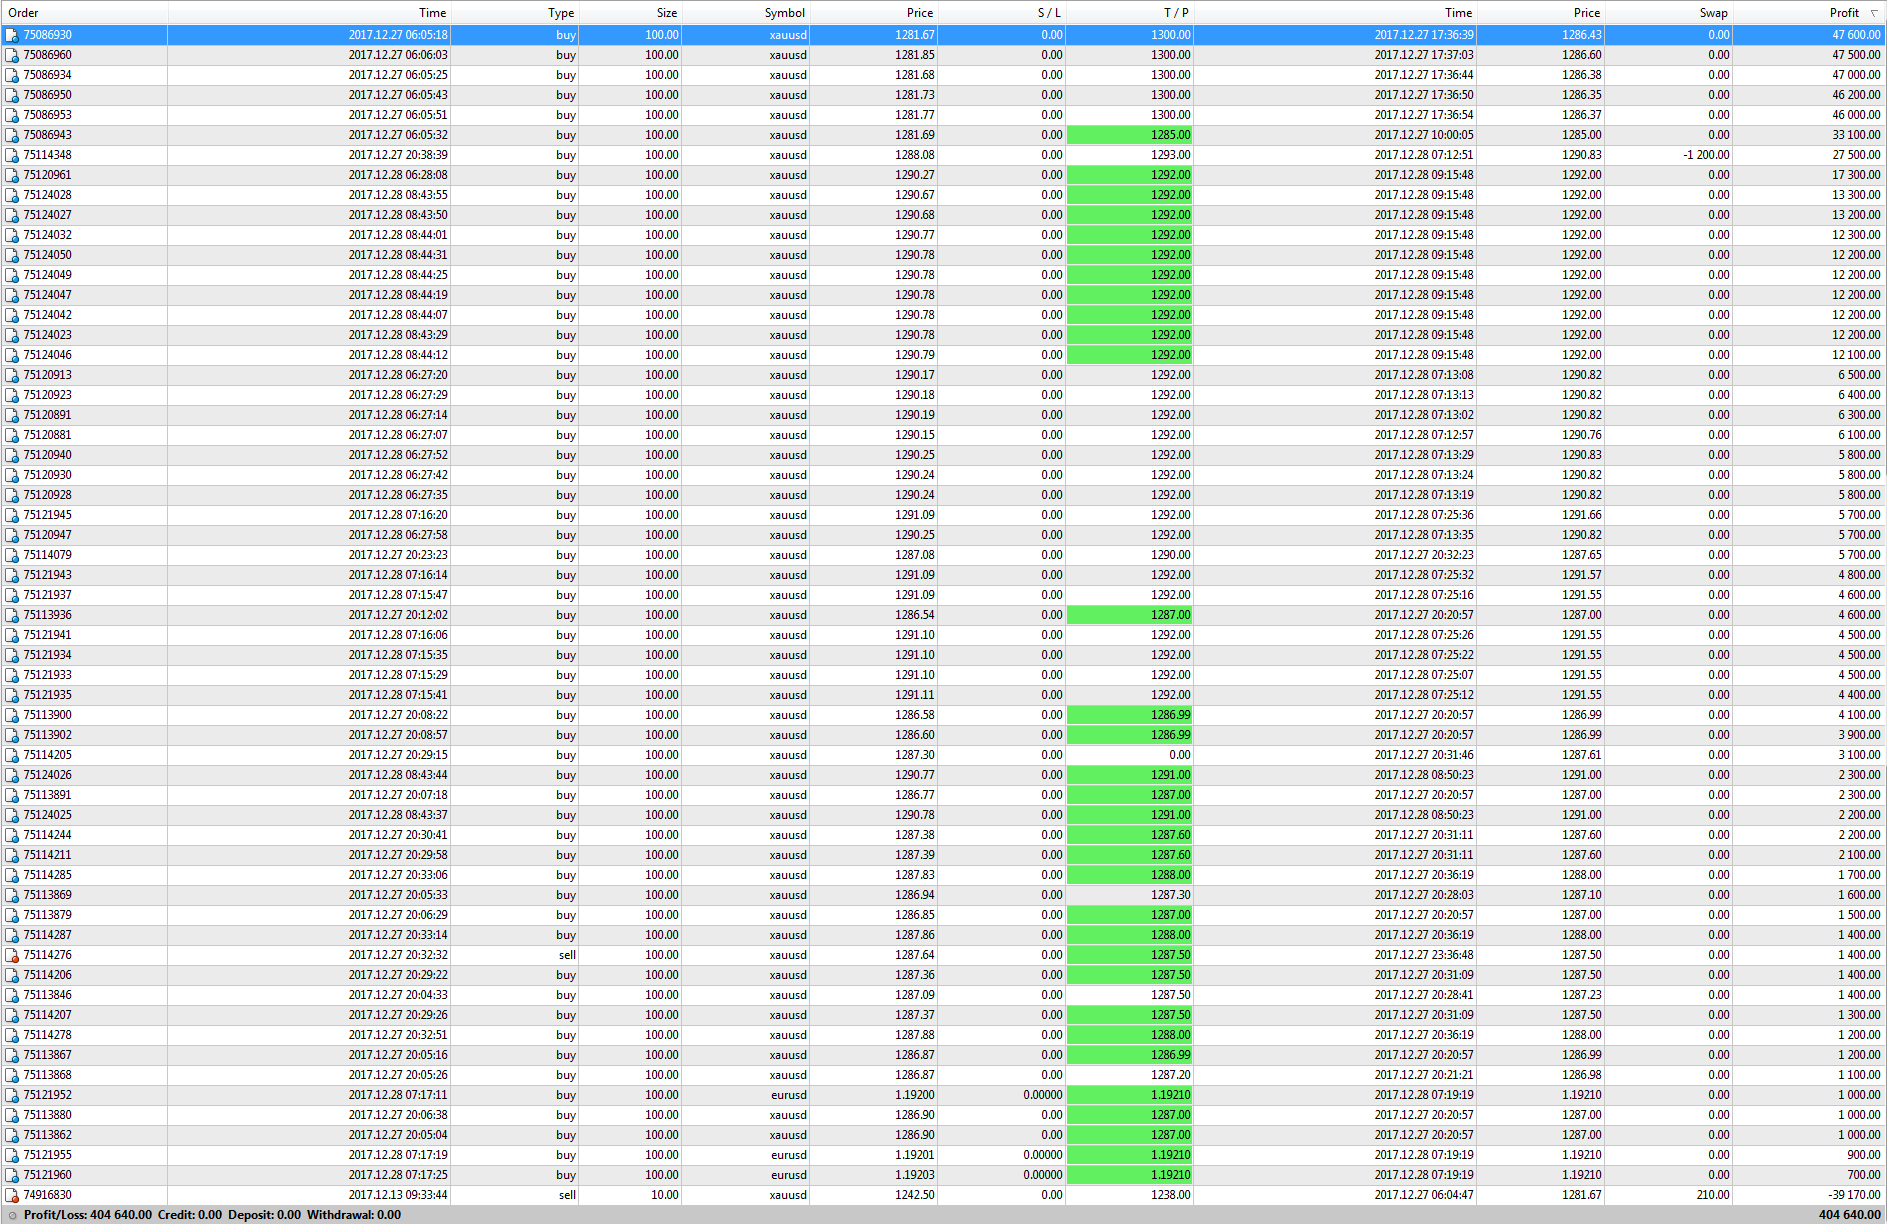
Profit Booked: 4,04,000$ | Total Trades: 60 trades | Accuracy: 99%
XAUUSD | EURUSD | No Robots | Manual Trading | No Signals
#RvRventures | #RvR | #ForexTrading | #Forex #Traders | FB.com/RvRventures
XAUUSD | EURUSD | No Robots | Manual Trading | No Signals
#RvRventures | #RvR | #ForexTrading | #Forex #Traders | FB.com/RvRventures

: