B Ravi Shankar / 販売者
パブリッシュされたプロダクト
MACD EXPLANATION Moving average convergence divergence (MACD, or MAC-D) is a trend-following momentum indicator that shows the relationship between two exponential moving averages (EMA's) of a price. The MACD is calculated by subtracting the 26-period exponential moving average (EMA) from the 12-period EMA. macd is one of the best momentum indicators macd is used by a lot of professional traders when it comes to continuous trade macd is the best choice if used properly even a ne
The Bollinger Band is a strategy that has become one of the most useful tools for spotlighting extreme short-term price moves. Bollinger Bands consist of a centerline and two price channels or bands above and below it. The centerline is typically a simple moving average while the price channels are the standard deviations of the stock being studied. The bands expand and contract as the price action of an issue becomes volatile (expansion) or becomes bound into a tight trading pattern (c
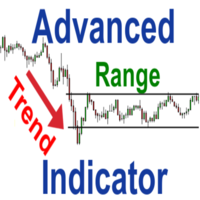
Advanced Trend Or Range Identifier Introductory offer for First 50 downloads "50% OFF" Finally the wait is over. As the Old Quote says "Trend is your Friend". For Every newbie traders as well as seasoned traders predicting when the price trends or ranges is mind blowing problem. After going a long long experiments we created a indicators with advanced formula's to pin point the ranging and trending markets. Very easy to use indicators. No settings has to be changed. if at all if you want to o

This is a unique expert advisor which Uses multi time frame analysis for trading and most importantly this EA Uses Bill Williams Accelerator oscillator indicator which is unique by itself a it is a leading indicator which helps us to enter into a trade much earlier than others.
This EA is designed in a way that it is user friendly and has lot of trailing option . It Trails by points , Trails by moving average of the traders choice and also can choose to time fram

リスク管理/資金管理ツール
これは、すべてのトレーダーがツールボックスに入れる必要のあるユニークなツールです。
世界で最高のトレーダーは、適切なお金の管理なしでは外国為替で成功することはできません。同様に、初心者のトレーダーは適切なお金の管理で彼のアカウントを爆破しません。もちろん、適切なお金の管理またはリスク管理に従う人は成功したトレーダーになります 。
このツールは非常に使いやすく、ユーザーはストップロスレベルを調整し、チャート自体から注文の利益レベルを取得できるため、特別なものです。
このツールの使用方法に関する完全なビデオがYouTubeにアップロードされており、リンクは以下のとおりです。 このツールを使用して、ビデオを視聴し、注文するための練習を非常に簡単に行うことができます。
https://youtu.be/_c7nj7jlXZE
このツールはエキスパートアドバイザーとして使用するために用意されているので、エキスパートフォルダーに配置することを忘れないでください
また、誰かが専門的な方法で外国為替を学びたい場合は、以下
Hide or Show Objects Clean chart Indicator This is a unique indicator that every trader will wish to have in their tool box. When we analyze a chart we will use many objects such as trend lines, support and resistance line, vertical lines,rectangular boxes,texts,e.t.c... It is very annoying to see the chart with all these objects. But if we remove these objects from the chart , we want to redraw all objects again. It will be a very time consuming process and also as price moves fast in forex mar

Money Management Money management is the most important in successful trading, if we have the best indicators in the world and doesn't have the proper money management it's very difficult to succeed. Proper lot sizing is the most important part in money management. So we have made a best tool for lot sizing. This tool is easily customizable and very easy to handle for Traders. "This tool is completely free" To understand how to make use of t
FREE

Advanced Ichimoku Toggle Button With Alert Indicator
A Very useful tool that every trader should have in their tool box This Indicator is an unique and high quality tool because it has many useful features. The ichimoku indicator consists of many elements such as kumo cloud,Kijunsen,Tenkansen,chinkou span,Span A and Span B. Different Traders use the ichimoku indicator for different strategies such as cloud breakout strategy, Tenkan kijun cross, chinkou price cross and many more... But for m
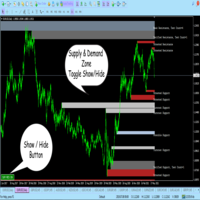
T oggle button to hide and show
In Price action Trading Support and resistance takes a important Part. But it is always a difficult job for traders to draw the supply and demand zones on their chart. Even if it is drawn the chart looks annoying if other indicator is used in congestion. So This indicator is made to draw support and resistance lines automatically and more importantly have the toggle button to hide and show those lines. Moreover it can show week zones strong zone and turncoat
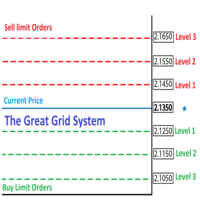
Grid Infinite This Expert advisor uses Grid system for trading. Grid system Works effectively in volatile market. This Expert advise works only when the currency pair is volatile. This EA will open pending limit orders when the market condition is favorable according to this EA's Algorithm, then maintain all opened order with unique way.
An important function "Max Loss" is added to the expert advisor so that a trade can able to choose the maximum loss if the trade goes against them. EA not usi

Open Or Close All Currency pairs in single click
A very Using tool that every trader wish to have in his tool box. For the Traders who are Trading multiple currencies this is a most needed tool. Much of time is saved by using this tool. Open all currency pairs in a single click with the time frame we wish. Closes all charts in a single click. Input Parameters: Open All Symbol : Open All Chart symbols from the broker
Symbols To Open : Open All Major Pairs and Cross Pairs