I'm an architect, I love the lines. I am passionate about financial trading, foreign exchange, investment projects, and especially studying the nature of the financial markets.
https://www.mql5.com/en/market/product/95516 The reason of development of this new moving average was to improve the noise filter and decrease a lag, presented in most of the moving averages. The indicator is based on multiple exponential smoothing of price.
T3 Pro Variant MT5 Indicator - A variation on the T3 theme that was made as a sort of envelopes using T3 for basic value (not some of the built in averages). It can be used in the same manner as any envelopes are used (remebering that the envelopes are calculated in points not pips). The reason of development of this new moving average was to improve the noise filter and decrease a lag, presented in most of the moving averages. The indicator is based on multiple exponential smoothing of price
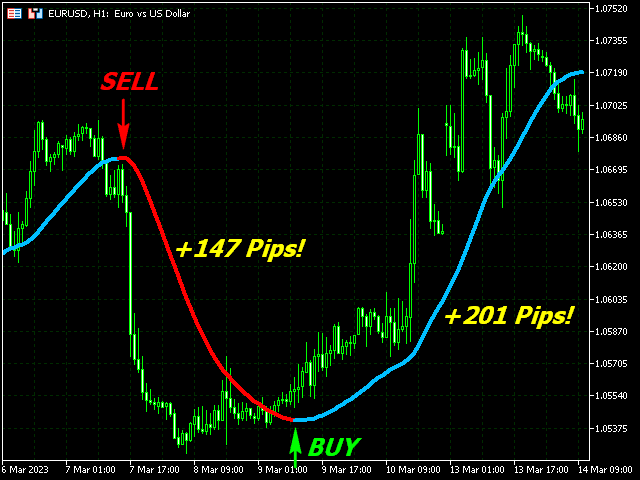
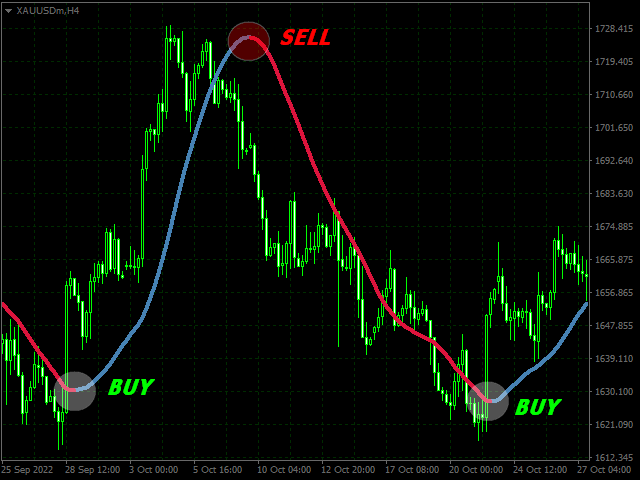
https://www.mql5.com/en/market/product/95507 The SDL Trend Signals (Slope Direction Line) MT5 indicator is displayed as a colored moving average line indicating the average market movement direction.
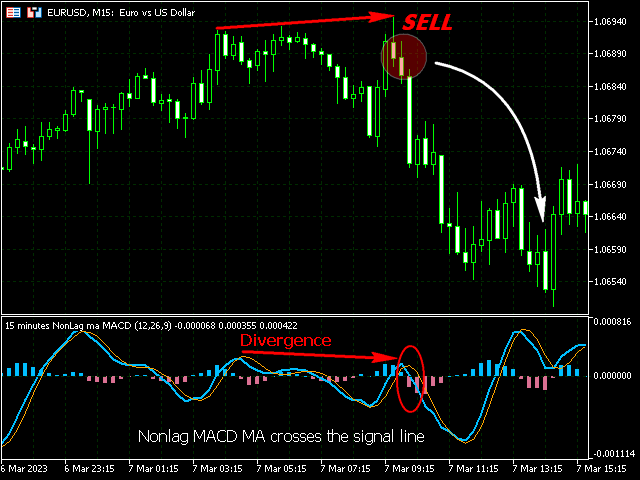
https://www.mql5.com/en/market/product/95497 It is good for spotting divergences, can be used when the MACD and the signal line crosses, and can be used to spot the sudden trend changes.
Nolag Alert MACD Cross MA indicator for MT5 MACD variation that is not using EMA for MACD-calculation (as it was originally invented by Geral Appel) but, for making it even faster, it uses Nonlag MA. As an adition, even the signal line is calculated using Nonlag MA ma, so this is a sort of a "full" Nonlag MA MACDAs with any MACD. It is good for spotting divergences, can be used when the MACD and the signal line crosses, and can be used to spot the sudden trend changes. Also was added
RSI, CCI & PercentRange Oscillators drawn in the chart window. An oscillator is a technical analysis tool that constructs high and low bands between two extreme values, and then builds a trend indicator that fluctuates within these bounds. Traders use the trend indicator to discover short-term overbought or oversold conditions. The relative strength index ( RSI ) is a momentum indicator used in technical analysis. RSI measures the speed and magnitude of a forex's recent price
https://www.mql5.com/en/market/product/95435 The indicator initializes three buffers, two for trend lines (Uptrend and Downtrend) and one for the indicator values (ExtMapBuffer). The indicator values buffer is used to calculate the trend lines.
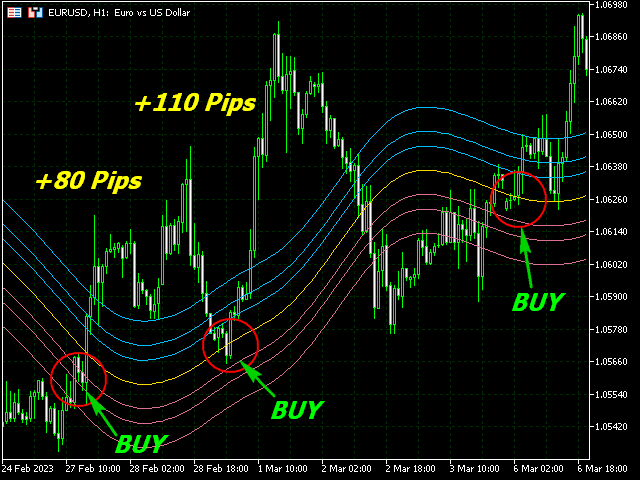
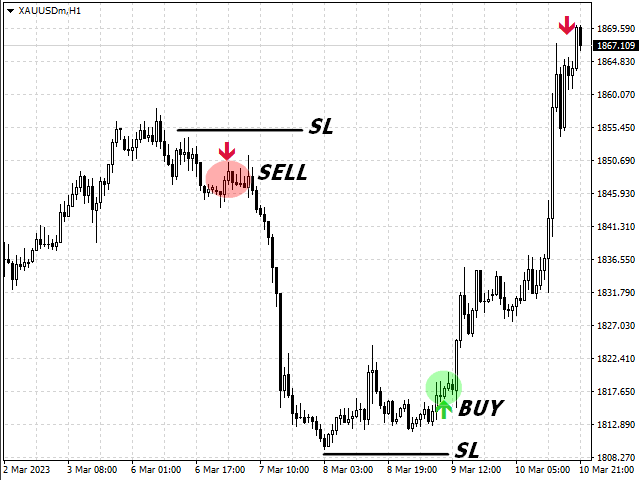
https://www.mql5.com/en/market/product/95348 The Arrows buy sell based on 3MA Forex indicator for MT4 is a popular trend indicator with alerts based on the crossover of 3 moving averages.
The Arrows buy sell based on 3MA Forex indicator for MT4 is a popular trend indicator with alerts based on the crossover of 3 moving averages. The indicator is composed of a faster, medium and slower moving average A buy alert will occur when the faster moving average crosses both the medium and slower moving average upwards. A sell alert will occur when the faster moving average crosses both the medium and slower moving average downwards. How to trade with it? Open a buy trade when the green
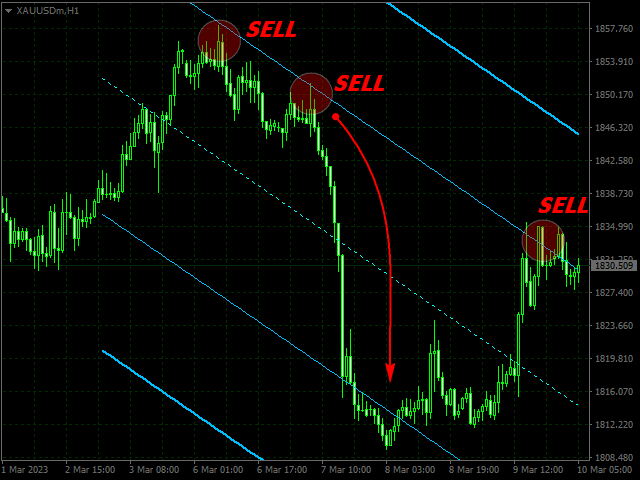
https://www.mql5.com/en/market/product/95309 The indicator provides inner and outer channel line which acts support and resistance. Additionally, the indicator shows the BULLISH and BEARISH market conditions.
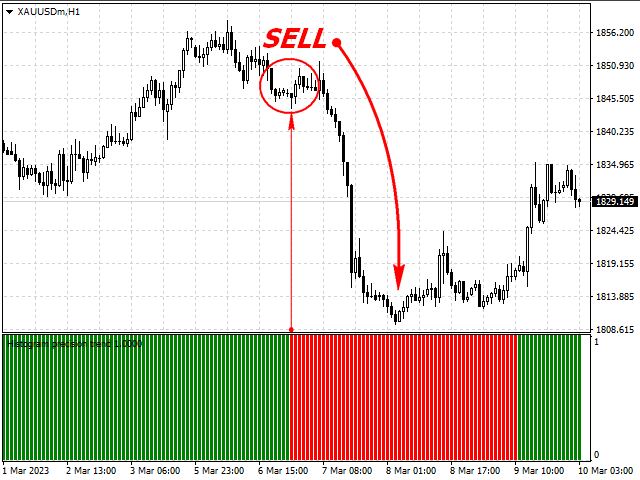
The Histogram Precision trend Metatrader 4 forex indicator shares a lot of similarities to some existing indicators, but there are some variations, which makes it permissible for traders to own it as a separate technical indicator. It is an indicator that measures market trends quite well. The histograms are colored according to the current “precision trend” state. A green histogram bar represents a bullish trend. A red histogram bar represents a bearish trend. Basic Trading Signals
Traders know that classic Heiken Ashi candlesticks plotted on a price chart make it difficult to analyze by cluttering up Japanese candlesticks. The Heiken Ashi Sub indicator MT4 simply draws the Heiken Ashi candlesticks with high precision in a separate subwindow, and helps to navigate them without cluttering the main chart. The Heiken Ashi Sub indicator allows you to unload the price chart, making it easy and accessible to read, will significantly optimize trading. It is possible to customize
Impulse waves Corrective waves indicator for Metatrader 4. "A safe journey is only possible on a road with good marking and proper road signs." The indicator shows: Impulse waves (bold sloping lines); Corrective waves (thins sloping lines); Upward wave series (Green color); Downward wave series (Crimson red color); Wave series length (the numbers near the Zig Zag vertices); Wave series breakthrough levels (short Teal and Purple lines); Targets for Take Profit (the Fibonacci grid from the start
The WaveMTF Indicator For MT4 is a Multi-time frame indicator which displays the market sentiment of each symbol or currency pair across all time frames without the need to switch up and down to other time frames Green meaning that the market is currently trading in a bullish market Red meaning that the market is currently trading in a bearish market WaveMTF Indicator For MT4 is one of the best indicators when it comes to finding an indicator that will compare and confirm trends
The indicator of price levels fractals. Fractals Price Labels is a mt4 (MetaTrader 4) indicator and it can be used with any forex trading systems / strategies for additional confirmation of trading entries or exits. How to install Fractals_Price mt4 indicator in forex trading platform metatrader 4? Free downloaded Fractals_Price.ex4 Go to “File menu” in Mt4 trading platform and click “open data folder”. Open Mql4 folder and open the indicators folder. Now paste the