Filatov Arthur / プロファイル
CFTe
において
Sweden
Certified Financial Technician (CFTe)/ Certified Financial Planner(CFP)/Chartered Alternative Investment Analyst(CAIA), with ability to consistently deliver on multiple commitments, have the advantage of solid foundations and a strong heritage. But I take a fresh, transparent and personal approach to financial planning. I aim to provide clients with clarity and transparency in everything I do. This includes using technology to explain how long-term financial planning can add value to people’s lives; to give people access to information about their financial well being. Through a rigorous and proprietary bottom-up investment process I aim to build a portfolio that combines excellent economic characteristics and great management.
Filatov Arthur

The Symmetrical Triangle Strategy Guide
Learn More 👉 https://forums.babypips.com/t/the-symmetrical-triangle-strategy-guide/976206
Learn More 👉 https://forums.babypips.com/t/the-symmetrical-triangle-strategy-guide/976206

Filatov Arthur

Following the unsuccessful test of the support level at 1.0460, the bulls entered the market and we witnessed an impulsive upward movement that was limited at the psychological level at 1.0600. If the EUR/USD manages to breach this level, then it would further rise towards the next key resistance at 1.0643. In case the resistance at 1.0600 withholds the bullish pressure, then the most likely scenario would be for the pair to continue trading in the range of 1.0540 – 1.1060.

Filatov Arthur

EURUSD Trend Analysis
On the H4 chart, the price did not decrease for a long time along the MACD indicator line and now it has broken up, the current candle may become a consolidation. The Marlin Oscillator is unevenly developing an increase in the growing area. The price could likely reach 1.0600.
On the H4 chart, the price did not decrease for a long time along the MACD indicator line and now it has broken up, the current candle may become a consolidation. The Marlin Oscillator is unevenly developing an increase in the growing area. The price could likely reach 1.0600.

Filatov Arthur
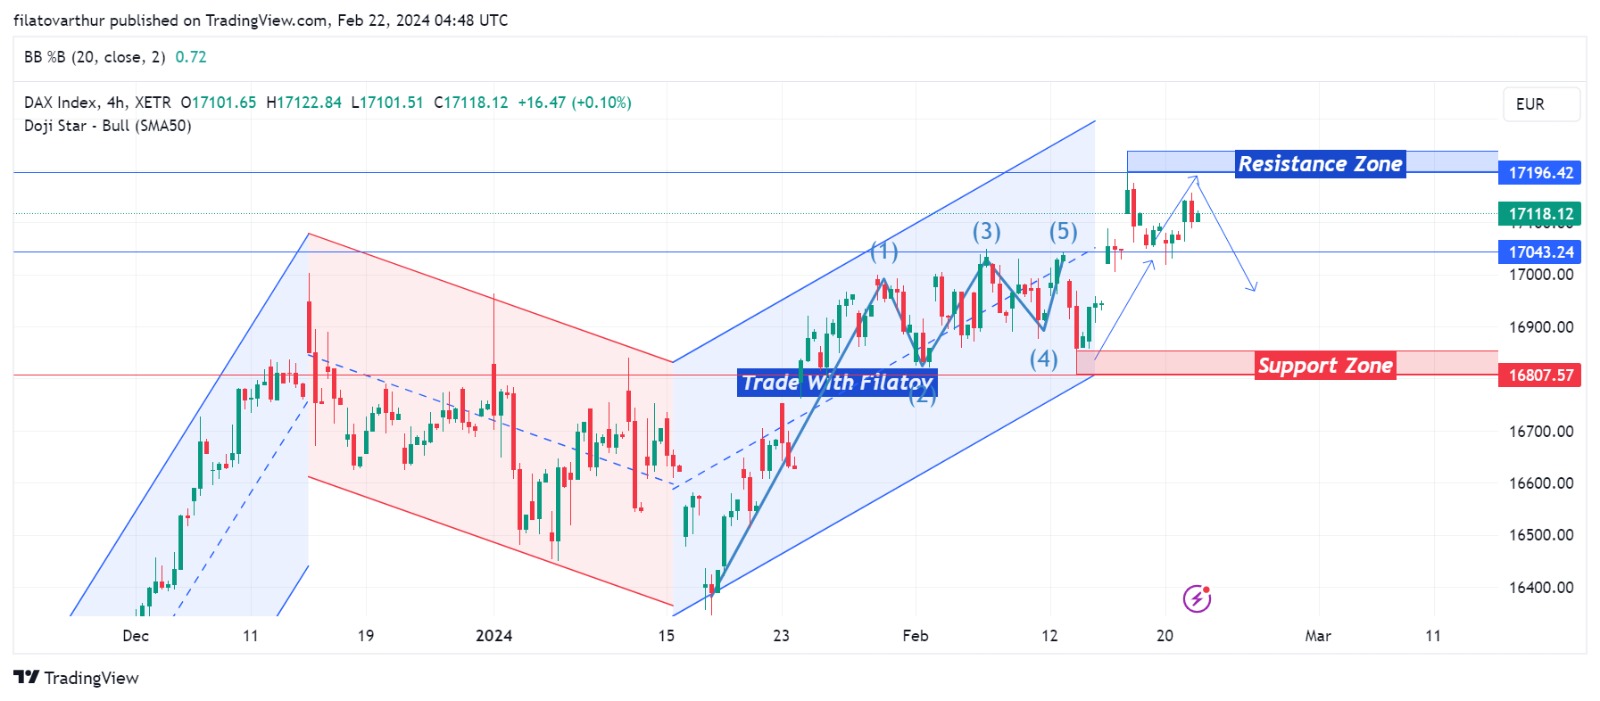
DAX40 is also looking follow the NASDAQ's trend.. Looking in Buy side over H4 timeframe...
Filatov Arthur
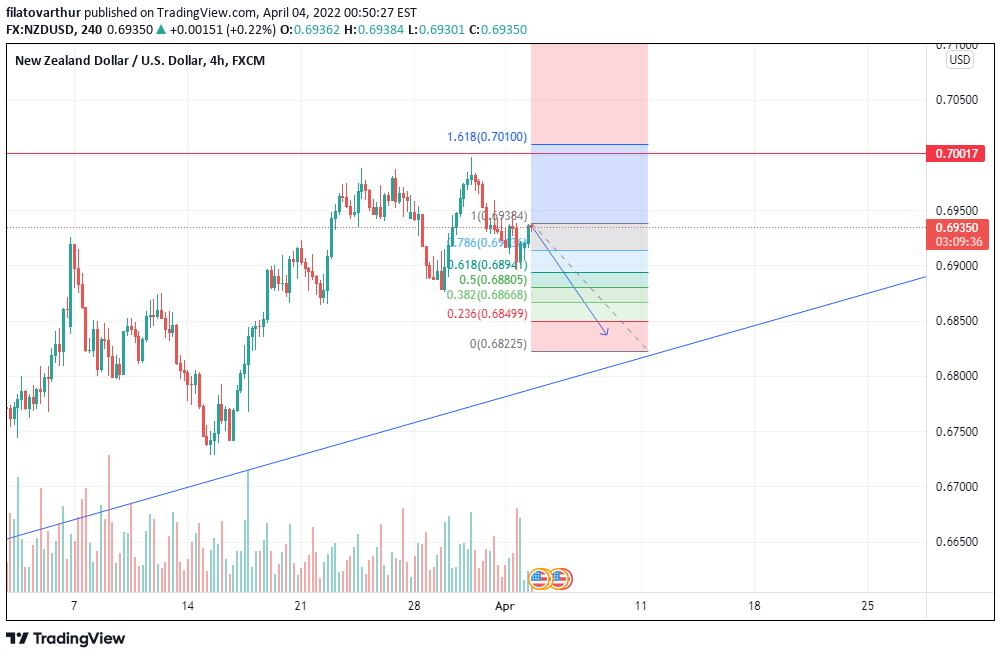
On the H4, with price expected to bounce off the support of the Ichimoku cloud, we have a bias that price will rise to our 1st resistance at 0.69875 in line with the swing high resistance from our 1st support at 0.68752 in line with the horizontal overlap support, 50% Fibonacci retracement and 100% Fibonacci projection. Alternatively, price may break 1st support structure and head for 2nd support at 0.68332 in line with the 138.2% Fibonacci extension and 61.8% Fibonacci retracement. Our bullish bias is further supported by the ascending trendline which is signifying a bullish momentum. Sell trend is looking as its predicted to go down and reason for that 138.2% Fibonacci extension and 61.8% Fibonacci retracement.

Filatov Arthur
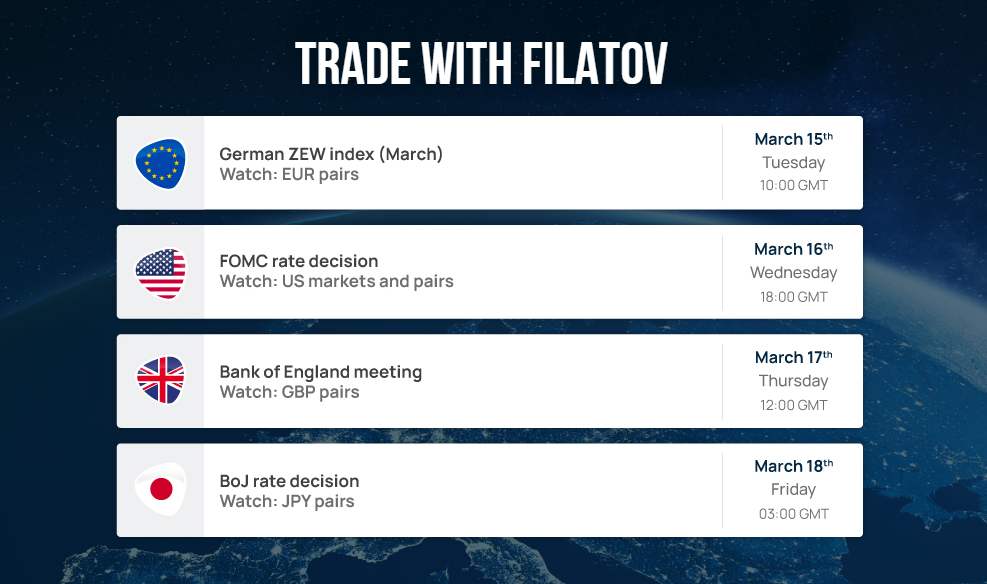
This week we have some explosive central banks releases, including the BOE and The Fed, both of which are expected to raise their rates, even amid the backdrop of war. Oil looks set to move higher, and DOGE has had a remarkable 24 hours, soaring 124% on huge trading volume.

Filatov Arthur
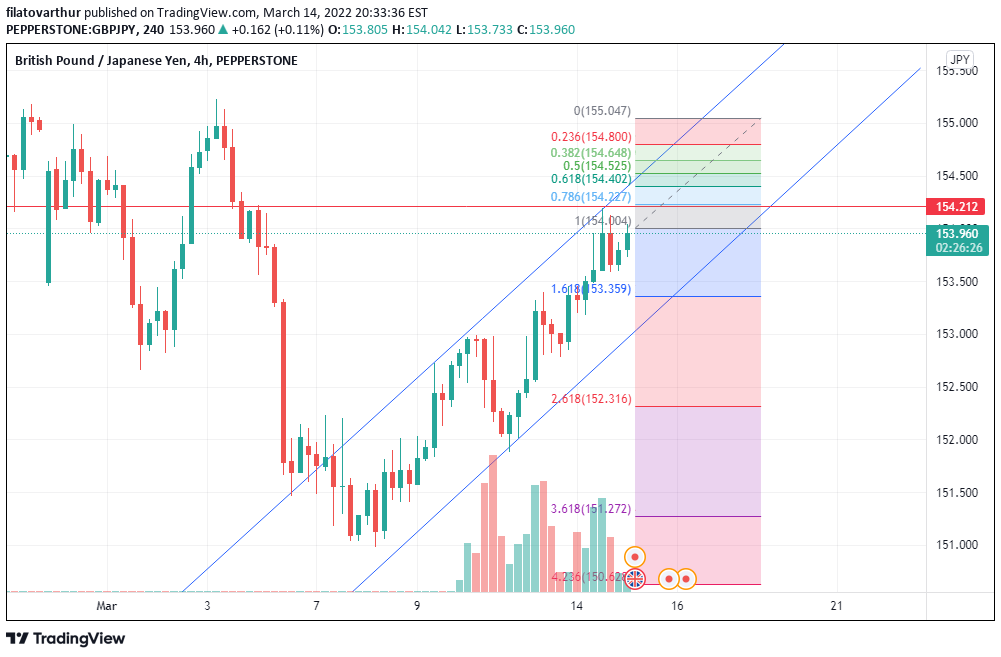
GBP/JPY Outlook (15 March 2022)
Overall, GBP/JPY is trending downwards. Recently, GBP/JPY traded into the resistance zone of 153.800.
The UK employment data will be released later at 1500 (GMT+8).
Average Earnings Index 3m/y (Forecast: 4.6%, Previous: 4.3%)
Claimant Count Change (Forecast: 20.3K, Previous: -31.9K)
Unemployment Rate (Forecast: 4.0%, Previous: 4.1%)
Currently, GBP/JPY is testing the resistance zone of 153.800 and the next support zone is at 151.000.
Look for short-term buying opportunities of GBP/JPY if it breaks the resistance zone of 154.200.

Filatov Arthur
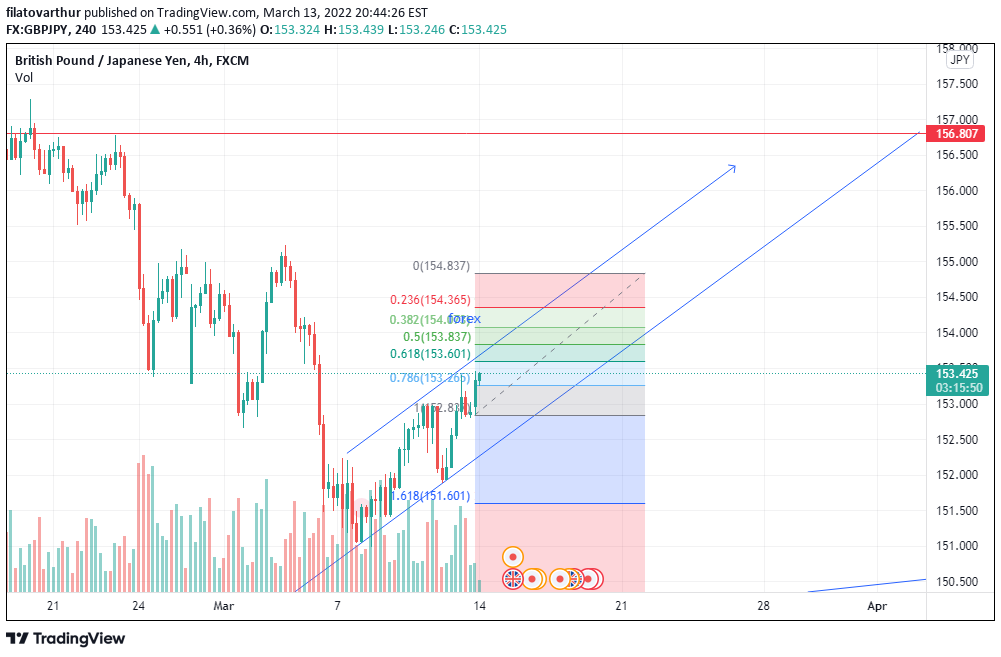
GBP/JPY Outlook (14 March 2022)
Overall, GBP/JPY is trending downwards. Recently, GBP/JPY broke above the key level of 153.
The UK GDP m/m data (Actual: 0.8%, Forecast: 0.1%, Previous: -0.2%) released last Friday indicated a strong rebound in UK’s economic growth in January.
GBP/JPY’s next support zone is at 151.000 and the next resistance zone is at 153.800.
Look for short-term buying opportunities of GBP/JPY.

Filatov Arthur
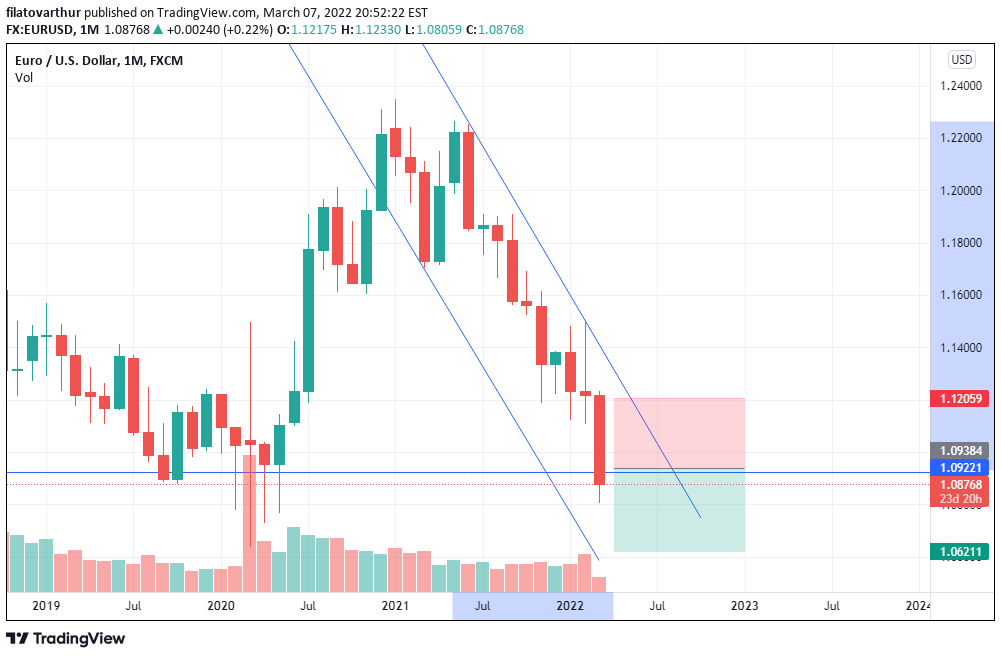
Overall, EUR/USD is trending downwards. Recently, EUR/USD broke the support zone of 1.10000.
EUR/USD’s next support zone is at 1.07000 and the next resistance zone is at 1.10000.
Look for short-term selling opportunities of EUR/USD .
EUR/USD’s next support zone is at 1.07000 and the next resistance zone is at 1.10000.
Look for short-term selling opportunities of EUR/USD .

Filatov Arthur

Gold is looking bullish as it has formed a cup and handle formation over monthly chart. Can see for a buy on smaller lot in gold .

Filatov Arthur
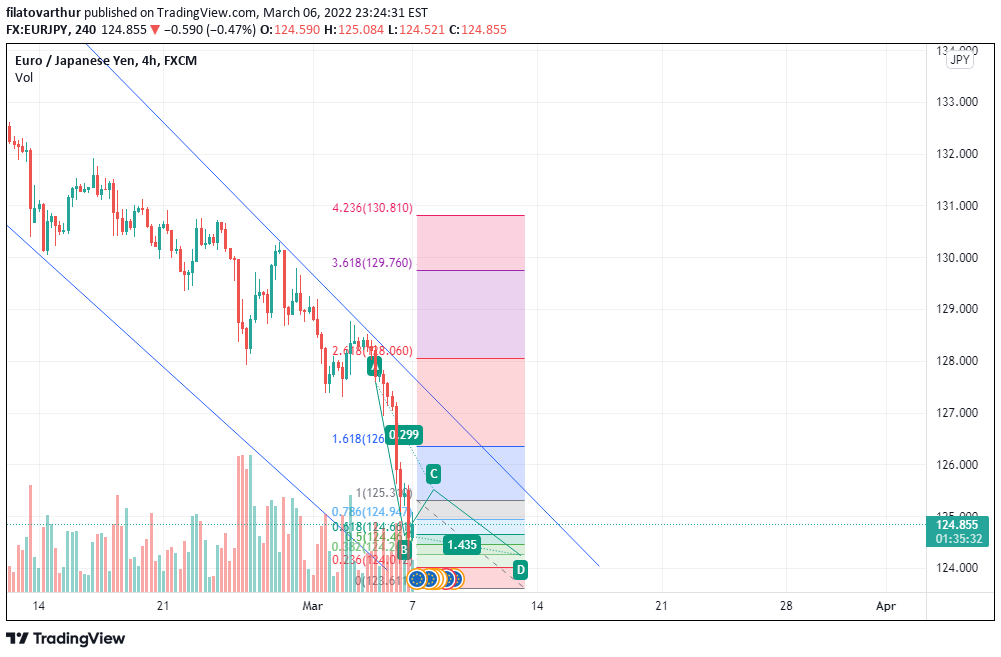
EUR/JPY Outlook (07 March 2022)
Overall, EUR/JPY is trending downwards. Recently, EUR/JPY broke the support zone of 127.500.
The eurozone retail sales date (Actual:0.2%, Forecast: 1.5%, Previous: -3.0%) released last Friday indicated a slowdown in consumer spending in January
Currently, EUR/JPY is testing the support zone of 125.000 and the next resistance zone is at 127.500.
Look for short-term selling opportunities of EUR/JPY if it breaks the support zone of 125.000.

Filatov Arthur

EUR/USD Outlook (07 March 2022)
Overall, EUR/USD is trending downwards. Recently, EUR/USD broke the support zone of 1.10000.
The eurozone retail sales date (Actual:0.2%, Forecast: 1.5%, Previous: -3.0%) released last Friday indicated a slowdown in consumer spending in January.
EUR/USD’s next support zone is at 1.10000 and the next resistance zone is at 1.12000.
Look for short-term selling opportunities of EUR/USD.

Filatov Arthur

Overall, EUR/USD is ranging across. Recently, EUR/USD rejected the resistance zone of 1.13800.
The French flash PMI data will be released later at 1615 ( SGT ).
French Flash Manufacturing PMI (Forecast: TBA, Previous: 55.5)
French Flash Service PMI (Forecast: TBA, Previous: 53.1)
The German Flash PMI data will be released later at 1630 ( SGT ).
German Flash Manufacturing PMI (Forecast: TBA, Previous: 59.8 revised from 60.5)
German Flash Services PMI (Forecast: TBA, Previous: 52.2)
The eurozone flash PMI data will be released later at 1700 ( SGT ).
Flash Manufacturing PMI (Forecast: TBA, Previous: 58.7 revised from 59.0)
Flash Services PMI (Forecast: TBA, Previous: 51.1 revised from 51.2)
Currently, EUR/USD is trading down towards the key level of 1.13. Its next support zone is at 1.12000 and the next resistance zone is at 1.13800.
Look for short-term selling opportunities of EUR/USD if it breaks below the key level of 1.13.

Filatov Arthur

Overall, NZD/USD is ranging across.
Currently, NZD/USD is testing the resistance zone of 0.67100 and the next support zone is at 0.65400.
Look for short-term selling opportunities of NZD/USD if it rejects the resistance zone of 0.67100.
Currently, NZD/USD is testing the resistance zone of 0.67100 and the next support zone is at 0.65400.
Look for short-term selling opportunities of NZD/USD if it rejects the resistance zone of 0.67100.

:
