Kevin Alejandro Pirela Hernandez / プロファイル
- 情報
|
no
経験
|
1
製品
|
0
デモバージョン
|
|
0
ジョブ
|
0
シグナル
|
0
購読者
|
Ecuador
において
Ecuador
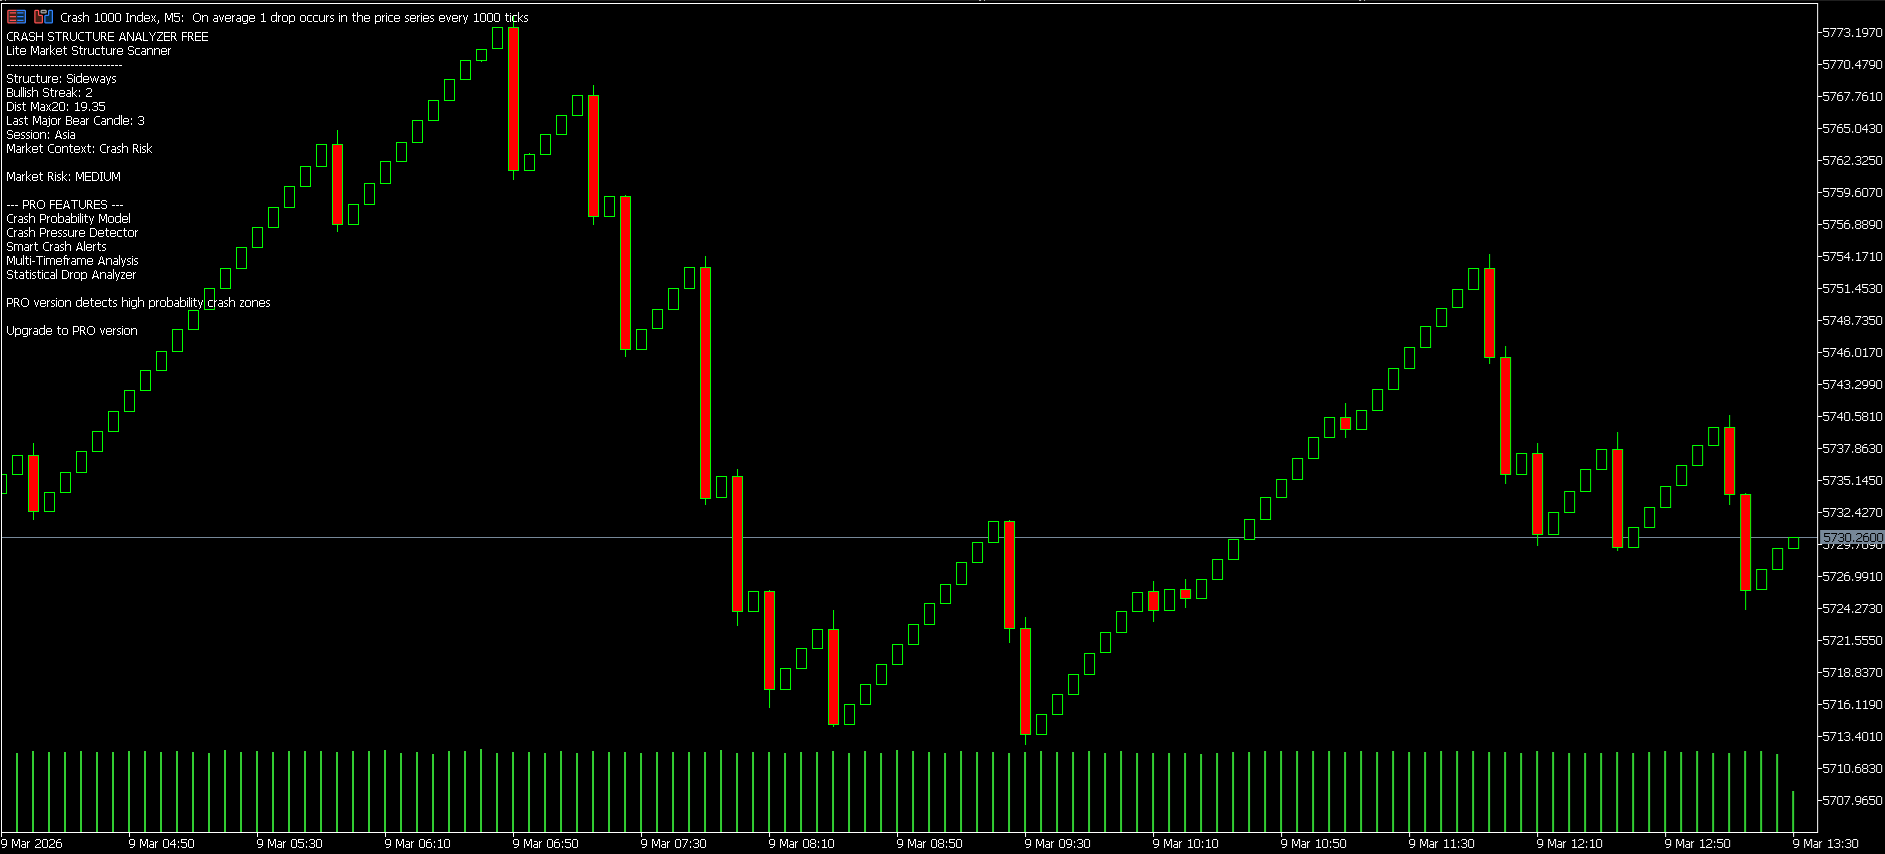
Quantitative developer focused on behavioral analysis of synthetic indices.
Creator of tools designed to measure market structure, exhaustion and statistical context in Boom & Crash markets.
Data-driven trading tools. No signal selling.
Data first. Emotion last.
Creator of tools designed to measure market structure, exhaustion and statistical context in Boom & Crash markets.
Data-driven trading tools. No signal selling.
Data first. Emotion last.
友達
リクエスト
プロファイルまたはユーザー検索を経由して友達を追加できます。追加するとオンラインステータスがわかるようになります。
発信
Kevin Alejandro Pirela Hernandez
📊 **Crash Structure Analyzer – FREE Edition**
Designed specifically for synthetic rise and fall indices.
Today I’m releasing the **free version** of a lightweight tool designed to observe the structural behavior of Crash markets.
Instead of signals or predictions, this indicator focuses on **reading the context of the market**.
The FREE edition works as a **structure scanner**, helping traders quickly understand what the market is doing.
🔎 **What the FREE version analyzes**
• Market structure (Bullish / Broken / Sideways)
• Consecutive bullish streaks
• Distance from recent highs
• Last major bearish candle
• Market session context
• Basic crash-risk environment
The goal is simple:
**Turn the chart into a behavioral map instead of a guessing game.**
This version also includes a **data observer module**, which records candle behavior into a CSV file so traders can start building their own datasets.
📈 The FREE edition is meant to help traders **understand market conditions in real time**.
---
⚙️ **PRO version includes**
• Crash probability model
• Pressure-based crash detection
• Multi-timeframe structure engine
• Statistical drop analyzer
• Smart crash alerts
---
No signal selling.
No magic indicators.
Just **structure, context and data**.
**Data first. Emotion last.**
Kevin Alejandro Pirela Hernandez
パブリッシュされたプロダクト
Analizador de estructuras de choque GRATUITO Crash Structure Analyzer FREE es una herramienta de análisis estructural liviana diseñada para operadores que desean una visión clara del comportamiento del mercado de índices sintéticos. Esta herramienta analiza la estructura de precios reciente en tiempo real y proporciona un contexto estructural simple sin agregar indicadores pesados al gráfico. La versión GRATUITA se centra en la claridad estructural al tiempo que recopila datos de mercado para
:
