Aashish Manglani / プロファイル
Aashish Manglani
Unlocking Smart Money Concepts (SMC): How Institutional Traders Move the Market
What is Smart Money?
"Smart Money" refers to institutional market participants—such as central banks, hedge funds, market makers, and large financial institutions—that possess massive capital capable of driving price action.
Smart Money Concepts (SMC) is a trading philosophy built around tracking institutional order flow rather than relying on traditional retail indicators like RSI or MACD.
Core Pillars of SMC
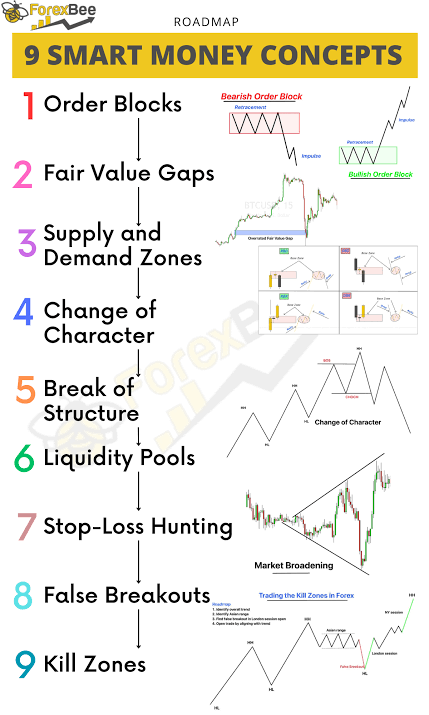
Order Blocks (OB): Specific price zones where institutions place massive buy or sell orders. When price returns to these zones, it often reacts strongly.
Liquidity Pools: Areas on the chart where retail stop-losses accumulate (such as equal highs or equal lows). Smart Money often drives price toward these zones to collect liquidity before reversing.
Break of Structure (BOS): Occurs when price breaks a previous higher high in an uptrend or a lower low in a downtrend, confirming market continuity.
Change of Character (CHOCH): The first sign of a potential trend reversal, marked by price breaking a key swing high or low against the prevailing trend.
Fair Value Gap (FVG): A three-candle price imbalance created by aggressive buying or selling, leaving an inefficiency that price often returns to fill.
Why Traders Study SMC
Instead of trading against large financial institutions, SMC traders aim to align their strategy with institutional footprint analysis, seeking high-reward entry points with clear risk management parameters.
Disclaimer: This post is for educational purposes only and does not constitute financial or investment advice. Trading financial markets carries high risk. Always conduct your own research and manage your risk carefully.
What is Smart Money?
"Smart Money" refers to institutional market participants—such as central banks, hedge funds, market makers, and large financial institutions—that possess massive capital capable of driving price action.
Smart Money Concepts (SMC) is a trading philosophy built around tracking institutional order flow rather than relying on traditional retail indicators like RSI or MACD.
Core Pillars of SMC
Order Blocks (OB): Specific price zones where institutions place massive buy or sell orders. When price returns to these zones, it often reacts strongly.
Liquidity Pools: Areas on the chart where retail stop-losses accumulate (such as equal highs or equal lows). Smart Money often drives price toward these zones to collect liquidity before reversing.
Break of Structure (BOS): Occurs when price breaks a previous higher high in an uptrend or a lower low in a downtrend, confirming market continuity.
Change of Character (CHOCH): The first sign of a potential trend reversal, marked by price breaking a key swing high or low against the prevailing trend.
Fair Value Gap (FVG): A three-candle price imbalance created by aggressive buying or selling, leaving an inefficiency that price often returns to fill.
Why Traders Study SMC
Instead of trading against large financial institutions, SMC traders aim to align their strategy with institutional footprint analysis, seeking high-reward entry points with clear risk management parameters.
Disclaimer: This post is for educational purposes only and does not constitute financial or investment advice. Trading financial markets carries high risk. Always conduct your own research and manage your risk carefully.
Aashish Manglani
GOLD (XAUUSD) BUY SETUP: Multi-Touch Support Holding Strong!
Direction: BUY / LONG
Asset: XAUUSD (Gold)
Timeframe Analysis: M15 / M5
Execution Levels
Entry Range: $4,048.50 – $4,050.50 (Current zone near $4,049.13)
Stop Loss (SL): $4,040.00 (Placed safely below the key liquidity sweep level and low of $4,041.00)
Take Profit 1 (TP1): $4,068.00 (First major resistance structure)
Take Profit 2 (TP2): $4,074.00 (Target zone shown on chart)
Trade Rationale & Confluences
Strong Support Zone: Price has revisited a well-established demand zone / support level around $4,048.00–$4,049.00 which has consistently held and shown multiple reactions.
Liquidity Sweep / Fake out Confirmation: A sharp liquidity grab occurred earlier (dipping below $4,020.00) followed by a aggressive recovery back into the original support structure, signaling strong buyer absorption.
Higher Low Setup: On the lower timeframes (M5/M15), price is respecting this horizontal zone with diminishing selling pressure, creating an ideal risk-to-reward long setup.
Risk Management Rules
Risk Per Trade: Risk maximum 1% - 2% of total account equity.
Risk-to-Reward Ratio (RRR): Approximately 1 : 2.5+
Trade Management: Move Stop Loss to Break-Even (BE) once price reaches +$10.00 / 100 pips in profit or near $4,060.00. Partial profits can be secured at TP1.
⚠️ DISCLAIMER: This post is for educational and informational purposes only. This is NOT FINANCIAL ADVICE. Foreign exchange and commodity trading carries a high level of risk and may not be suitable for all investors. Manage your capital responsibly.
#XAUUSD #GoldTrading #ForexSignals #TechnicalAnalysis #DayTrading #PriceAction #ForexRiskManagement #TradingView #Commodities #GoldAnalysis
Direction: BUY / LONG
Asset: XAUUSD (Gold)
Timeframe Analysis: M15 / M5
Execution Levels
Entry Range: $4,048.50 – $4,050.50 (Current zone near $4,049.13)
Stop Loss (SL): $4,040.00 (Placed safely below the key liquidity sweep level and low of $4,041.00)
Take Profit 1 (TP1): $4,068.00 (First major resistance structure)
Take Profit 2 (TP2): $4,074.00 (Target zone shown on chart)
Trade Rationale & Confluences
Strong Support Zone: Price has revisited a well-established demand zone / support level around $4,048.00–$4,049.00 which has consistently held and shown multiple reactions.
Liquidity Sweep / Fake out Confirmation: A sharp liquidity grab occurred earlier (dipping below $4,020.00) followed by a aggressive recovery back into the original support structure, signaling strong buyer absorption.
Higher Low Setup: On the lower timeframes (M5/M15), price is respecting this horizontal zone with diminishing selling pressure, creating an ideal risk-to-reward long setup.
Risk Management Rules
Risk Per Trade: Risk maximum 1% - 2% of total account equity.
Risk-to-Reward Ratio (RRR): Approximately 1 : 2.5+
Trade Management: Move Stop Loss to Break-Even (BE) once price reaches +$10.00 / 100 pips in profit or near $4,060.00. Partial profits can be secured at TP1.
⚠️ DISCLAIMER: This post is for educational and informational purposes only. This is NOT FINANCIAL ADVICE. Foreign exchange and commodity trading carries a high level of risk and may not be suitable for all investors. Manage your capital responsibly.
#XAUUSD #GoldTrading #ForexSignals #TechnicalAnalysis #DayTrading #PriceAction #ForexRiskManagement #TradingView #Commodities #GoldAnalysis
Aashish Manglani
XAUUSD MARKET UPDATE
💡 Technical Overview
Price action on the M15 timeframe shows a clear bearish continuation setup:
Support Breakout: Price has broken below the key intraday support level (~$4,070 - $4,073) and is currently accepting below it.
EMA Confluence: Candle structure is trading consistently below the 100 EMA, indicating strong downward momentum.
Lower Highs Structure: Following the rejection off the major high zone at ~$4,118–$4,120, price structure has shifted bearish with lower highs and lower lows.
RSI Momentum: RSI remains below 50, supporting the immediate bearish bias toward major bottom liquidity (~$4,000–$4,005).
🔴 Trade Setup: Bearish Breakdown / Re-test Sell
Action: SELL / SHORT
Entry Zone: $4,050.00 – $4,065.00
Stop Loss (SL): $4,075.60 (Above 100 EMA and recent broken support flip)
Take Profit 1 (TP1): $4,025.00
Take Profit 2 (TP2): $4,002.90 (Major Support & Demand Zone)
⚠️ Disclaimer
Not Financial Advice (NFA). Leveraged precious metals trading carries high risk. Perform your own technical analysis and maintain proper risk management on all positions.
#XAUUSD #GoldTrading #ForexSignals #BearishBreakout #EMATrading #PriceAction #TechnicalAnalysis #ForexTrading #TradingStrategy #NFA
💡 Technical Overview
Price action on the M15 timeframe shows a clear bearish continuation setup:
Support Breakout: Price has broken below the key intraday support level (~$4,070 - $4,073) and is currently accepting below it.
EMA Confluence: Candle structure is trading consistently below the 100 EMA, indicating strong downward momentum.
Lower Highs Structure: Following the rejection off the major high zone at ~$4,118–$4,120, price structure has shifted bearish with lower highs and lower lows.
RSI Momentum: RSI remains below 50, supporting the immediate bearish bias toward major bottom liquidity (~$4,000–$4,005).
🔴 Trade Setup: Bearish Breakdown / Re-test Sell
Action: SELL / SHORT
Entry Zone: $4,050.00 – $4,065.00
Stop Loss (SL): $4,075.60 (Above 100 EMA and recent broken support flip)
Take Profit 1 (TP1): $4,025.00
Take Profit 2 (TP2): $4,002.90 (Major Support & Demand Zone)
⚠️ Disclaimer
Not Financial Advice (NFA). Leveraged precious metals trading carries high risk. Perform your own technical analysis and maintain proper risk management on all positions.
#XAUUSD #GoldTrading #ForexSignals #BearishBreakout #EMATrading #PriceAction #TechnicalAnalysis #ForexTrading #TradingStrategy #NFA
Aashish Manglani
XAUUSD Higher Timeframe Technical Outlook: Potential Breakdown from Symmetrical Triangle Bearish Analysis On the daily chart, Gold is consolidating within a well-defined Symmetrical Triangle pattern. This structure often signals continuation of the prevailing trend, which currently remains bearish on higher timeframes.
Critical Confluences: Significant Sell Side Liquidity accumulated below current price levels.
Major cluster of pending orders and equal lows located in the 3300 - 3400 region — a high-impact demand zone that could act as a strong magnet.
Repeated rejection from the upper boundary of the triangle, showing clear seller dominance.
A decisive breakdown below the lower trendline of the symmetrical triangle would likely trigger accelerated selling pressure, targeting the substantial liquidity pool in the 3300–3400 area.
This setup warrants close monitoring as it carries significant downside potential in the coming weeks.
This is not financial advice. Trading in financial markets involves substantial risk of loss. Always conduct your own due diligence and implement proper risk management.
#XAUUSD #Gold #TechnicalAnalysis #SymmetricalTriangle #Bearish #Liquidity #SMC #SmartMoneyConcepts #Forex
Critical Confluences: Significant Sell Side Liquidity accumulated below current price levels.
Major cluster of pending orders and equal lows located in the 3300 - 3400 region — a high-impact demand zone that could act as a strong magnet.
Repeated rejection from the upper boundary of the triangle, showing clear seller dominance.
A decisive breakdown below the lower trendline of the symmetrical triangle would likely trigger accelerated selling pressure, targeting the substantial liquidity pool in the 3300–3400 area.
This setup warrants close monitoring as it carries significant downside potential in the coming weeks.
This is not financial advice. Trading in financial markets involves substantial risk of loss. Always conduct your own due diligence and implement proper risk management.
#XAUUSD #Gold #TechnicalAnalysis #SymmetricalTriangle #Bearish #Liquidity #SMC #SmartMoneyConcepts #Forex
: