• Panoramica
  • Recensioni
  • Commenti (5)
  • Novità

UPD1 Impulse Shadow

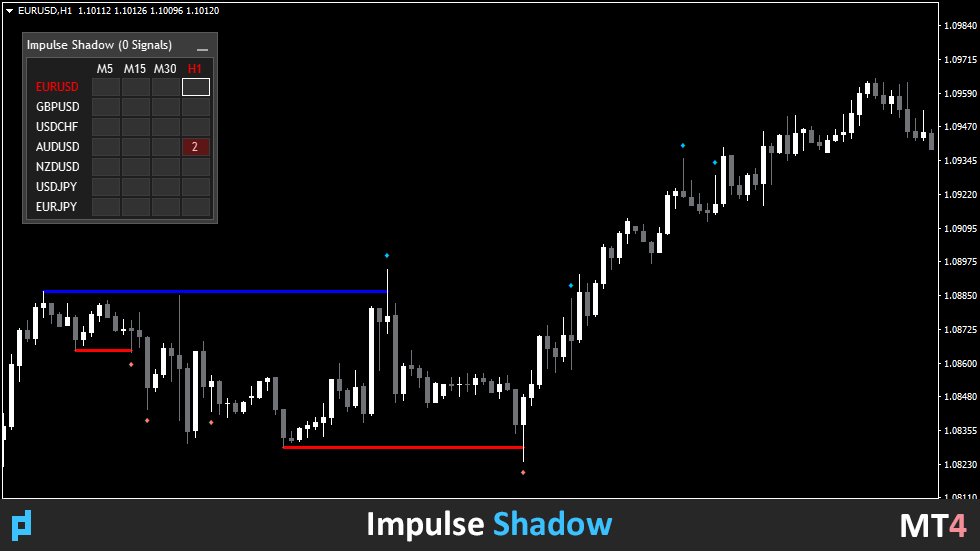
L'indicatore Cerca e visualizza automaticamente grandi ombre sul grafico in base alla volatilità.

Le ombre sono ulteriormente filtrate dalla dimensione dell'onda.

L'algoritmo analizza la rottura del frattale con un'ombra nell'intervallo specificato e visualizza il livello.

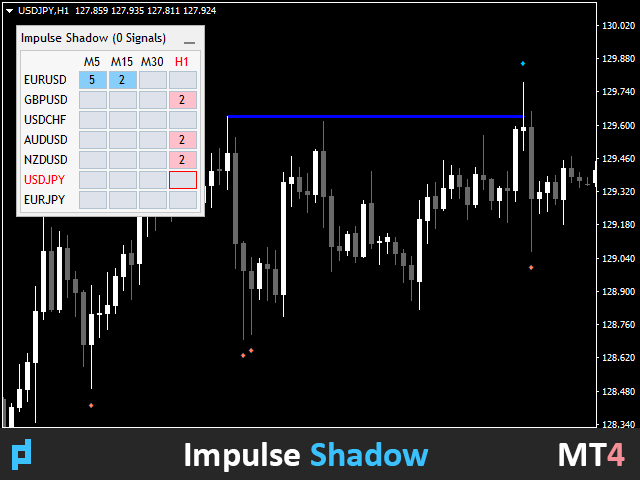
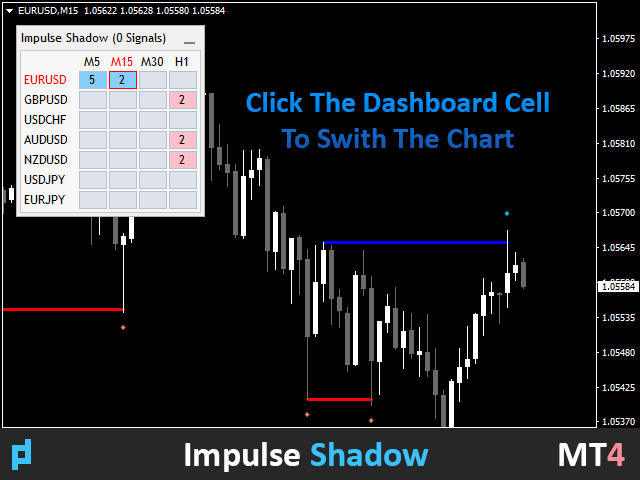
Nelle impostazioni, è possibile abilitare il dashboard multi-valuta. L'avviso viene scelto tra il grafico corrente o l'intero foglio del dashboard.

Segnali a grandi ombre e quelli che hanno sfondato il livello frattale possono essere attivati separatamente.

Blog-Link - Retest and Fake Breakout with UPD1.
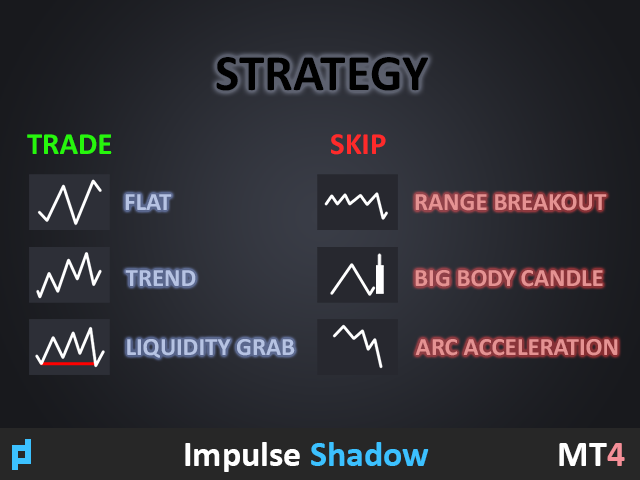

Modelli di trading:

+ Retest per tendenza.

+ Falsa ripartizione.

+ Terzo.


EURUSD, GBPUSD, XAUUSD, ...

M15, M30, H1.


Parametri di input.


Basici.

Bars Count – numero di barre da visualizzare.

ATR Period - numero di candele per calcolare la volatilità.

ATR Coeff Shadow (0 - Off) – fattore di dimensione dell'ombra (rispetto alla candela media di volatilità).

ATR Coeff Impulse (0 - Off) – fattore di dimensione dell'onda (filtro per ombre ricercate solo in onde superiori al fattore specificato, dove 1 è l'onda media calcolata).

Max Line Length - lunghezza massima del livello in barre.

Min Line Length - lunghezza minima del livello in barre.

Stop Line - cercare la rottura del frattale da ombra vicina o ignorando tutte le ombre tranne il segnale.


Impostazioni visive.

Shadow Arrow Visual - mostra tutte le ombre o solo quelle che hanno attraversato il frattale.

Shadow Arrow Code - codice icona ombra.

Shadow Arrow Indent Coeff - fattore di rientro icona.

Shadow Arrow Size - dimensione icona.

Shadow Arrow UP Color - colore dell'icona superiore.

Shadow Arrow DN Color - colore dell'icona in basso.

False Breakout Color UP Line (None - Chameleon) - colore del livello superiore.

False Breakout Color DN Line (None - Chameleon) - colore livello inferiore.

Chameleon Line Color, % - offset del colore del livello di luminosità se il colore non è selezionato.

False Breakout Line Width - spessore del livello.


Impostazioni del cruscotto.

Dashboard – attiva/disattiva il dashboard multi-valuta multi-timeframe.

Scan Bars - quante barre nella storia monitorare dopo l'ombra trovata.

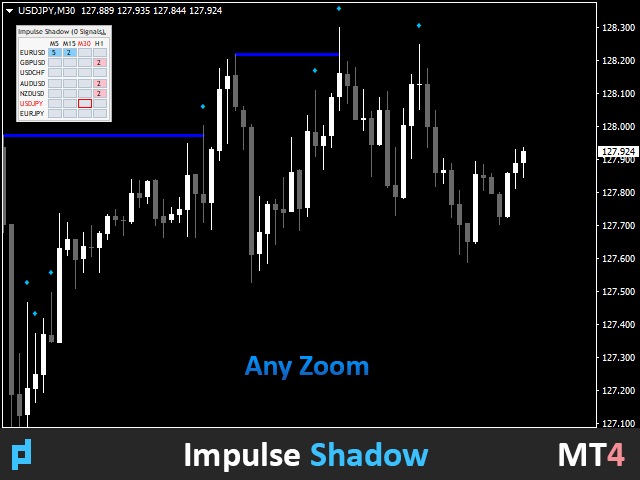
Dashboard Zoom % (0 - auto) - zoom visivo del cruscotto.

Color Theme - selezione automatica o manuale del tema colore del pannello (chiaro e scuro).

Symbol List – elenco dei simboli. Puoi inserire qualsiasi strumento separato da virgole.

View M1-D1 – attiva/disattiva un intervallo di tempo specifico.


Impostazioni degli avvisi.

Alert - attiva / disattiva l'unità di allarme.

Current Chart – avviso solo sul grafico corrente, ignorando i segnali del cruscotto.

Dashboard List – avviso quando compaiono nuovi segnali nel cruscotto.

Alert Shadow - suona il clacson all'ombra trovata.

Alert Shadow Cross Level - suonare il clacson quando si attraversa l'ombra del frattale (in priorità).

Alert Work Time - periodo di tempo in cui l'allarme funzionerà.

Alert Pop Up - abilita / disabilita il popup di avviso.

Alert Push - Abilita / Disabilita l'avviso sul telefono.

Alert E-mail - Abilita / Disabilita l'invio di avvisi e-mail.

Alert Sound - Abilita / Disabilita l'allarme.

Alert Sound Name - nome del file audio.


Prodotti consigliati
This is a well-known ZigZag indicator. But it differs by the fact that its plot is based on values of the middle line which is set by a user. It can display Andrews’ Pitchfork and standard or Bobokus Fibo levels. NO REPAINTING. Parameters Period МА — middle line period. Default value is 34. Minimum value is 4. Maximum value is set at your discretion. Used to calculate price - base price to calculate the middle line. The averaging method - method of smoothing the middle line. Turning pitchfork
The price is moving between two curve tunnel lines in a trend. The two lines of a tunnel represent support and resistance. In an uptrend, for instance, a trade might be entered at the support of the trend line (shown by the red line in the chart) and exited at resistance of the upper tunnel line (shown by the blue line). Tunnel show trend direction for any timeframe (if you have enough bars on the chart for higher timeframes). Trend, or price tunnel, can be up, down or sideways. If the current p
Индикатор ищет подобную ценовую структуру, сравнивая с последней ценовой структурой. Размер паттерна (грубо говоря количество переломов зигзага) настраивается (всегда меньше на 1, чем введено - нулевой перелом не считается). Все найденные совпадения отмечаются прямоугольником. Так же к паттернам существует быстрая навигация с помощью кнопочек "Next patt" и "Prev patt". В индикатор вшиты два индикатора типа ЗигЗа г : стандартный зигзаг и пользовательский , моей разработки. Параметры настройки ста
Forex Indicator  " Hanging Man pattern" for MT4 Indicator  " Hanging Man pattern "  is very powerful indicator   for Price Action trading :    No repaint, No delays; Indicator   detects bearish Hanging Man patterns  on chart:  Red arrow signal on chart (see pictures) P C, Mobile & Email alerts   are included Indicator   " Hanging Man pattern "  is excellent to   combine with Support/Resistance  Levels:  https://www.mql5.com/en/market/product/100903 // More great Expert Advisors and Indicators ar
CyberZingFx Volume Plus
Afsal Meerankutty
4.93 (15)
Advanced version of CyberZingFx Volume Plus, the ultimate MT4 indicator for traders seeking highly accurate buy and sell signals. With an additional strategy and price action dot signals that enhances its effectiveness, this indicator offers a superior trading experience for professionals and beginners alike. The CyberZingFx Volume Plus Advanced version combines the power of volume analysis and historical price data with an additional strategy, resulting in even more precise and reliable signals
Strong Pivot trend indicator is a trend indicator that uses standard pivot calculation and some indicators. The purpose of the indicator is to calculate the possible trends using the pivot point. And to give the user an idea about trend direction. You can use this indicator as a trend indicator. Or with other indicators suitable for your strategy. Features The blue bar represents the upward trend. The yellow bar represents the downward trend. The blue pivot point represents the upward trend.
UPD1 Fibo Levels
Vitaliy Kuznetsov
5 (3)
L'indicatore analizza il numero di candele specificato e costruisce i livelli di Fibonacci in base al massimo e al minimo. Poiché i livelli vengono ricostruiti, siamo interessati al lato destro dell'intervallo. Il prezzo è magnetico rispetto ai livelli e reagisce a un tocco. Utilizzate questo strumento per trovare un punto di ingresso nel trend dopo una correzione. Se a sinistra vediamo che i livelli sono perfettamente al rialzo, allora possiamo presumere di aver trovato la fine del movimento ne
FREE
This indicators automatically draws the Support and resistances levels for you once you've dropped it on a chart.  It reduces the hustle of drawing and redrawing these levels every time you analysis prices on a chart. With it, all you have to do is dropped it on a chart, adjust the settings to your liking and let the indicator do the rest.  But wait, it gets better; the indicator is absolutely free!  Get the new and improved version here:  https://youtu.be/rTxbPOBu3nY Parameters Time-frame  -> T
FREE
The indicator detects important peaks and troughs (extremes) on the chart. These points can be used to plot support/resistance levels and trend lines, as well as any other graphical analysis. These points can serve as reference points for setting trading orders. The indicator does not redraw . Settings: Size_History  - the size of the calculated history. Num_Candles_Right  - number of candles to the right of the peak or trough. Num_Candles_Left  - number of candles to the left of the pea
Auto Levels
Yaroslav Varankin
Auto Level this tool is able to determine the levels of support and resistance. search and display when the price has broken through the level and when it pushed off from it. the indicator can be useful if you use resistance support levels in your trading. or the highs and lows of the price, then it will greatly simplify your work and help you more quickly and more accurately determine the rebound or breakdown of the current trend or tendencies level. blue line bottom uptrend red line on top dow
This indicator was created to spot potential reversals in the market. The Pinbar, or Pinnochio Bar, pattern is a a great candlestick pattern which can yield good trading results if traded properly. The idea behind this pattern is that price tries to trick us into thinking the wrong direction. When a Bullish Pinbar for example has formed, it tries to convince us price is going higher but in reality price is going down at the end of the bar. These patterns can be powerful reversal signals when use
This Automatic support/resistance indicator calculates various peaks and troughs of the price action, identifies relevant levels and draws support and resistance automatically. It uses the built-in "ZigZag" indicator in Metatrader as a data source hence, very much accurate indicator.  The support and resistance lines are contineusely updated as new levels and formed. The indicator has only 5 parameters to set, and mostly it can be used with the default values:  The description of the settings is
Индикатор уровней поддержки и сопротивления. Не перерисовывается и не меняет свои значения при переключении таймфреймов. С индикатором можно работать как на пробой уровней так и на отбой уровней поддержки и сопротивления Indicator of support and resistance levels. It does not redraw and does not change its values when switching timeframes. With the indicator, you can work both on the breakdown of levels and on the rebound of support and resistance levels
Fibonacci Retracement object is an object that has been provided by metatrader 4 platform. But  Fibonacci Retracement  object doesn't automated adjust the chart. You have to put and manage it manually to the chart. Because of that, this indicator was created. If you like using filbonacci retracement indicator, highly recommended to use Automated Fibonacci Retracement Indicator if you want to get better result in here: https://www.mql5.com/en/market/product/95515 LT Automated Fibonacci Retrace
FREE
Harmonic ABCD Universal
Mihail Matkovskij
5 (2)
The indicator displays harmonic ABCD patterns, as well as the market entry points, which allows the trader to make trading decisions quickly. Harmonic ABCD Universal is one of the few indicators that predict price movement by determining pivot points with a rather high probability long before the pivot itself. It supports sending push and email notifications, as well as alerts. The indicator scans all possible combinations on the chart for the current moment, and also in history, with the help o
This indicator filters the Zigzag indicator to calculate the main support and resistance levels. Variables minimum gap between peaks : is the distance (GAP) between the peaks of the Zigzag peaks sensitivity : Minimum number of nearby peaks look back: it means that it has to test the last 50 peaks in the Zigzag object name perfix: a prefix for level’s line name on chart
FREE
Pivot Trend
Harun Celik
5 (2)
Pivot trend indicator is a trend indicator that uses standard pivot calculation and some indicators. The purpose of the indicator is to calculate the possible trends using the pivot point. And to give the user an idea about trend direction. You can use this display as a trend indicator. Or with other indicators suitable for your strategy. Features The green bar represents the upward trend. The red bar represents the downward trend. The blue pivot point represents the upward trend. The yellow p
"Adjustable Fractals" - is an advanced version of fractal indicator, very useful trading tool! As we know   Standard fractals mt4 indicator does not have settings at all   - this is very inconvenient for traders Adjustable Fractals has resolved that issue - it has all necessary settings: Adjustable period   of indicator (recommended values - above 7) Adjustable distance   from Highs/Lows of price Adjustable design   af fractal arrows // More great Expert Advisors and Indicators are available he
I recommend you to read the   product's blog  (manual) from start to end so that it is clear from the beginning what the indicactor offers. This multi time frame and multi symbol supply and demand zone dashboard indicator sends alerts when the price has reached a supply/demand zone. It is also possible to use it to be alerted about regular double tops/bottoms instead of zones. It can be used with all time frames from M1 to MN. It is possible to use RSI, divergence (MACD, OsMA, RSI or Awesome) a
Necessary for traders: tools and indicators Waves automatically calculate indicators, channel trend trading Perfect trend-wave automatic calculation channel calculation , MT4 Perfect trend-wave automatic calculation channel calculation , MT5 Local Trading copying Easy And Fast Copy , MT4 Easy And Fast Copy , MT5 Local Trading copying For DEMO Easy And Fast Copy , MT4 DEMO Easy And Fast Copy , MT5 DEMO The homeopathic indicator is also called the CCI indicator. The CCI indicator was propos
FREE
Deep River AM
Andriy Matviyevs'kyy
The presented indicator is the author's implementation of the idea embodied in the Alligator indicator, which has already become a classic. The proposed product allows you to visually demonstrate the direction of price movement, temporary price rollbacks and zones of multidirectional price movement. Namely: The indicator lines go up and diverge from each other - a strong bullish trend; The indicator lines go down and diverge from each other - a strong bearish trend; The indicator lines go up but
FREE
LordAutoFibonnaci
Igor Pereira Calil
5 (1)
Lord Auto Fibonnaci is a free indicator for Meta Trader, in order to show the most famous chart in the financial market known as "Fibonnaci". As we can see in the images below, the fibonnaci table will automatically analyze the graph for you, with trend factors through percentage, almost infallible use, you can always work when the percentage is low or high, start shopping and sales on time, great for analyzing entries! In the images below we can see an example in gold in H4, where we are a
FREE
Most of those who trade in Forex are aware of the Elliott Wave Analysis System. So what is this wave analysis: This is the study and analysis of price, and not its derivatives (various indicators); The ability to determine price targets using Fibonacci tools (Elliott waves are closely related to Fibonacci numbers). You can get a clear picture of the market at all time scales; With EWA, it is possible to build a trading system with a clear description of the inputs and outputs. For simplicity, t
Fibonacci SR Indicator
Martin Eshleman
3 (2)
Fibonacci SR Indicator This indicator creates support and resistance lines. This indicator is based on Fibonacci Retracement and Extension levels. It will consider many combinations of the Fibonacci levels and draw support/resistance lines based on these. This indicator uses tops and bottoms drawn by the ZigZag indicator in its calculations. The ZigZag can also be drawn on the chart, if necessary. The indicator considers many combinations of past reversal points and Fibonacci ratio levels, and
FREE
Market Structure Zig Zag
Lesedi Oliver Seilane
4.78 (23)
Free Market structure zig zag to assist in price action trading the screenshots describe how to use and how to spot patterns new version comes with alerts, email alert and  push notification alert can be used on all pairs  can be used on all timeframes  you can add additional confirmation indicators the indicator shows you your higher high and low highs as well as your lower lows and lower highs  the indication makes price action analysis easier to spot.
FREE
Trend formation channel is a set of lines. The two central lines of the indicator represent moving averages of the specified type and period, they also form a small channel. The large channel is formed - the central lines of the indicator plus / minus the standard deviation estimate, multiplied by the coefficient selected by the user. The basic rule for plotting is that about 5% of prices should be outside these lines, and 95% - inside. If the price crosses the upper or lower line too often, th
Newlevel
Sergey Nanov
Indicator. Zones of support and resistance levels The most reliable tool in the hands of any technical analyst is support and resistance levels.It is these levels that magically work in the market, because the price then bounces off them, on the contrary, gaining maximum acceleration, punching them and striving for a new price point.However, in practice, many beginners face enormous difficulties in building them.This is due to the fact that the price may react quite differently to them, and ofte
Adamant Levels Logic A
Sattiraju Kottapalli
5 (1)
This Indicator Paints levels which are very ' Adamant ' and strong in nature. These levels act as strong Price rejection levels for a life time and never repaint. Disclaimer : If you are looking for a Fancy, colorful and eye catchy indicator please stay away. No trader can become a good trader without considering levels where the price can hold, bounce or break. These levels help traders to enter markets at a cheaper price. They can be Support resistance, demand supply, pivot point, Fibona
Follow The Line PRO
Oliver Gideon Amofa Appiah
3.67 (3)
FOLLOW THE LINE (PRO VERSION) This powerful indicator is the full and complete version of my free indicator called "Follow The Line". IT IS BASED ON the popular maxim that: "THE TREND IS YOUR FRIEND" It gives alarms and alerts of all kinds. IT DOES NOT REPAINT and can be used for all currency pairs and timeframes. AVOID FALSE SIGNALS: BUY ONLY when price closes above the green line and the green line is above the blue channel. SELL ONLY when price closes below the pink line and the pink lin
ICT Core Content Concepts turned into indicator plus all previous tools known from the  Position Smart Indicator . This makes it the Full PSI Private Version ( read more ) restricted up to now but available only after the Mentorship Core Content was made public on   YouTube. You will find many price action study tools like: Central Bank Dealing Range - CBDR Asian Range FLOUT Profiles and SD targets on the CBRD, Asian Range and Flout both on the   wicks   and on the   bodies Seek & Destroy Profil
Gli utenti di questo prodotto hanno anche acquistato
Gann Made Easy
Oleg Rodin
4.92 (62)
Gann Made Easy è un sistema di trading Forex professionale e facile da usare che si basa sui migliori principi del trading utilizzando la teoria di mr. WD Gann. L'indicatore fornisce segnali ACQUISTA e VENDI accurati, inclusi i livelli di Stop Loss e Take Profit. Puoi fare trading anche in movimento utilizzando le notifiche PUSH. Vi prego di contattarmi dopo l'acquisto! Condividerò i miei consigli di trading con te e fantastici indicatori bonus gratuitamente! Probabilmente hai già sentito parlar
ATTUALMENTE SCONTATO DEL 26% La soluzione migliore per ogni principiante o trader esperto! Questo indicatore è uno strumento di trading unico, di alta qualità e conveniente perché abbiamo incorporato una serie di caratteristiche proprietarie e una nuova formula. Con un solo grafico è possibile leggere la forza delle valute per 28 coppie Forex! Immaginate come migliorerà il vostro trading perché sarete in grado di individuare l'esatto punto di innesco di una nuova tendenza o di un'opportunit
Atomic Analyst
Issam Kassas
5 (3)
Innanzitutto, vale la pena sottolineare che questo indicatore di trading non è repaint, non è ridisegno e non presenta ritardi, il che lo rende ideale sia per il trading manuale che per quello automatico. Manuale utente: impostazioni, input e strategia. L'Analista Atomico è un indicatore di azione del prezzo PA che utilizza la forza e il momentum del prezzo per trovare un miglior vantaggio sul mercato. Dotato di filtri avanzati che aiutano a rimuovere rumori e segnali falsi, e aumentare il pote
TPSproTREND PrO
Roman Podpora
5 (15)
TPSpro TRENDPRO  - is a trend indicator that automatically analyzes the market and provides information about the trend and each of its changes, as well as giving signals for entering trades without redrawing! The indicator uses each candle, analyzing them separately. referring to different impulses - up or down impulse. Exact entry points into transactions for currencies, crypto, metals, stocks, indices!  -  Version MT5               DETAILED DESCRIPTION        /       TRADING SETUPS           
Advanced Supply Demand
Bernhard Schweigert
4.92 (310)
CURRENTLY 26% OFF !! Best Solution for any Newbie or Expert Trader! This indicator is a unique, high quality and affordable trading tool because we have incorporated a number of proprietary features and a new formula. With this update, you will be able to show double timeframe zones. You will not only be able to show a higher TF but to show both, the chart TF, PLUS the higher TF: SHOWING NESTED ZONES. All Supply Demand traders will love it. :) Important Information Revealed Maximize the potenti
TPSpro RFI Levels
Roman Podpora
5 (13)
A key element in trading is zones or levels from which decisions to buy or sell a trading instrument are made. Despite attempts by major players to conceal their presence in the market, they inevitably leave traces. Our task was to learn how to identify these traces and interpret them correctly. Reversal First Impulse levels (RFI)   -  Version MT5                INSTRUCTIONS                 RUS                 ENG                                       R ecommended to use with an indicator   -  
ON Trade Optuma Astro
Abdullah Alrai
5 (4)
Presentazione dell'Indicatore Astronomico per MT4: Il tuo compagno di trading celeste definitivo Sei pronto a elevare la tua esperienza di trading a livelli celesti? Non cercare oltre, il nostro rivoluzionario Indicatore Astronomico per MT4 è qui. Questo strumento innovativo va oltre gli indicatori di trading tradizionali, sfruttando algoritmi complessi per offrirti intuizioni astronomiche senza pari e calcoli di precisione. Un universo di informazioni a portata di mano: Ammira un pannello compl
Scopri il segreto per il trading Forex di successo con il nostro indicatore MT4 personalizzato! Ti sei mai chiesto come raggiungere il successo nel mercato Forex, guadagnando costantemente profitti minimizzando il rischio? Ecco la risposta che hai cercato! Permettici di presentare il nostro indicatore MT4 proprietario che rivoluzionerà il tuo approccio al trading. Versatilità unica Il nostro indicatore è appositamente progettato per gli utenti che preferiscono le formazioni di candele Ren
Presentazione       Quantum Trend Sniper Indicator   , l'innovativo indicatore MQL5 che sta trasformando il modo in cui identifichi e scambi le inversioni di tendenza! Sviluppato da un team di trader esperti con un'esperienza di trading di oltre 13 anni,       Indicatore Quantum Trend Sniper       è progettato per spingere il tuo viaggio di trading verso nuove vette con il suo modo innovativo di identificare le inversioni di tendenza con una precisione estremamente elevata. *** Acquista Quant
Break and Retest
Mohamed Hassan
4.56 (9)
‍You can visually backtest Break & Retest to see how it behaved in the past!     Manual guide:   Click here $65  for only 1  copy left! Next price is $120 .  This Indicator only places quality trades when the market is really in your favor with a clear break and retest. Patience is key with this price action strategy! Recommended timeframes: M1 for Scalpers.  M15 for Intraday traders. H1 & H4 for Day traders. Other timeframes are also excellent! After many months of hard w
Vi presentiamo ON Trade Waves Patterns Harmonic Elliot Wolfe, un indicatore avanzato progettato per rilevare vari tipi di pattern sul mercato utilizzando metodi sia manuali che automatici. Ecco come funziona: Pattern Armonici: Questo indicatore è in grado di individuare pattern armonici che appaiono sul vostro grafico. Questi pattern sono fondamentali per i trader che praticano la teoria del trading armonico, come descritta nel libro di Scott Carney "Harmonic Trading vol 1 & 2". Che li disegniat
Trend Screener
STE S.S.COMPANY
4.83 (88)
Indicatore di tendenza, soluzione unica rivoluzionaria per il trading di tendenze e il filtraggio con tutte le importanti funzionalità di tendenza integrate in un unico strumento! È un indicatore multi-timeframe e multi-valuta al 100% non ridipingibile che può essere utilizzato su tutti i simboli/strumenti: forex, materie prime, criptovalute, indici e azioni. Trend Screener è un indicatore di tendenza che segue un indicatore efficiente che fornisce segnali di tendenza a freccia con punti nel gra
74% discount for the next 10 buyers (original price $605): 1 left Get a 50% bonus by buying (or even renting) any of our products. After buying (or renting), send a message for more information. 3 Indicators in 1 indicator Strategy based on price action Made specifically for the best forex currency pairs Can be used in the best time frame of the market at a very reasonable price This indicator is basically 3 different indicatos . But we have combined these 3 indicators in 1 indicator so th
Currency Strength Wizard è un indicatore molto potente che ti fornisce una soluzione all-in-one per un trading di successo. L'indicatore calcola la potenza di questa o quella coppia forex utilizzando i dati di tutte le valute su più intervalli di tempo. Questi dati sono rappresentati in una forma di indice di valuta facile da usare e linee elettriche di valuta che puoi utilizzare per vedere il potere di questa o quella valuta. Tutto ciò di cui hai bisogno è collegare l'indicatore al grafico che
on free demo press zoom out button to see back.. cnt number is bar numbers.you can change up to 3000 related to chart bars numbers. minimum value is 500. there is g value set to 1.01. no need to change it. this indicator almost grail,no repaint and all pairs ,all timeframe indicator. there is red and blue histograms. if gold x sign comes on red histogram that is sell signal. if blue x sign comes on blue histogram that is buy signal. this indicator on thise version works all pairs.al timeframes
FX Power MT4 NG
Daniel Stein
5 (9)
Ricevi il tuo aggiornamento quotidiano sul mercato con dettagli e schermate tramite il nostro Morning Briefing qui su mql5 e su Telegram ! FX Power MT4 NG è la nuova generazione del nostro popolare misuratore di forza delle valute, FX Power. Cosa offre questo misuratore di forza di nuova generazione? Tutto ciò che avete amato dell'FX Power originale IN PIÙ Analisi della forza di ORO/XAU Risultati di calcolo ancora più precisi Periodi di analisi configurabili individualmente Limite di calcolo pe
Innanzitutto, vale la pena sottolineare che questo Strumento di Trading è un Indicatore Non-Ridipingente, Non-Ridisegnante e Non-Laggante, il che lo rende ideale per il trading professionale. Corso online, manuale utente e demo. L'Indicatore Smart Price Action Concepts è uno strumento molto potente sia per i nuovi che per i trader esperti. Racchiude più di 20 utili indicatori in uno solo, combinando idee di trading avanzate come l'Analisi del Trader del Circolo Interno e le Strategie di Trading
Scalper Vault
Oleg Rodin
5 (28)
Scalper Vault è un sistema di scalping professionale che ti fornisce tutto il necessario per scalping di successo. Questo indicatore è un sistema di trading completo che può essere utilizzato dai trader di forex e opzioni binarie. L'intervallo di tempo consigliato è M5. Il sistema fornisce segnali di freccia accurati nella direzione della tendenza. Ti fornisce anche i segnali più alti e più bassi e i livelli di mercato di Gann. Gli indicatori forniscono tutti i tipi di avvisi, comprese le notifi
Advanced Currency IMPULSE with ALERT
Bernhard Schweigert
4.91 (494)
ATTUALMENTE SCONTATO DEL 31%! La soluzione migliore per ogni principiante o trader esperto! Questo indicatore è uno strumento di trading unico, di alta qualità e conveniente perché abbiamo incorporato una serie di caratteristiche proprietarie e una formula segreta. Con un solo grafico fornisce avvisi per tutte le 28 coppie di valute. Immaginate come migliorerà il vostro trading perché sarete in grado di individuare l'esatto punto di innesco di una nuova tendenza o opportunità di scalping!
Shepherd Harmonic Pattern
Abdullah Alrai
4.68 (59)
Questo indicatore rileverà modelli armonici disegnati sul grafico mediante metodi manuali e automatici. Puoi consultare il manuale dell'utente tramite questo link: Aggiungi la tua recensione e contattaci per ottenerlo. C'è una versione gratuita per provare questo prodotto su MT4. Puoi usarlo per rilevare i modelli di Gartley e Nenstar: https://www.mql5.com/en/market/product/30181 Puoi acquistare la versione completa di MT4 da: https://www.mql5.com/en/market/product/15212 Note L'indicatore ha un
Market Reversal Alerts
LEE SAMSON
4.21 (121)
Il profitto dalla struttura del mercato cambia quando il prezzo si inverte e si ritira. L'indicatore di avviso di inversione della struttura del mercato identifica quando una tendenza o un movimento di prezzo si sta avvicinando all'esaurimento e pronto a invertire. Ti avvisa dei cambiamenti nella struttura del mercato che in genere si verificano quando stanno per verificarsi un'inversione o un forte pullback. L'indicatore identifica inizialmente i breakout e lo slancio del prezzo, ogni volta
PRO Renko System
Oleg Rodin
5 (25)
PRO Renko System è un sistema di trading altamente accurato appositamente progettato per il trading di grafici RENKO. Questo è un sistema universale che può essere applicato a vari strumenti di trading. Il sistema neutralizza efficacemente il cosiddetto rumore di mercato che consente di accedere a segnali di inversione accurati. L'indicatore è molto facile da usare e ha un solo parametro responsabile della generazione del segnale. Puoi facilmente adattare lo strumento a qualsiasi strumento
Attualmente 20% di sconto! La soluzione migliore per ogni principiante o trader esperto! Questo software per cruscotti funziona su 28 coppie di valute. Si basa su 2 dei nostri indicatori principali (Advanced Currency Strength 28 e Advanced Currency Impulse). Offre un'ottima panoramica dell'intero mercato Forex. Mostra i valori di forza delle valute avanzate, la velocità di movimento delle valute e i segnali per 28 coppie Forex in tutti i (9) timeframe. Immaginate come migliorerà il vostro t
Symbols must be separated by commas (,) and entered into the parameters exactly as displayed by your broker to ensure they are recognized in the dashboard. These symbols will be used for analysis by the indicator. With one click open any pair any timeframe directly from dashboard The MA Speedometer Dashboard is a highly functional MetaTrader 4 (MT4) indicator designed to enhance trading strategies through dynamic market analysis. It offers robust features for identifying market trends, trading
TrendMaestro
Stefano Frisetti
5 (2)
nota: questo indicatore e' per METATRADER4, se vuoi la versione per  METATRADER5 questo e' il link:  https://www.mql5.com/it/market/product/108123 TRENDMAESTRO ver 2.4 TRENDMAESTRO riconosce un nuovo TREND sul nascere, non sbaglia mai. La sicurezza di identificare un nuovo TREND non ha prezzo. DESCRIZIONE TRENDMAESTRO identifica un nuovo TREND sul nascere, questo indicatore prende in esame la volatilita' i volumi ed il momentum per identificare il momento in cui c'e' un'esplosione di uno 
Entry Points Pro
Yury Orlov
4.7 (225)
Indicatore top per MT5 che fornisce segnali accurati per entrare in un trade senza riverniciare! Può essere applicato a qualsiasi attività finanziaria: forex, criptovalute, metalli, azioni, indici.  La versione MT5 è qui Fornirà segnali di trading piuttosto precisi e ti dirà quando è meglio aprire un trade e chiuderlo. Guarda il video (6:22) con un esempio di elaborazione di un solo segnale che ha ripagato l'indicatore! La maggior parte dei trader migliora i propri risultati di trading
IX Power MT4
Daniel Stein
5 (5)
IX Power porta finalmente l'imbattibile precisione di FX Power ai simboli non-Forex. Determina con precisione l'intensità delle tendenze a breve, medio e lungo termine dei vostri indici preferiti, azioni, materie prime, ETF e persino criptovalute. Potete analizzare tutto ciò che il vostro terminale ha da offrire. Provatelo e sperimentate come il vostro tempismo migliori significativamente durante il trading. Caratteristiche principali di IX Power Risultati di calcolo precisi al 100% e n
Trend Forecasting
Mohamed Hassan
5 (20)
This indicator is unstoppable when combined with our other indicator called Katana. After purchase, send us a message and you could get Katana for FREE as a BONUS After purchase, send us a private message for your instructions.  MT5 version: click here 3 copies left available at $45. Next price is $95. Don't miss this great deal!  The Trend Forecasting indicator is a very unique & easy tool that is able to make prediction about future price movement based on the signals generated
Up down v6T
Guner Koca
5 (1)
Thise indicator is up down v6  comes with tradingwiev pinescript. purchased people, after installed on terminal ,contact me on mql5  to get BONUS  TradingView pinescript. up-down indicator is no repaint and works all pairs and lower than weekly time frames charts. it is suitable also 1 m charts for all pairs. and hold long way to signal. dont gives too many signals. when red histogram cross trigger line that is up signal.and price probably will down when blue histogram cross trigger line that
Scalper Inside PRO
Alexey Minkov
4.75 (57)
An exclusive indicator that utilizes an innovative algorithm to swiftly and accurately determine the market trend. The indicator automatically calculates opening, closing, and profit levels, providing detailed trading statistics. With these features, you can choose the most appropriate trading instrument for the current market conditions. Additionally, you can easily integrate your own arrow indicators into Scalper Inside Pro to quickly evaluate their statistics and profitability. Scalper Inside
Altri dall’autore
Lo scopo di questo indicatore è trovare i livelli di Murray su tutti i timeframe e combinarli in livelli combo che includono livelli di segnale basati su forti livelli di Murray (+2, +1, 8, 4, 0, -1, -2). Più piccolo è il timeframe, maggiori sono le possibilità di vedere immediatamente il livello combo. Sarà evidenziato in colore. Se si posiziona il cursore su un numero qualsiasi, apparirà un tooltip che indicherà a quale timeframe appartiene il livello. Tuttavia, il timeframe corrente sarà semp
UPD1 Volume BOX
Vitaliy Kuznetsov
5 (14)
L'indicatore mostra il profilo del volume orizzontale nell'area specificata (BOX) e il volume massimo (POC). Caratteristiche del prodotto. 1. Puoi usare i tick o solo il prezzo. 2. Spaziatura della griglia adattiva (M1-MN). 3. Fase di ricerca adattiva ad alto volume (mediana) a seconda delle dimensioni della casella. 4. Colore camaleonte automatico per linee di scatole e pulsanti. 5. Caselle multiple, facili da creare ed eliminare. 6. Area del volume del 70% (abilitata nelle impostazioni). 7. 
Pannello di trading con ordini preimpostati e calcolo automatico del lotto per il terminale MT4. Attenzione, il Trading Panel non funziona nel tester della strategia (solo il test del trailing stop). Manuale, Descrizione, Download Light Demo. I trader di successo si distinguono per l'autodisciplina e la gestione competente. Se usi un lotto fisso, allora sei a rischio. Dopotutto, in diversi intervalli di tempo, una distanza diversa e una transazione in perdita possono bloccare diversi profitti. S
UPD1 Volume Cluster
Vitaliy Kuznetsov
4.8 (15)
L'algoritmo trova le zone di volatilità ridotta in base all'indicatore UPD1 Trend Direction e traccia il volume orizzontale massimo in base all'indicatore UPD1 Volume Box . Di norma, un forte movimento di tendenza si verifica quando si esce dall'accumulo. Se il prezzo ha lasciato l'accumulo, può testare il suo volume orizzontale massimo (POC). Smart Alert sono disponibili nelle impostazioni. Parametri di input. Impostazioni di base. Bars Count – numero di barre della cronologia su cui verrà
FREE
UPD1 Profile Levels
Vitaliy Kuznetsov
5 (6)
L'indicatore trova i livelli del volume di prezzo massimo e minimo (profilo di mercato) nell'istogramma di lavoro per il numero specificato di barre.   Profilo composito. L'altezza dell'istogramma è completamente automatica e si adatta a qualsiasi strumento e periodo di tempo. Viene utilizzato l'algoritmo dell'autore e non ripete analoghi noti. L'altezza dei due istogrammi è approssimativamente uguale all'altezza media della candela. Smart alert (smart alert) ti aiuta a comunicare il prezzo rel
UPD1 Impulse Level
Vitaliy Kuznetsov
5 (8)
L'indicatore trova le onde impulsive sul grafico. Analizza la rottura del canale frattale e costruisce i livelli di impulso.  Inoltre, Trova i luoghi presunti Di false rotture e sequestro di liquidità. Nelle impostazioni, è possibile abilitare il dashboard multivaluta e selezionare qualsiasi strumento e intervallo di tempo. Avviso scegli tra il programma corrente o l'intero elenco. Ci sono segnali separati di impulso e falsa rottura. Blog-Link -  Retest and Fake Breakout with UPD1 . Modelli
UPD1 Trend Direction
Vitaliy Kuznetsov
4.78 (9)
Questo indicatore viene utilizzato per visualizzare le posizioni piatte e di tendenza. Il design si basa su un oscillatore. Viene utilizzato come filtro aggiuntivo, sia per il trading su un grafico normale che per le opzioni binarie. Le posizioni piatte vengono utilizzate nell'indicatore UPD1 volume Cluster per il trading secondo il concetto di Smart Money. Un avviso incorporato segnala i luoghi più ipercomprati / ipervenduti. Parametri di input. Impostazioni di base. Bars Count - specifica
FREE
L'indicatore costruisce un semaforo a tre periodi e un pattern di inversione 123 dall'estremo. Il segnale arriva all'apertura della seconda candela. Questo pattern può essere negoziato in diversi modi (test point 3, breakout e altri). L'uscita dal canale o il breakout della trendline è il principale fattore scatenante per trovare un punto di ingresso. Le icone sono colorate in base ai livelli di Fibonacci. Le icone gialle indicano il test di un livello al quale il segnale è amplificato. Utilizz
UPD1 Volume Pixel
Vitaliy Kuznetsov
5 (3)
L'indicatore Trova il volume basso, alto, estremo in base ai coefficienti specificati e li colora nei colori specificati. Sostituisce la funzione di disegno del volume standard nel terminale metatrader. Le candele possono anche essere dipinte nel colore del volume. Sulle candele con volume estremo, viene determinato il volume orizzontale massimo (cluster/POC). A seconda della sua posizione (spinta, neutro, arresto), il cluster ha anche il suo colore. Se il cluster è in ombra e la candela ha un
UPD1 Volume Footer
Vitaliy Kuznetsov
5 (8)
L'indicatore mostra il volume verticale. Nelle impostazioni ci sono 2 fattori per determinare l'alto e l'estremo e 1 per determinare il basso volume. Un algoritmo simile viene utilizzato anche nell'indicatore UPD1 Volume Pixel . Quando viene rilevato un volume specificato, l'istogramma viene colorato nel colore corrispondente. La larghezza dell'istogramma viene selezionata automaticamente, a seconda della scala. Di norma, il prezzo reagisce al volume massimo e minimo. Ma è necessario utilizzare
FREE
UPD1 Volume TimeFrame POC
Vitaliy Kuznetsov
5 (3)
L'indicatore visualizza il volume orizzontale massimo nel periodo di tempo selezionato. Basato sull'indicatore UPD1 Volume Box . Le linee possono essere collegate o separate. Nelle impostazioni, è possibile abilitare l'avviso Smart Touch. Tale indicatore sarà utile per coloro che commerciano utilizzando il profilo di mercato e il concetto di Smart Money. Parametri di input. Impostazioni di base. Bars Count - specifica il numero di barre su cui verrà disegnato TF POC. Data Source - periodo d
FREE
UPD1 Watermark MT4
Vitaliy Kuznetsov
5 (1)
L'indicatore visualizza qualsiasi testo e qualsiasi immagine sul grafico e può anche visualizzare le informazioni richieste dalle macro. Sono disponibili tre blocchi di testo e un blocco per le immagini. Sono disponibili la selezione dei caratteri, la dimensione, il colore, l'indentazione e il posizionamento. Se si desidera marcare le schermate o visualizzare le informazioni richieste su un grafico, UPD1 Watermark sarà uno strumento molto utile. Descrizione delle impostazioni. Impostazioni
FREE
UPD1 Rsi Dots Dashboard
Vitaliy Kuznetsov
5 (1)
L'indicatore mostra segnali basati sull'oscillatore RSI terminale sul grafico. È possibile filtrare i segnali ripetuti. Qui l'oscillatore viene utilizzato per cercare un segnale inverso. È raccomandato come punto di ingresso nelle strategie swing e nel trading dai livelli. È disponibile una dashboard multi-valuta. Con esso, puoi facilmente passare da un grafico all'altro. Nelle discussioni sui prodotti, è possibile suggerire un algoritmo in cui è possibile incorporare un dashboard. Parame
FREE
UPD1 X00 Levels
Vitaliy Kuznetsov
4.92 (12)
L'indicatore mostra livelli circolari sul grafico. Sono anche chiamati livelli psicologici, bancari o dei principali operatori. A questi livelli si verifica una vera e propria lotta tra tori e orsi, l'accumulo di molti ordini, che porta a un aumento della volatilità. L'indicatore si adatta automaticamente a qualsiasi strumento e timeframe. Se il livello 80 viene rotto e poi testato, acquistare. Se il livello 20 viene rotto e poi testato, vendere. L'obiettivo è 00. Attenzione. A causa dei forti
FREE
UPD1 Impulse Channel
Vitaliy Kuznetsov
5 (8)
Un canale non disegnato per il trading di tendenza. È costruito dall'ATR e ha un limite di volatilità opposto. L'indicatore si è dimostrato valido nella strategia sui livelli di impulso e sui falsi breakout. Il punto di ingresso va cercato sulla correzione della linea dell'indicatore e il take profit va fissato sul confine opposto. Blog-Link -   Retest and Fake Breakout with UPD1 . Parametri di ingresso. Bars Count   - cronologia da visualizzare. ATR   - periodo di calcolo. Coefficient   -
FREE
UPD1 X00 Levels MT5
Vitaliy Kuznetsov
5 (1)
L'indicatore mostra livelli circolari sul grafico. Sono anche chiamati livelli psicologici, bancari o dei principali operatori. A questi livelli si verifica una vera e propria lotta tra tori e orsi, l'accumulo di molti ordini, che porta a un aumento della volatilità. L'indicatore si adatta automaticamente a qualsiasi strumento e timeframe. Se il livello 80 viene rotto e poi testato, acquistare. Se il livello 20 viene rotto e poi testato, vendere. L'obiettivo è 00. Attenzione. A causa dei forti
FREE
UPD1 Profile Levels MT5
Vitaliy Kuznetsov
5 (3)
L'indicatore trova i livelli del volume di prezzo massimo e minimo (profilo di mercato) nell'istogramma di lavoro per il numero specificato di barre.   Profilo composito. L'altezza dell'istogramma è completamente automatica e si adatta a qualsiasi strumento e periodo di tempo. Viene utilizzato l'algoritmo dell'autore e non ripete analoghi noti. L'altezza dei due istogrammi è approssimativamente uguale all'altezza media della candela. Smart alert (smart alert) ti aiuta a comunicare il prezzo rela
UPD1 Murrey Math Levels
Vitaliy Kuznetsov
5 (7)
I livelli matematici di Murray si basano sulle osservazioni di Gann e sulla sua teoria della quadraticità dei prezzi. Secondo Gunn, il prezzo si muove in intervalli di 1/8. Questi 1/8 ci permettono di ottenere diversi livelli di resistenza e supporto per un dato grafico, che hanno le loro caratteristiche. Quando i livelli -2 o +2 vengono rotti o quando la volatilità diminuisce, vengono ricostruiti. È possibile scegliere il periodo da visualizzare (corrente o tutta la storia). Tutte le linee son
FREE
L'Average True Range ( ATR ) è una misura della volatilità del mercato in un determinato numero di giorni. Non ci si deve aspettare un grande movimento di continuazione quando il prezzo ha raggiunto la fine del range. Si ritiene che il mercato abbia esaurito il carburante. Se il prezzo non ha raggiunto il limite, ha ancora un margine di movimento. La formula dell'indicatore consente di calcolare i livelli High-Low sia in aggregato che singolarmente. È inoltre possibile utilizzare questi livelli
FREE
UPD1 Fibo Levels
Vitaliy Kuznetsov
5 (3)
L'indicatore analizza il numero di candele specificato e costruisce i livelli di Fibonacci in base al massimo e al minimo. Poiché i livelli vengono ricostruiti, siamo interessati al lato destro dell'intervallo. Il prezzo è magnetico rispetto ai livelli e reagisce a un tocco. Utilizzate questo strumento per trovare un punto di ingresso nel trend dopo una correzione. Se a sinistra vediamo che i livelli sono perfettamente al rialzo, allora possiamo presumere di aver trovato la fine del movimento ne
FREE
UPD1 D Levels
Vitaliy Kuznetsov
5 (1)
L'indicatore dei livelli si basa sui dati del giorno precedente. La formula matematica determina i livelli di entrata e di uscita.  Raccomandazioni di trading. I livelli vengono negoziati all'inizio della sessione europea, quando appare la volatilità. In caso di volatilità insufficiente, utilizzare metà del take profit per uscire. Se il prezzo si è invertito a metà del take profit, allora sull'inversione cercate un target anche al livello di metà del take profit. Se il prezzo rimbalza dal liv
FREE
UPD1 Pivot Levels
Vitaliy Kuznetsov
5 (3)
L'indicatore mostra i classici livelli di pivot sul grafico, calcolati sulla base del giorno precedente. È possibile scegliere da quale ora calcolare la formula. Scambiate in un mercato piatto per l'inversione. In un mercato in trend, utilizzateli come target. Combinateli con le vostre strategie per un trading di successo. I livelli vengono costruiti utilizzando i buffer e visualizzati sull'intero storico delle quotazioni disponibili. Parametri di input. Start Hour - da quale ora considerar
FREE
UPD1 Pin Bar Dashboard
Vitaliy Kuznetsov
5 (2)
L'indicatore visualizza il modello di candela della barra Pin. Le impostazioni del rapporto consentono di regolare facilmente il rapporto tra ombra, corpo e dimensione. È possibile filtrare per tendenza (2 medie mobili) e per inversione (RSI e bande di Bollinger). Questo è il modello più popolare di Price Action. Disponibile cruscotto multivaluta. Con esso, puoi passare facilmente da un grafico all'altro. Modelli di trading: Retest per tendenza. Falsa ripartizione. Terzo. EURUSD, GBPUSD, XA
L'indicatore cerca le candele a impulso e le visualizza sul grafico. Include un filtro per le ombre. Trova anche i livelli di breakout delle Bande di Bollinger. È possibile attivare il cruscotto multivaluta nelle impostazioni. Per gli avvisi si può scegliere tra il grafico corrente o l'intero elenco. Blog-Link -  Retest and Fake Breakout with UPD1 Modelli di trading: Trend retest. Falso breakout. Altri. EURUSD, GBPUSD, XAUUSD, ... M15, M30, H1. Parametri di ingresso. Di base. Bars Count
L'indicatore costruisce un semaforo a tre periodi e un pattern di inversione 123 dall'estremo. Il segnale arriva all'apertura della seconda candela. Questo pattern può essere negoziato in diversi modi (test point 3, breakout e altri). L'uscita dal canale o il breakout della trendline è il principale fattore scatenante per trovare un punto di ingresso. Le icone sono colorate in base ai livelli di Fibonacci. Le icone gialle indicano il test di un livello al quale il segnale è amplificato. Utilizz
L'indicatore visualizza il modello "Rails" sul grafico. Questo schema consiste in due candele multidirezionali con corpi identici e piccole ombre. Se sul timeframe corrente il pattern "Rails", sul timeframe x2 apparirà come una Pin Bar (Doji). Questo indicatore è stato creato per trovare automaticamente il pattern nel modo più efficiente, con impostazioni logicamente semplici che possono essere facilmente modificate. È possibile filtrare in base alla tendenza (2 medie mobili) e all'inversione (
Un indicatore che visualizza il pattern candela inghiottendo. Nelle impostazioni, è possibile specificare il tipo di engulfing (corpo, ombra e combinazione). È possibile filtrare per tendenza (2 medie mobili) e per inversione (RSI e Bande di Bollinger). Questo è un modello di azione dei prezzi molto popolare. È disponibile una dashboard multi-valuta. Con esso, puoi facilmente passare da un grafico all'altro. Modelli di trading: Ripetere il test per tendenza. Falso breakout. Blocco ordine. Alt
L'indicatore mostra un segnale sul grafico quando la seconda candela è all'interno della prima, cioè non ha superato i suoi limiti. Questo modello di candela è chiamato Inner Bar. Questo schema non è così popolare come la Pin Bar o il Engulfing, ma viene talvolta utilizzato da alcuni trader. Esiste la possibilità di filtrare per tendenza (2 medie mobili) e per inversione (RSI e Bande di Bollinger). È disponibile un pannello multivaluta. Con il suo aiuto è possibile passare facilmente da un graf
Filtro:
Nessuna recensione
Rispondi alla recensione
Versione 3.81 2023.12.23
minor bugs fixed
added dark dashboard theme (select automatically or manually)
compiled a new build 1400
Versione 3.22 2023.09.05
New build
Versione 3.20 2022.09.22
fixed some bugs
completely redone dashboard:
+ one dashboard with all its elements - 1 object
+ responsive design
+ drag and drop works on any part
+ does not conflict with other dashboards
+ when interacting, it is displayed on the front layer
+ saves its last location when switching/restarting the terminal, including when using templates
+ each cell is calculated separately
+ does not count all cells again when switching a currency pair (fast switching)
Versione 3.12 2022.05.31
Fixed working with the template when the dashboard is enabled