UPD1 Murrey Math Combo Levels MT5
- Indicatori
- Vitaliy Kuznetsov
- Versione: 2.51
- Aggiornato: 11 dicembre 2023
- Attivazioni: 20
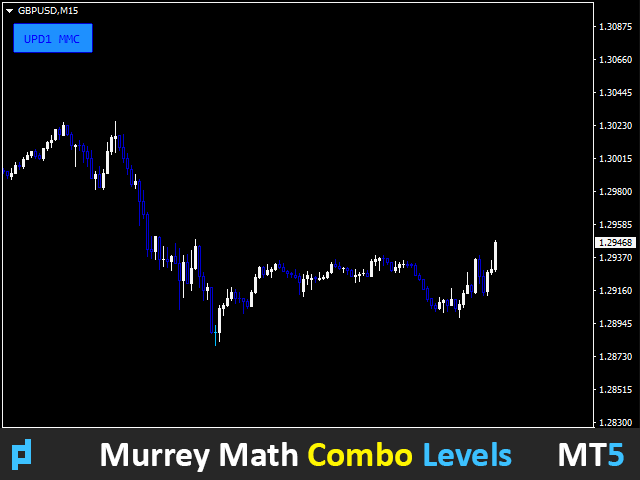
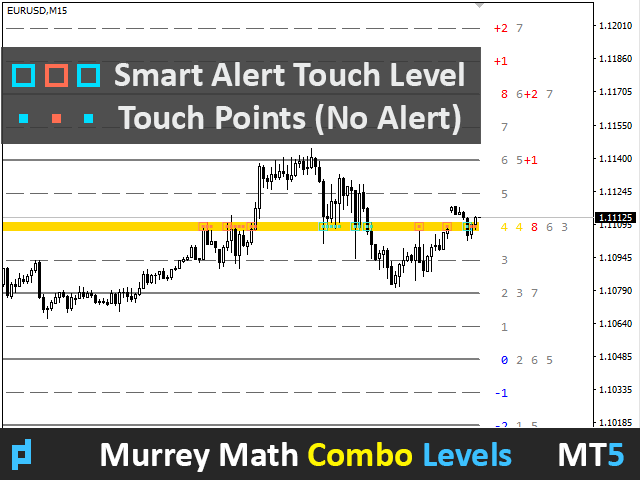
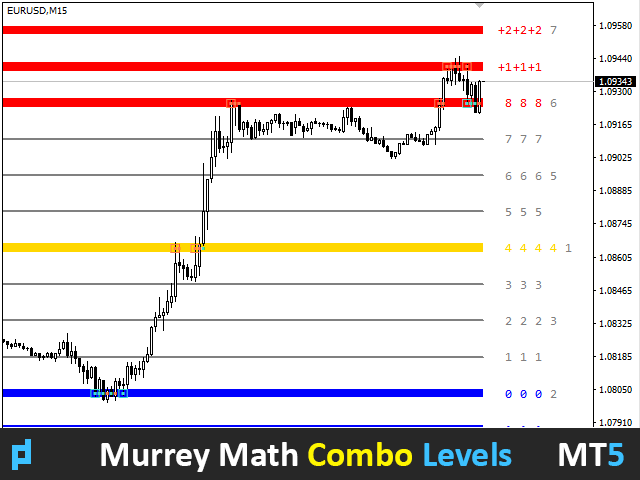
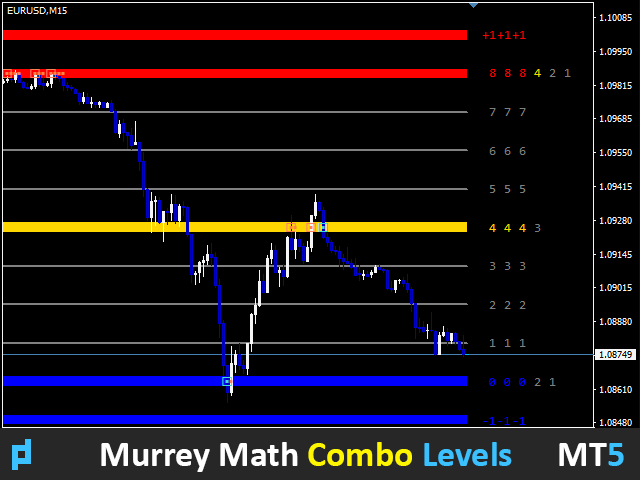
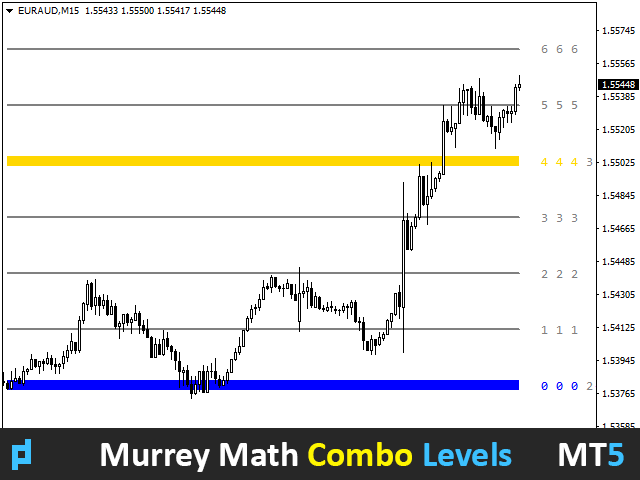
Lo scopo di questo indicatore è trovare i livelli di Murray su tutti i timeframe e combinarli in livelli combo che includono livelli di segnale basati su forti livelli di Murray (+2, +1, 8, 4, 0, -1, -2).
Più piccolo è il timeframe, maggiori sono le possibilità di vedere immediatamente il livello combo. Sarà evidenziato in colore.
Se si posiziona il cursore su un numero qualsiasi, apparirà un tooltip che indicherà a quale timeframe appartiene il livello. Tuttavia, il timeframe corrente sarà sempre visibile all'estrema sinistra.
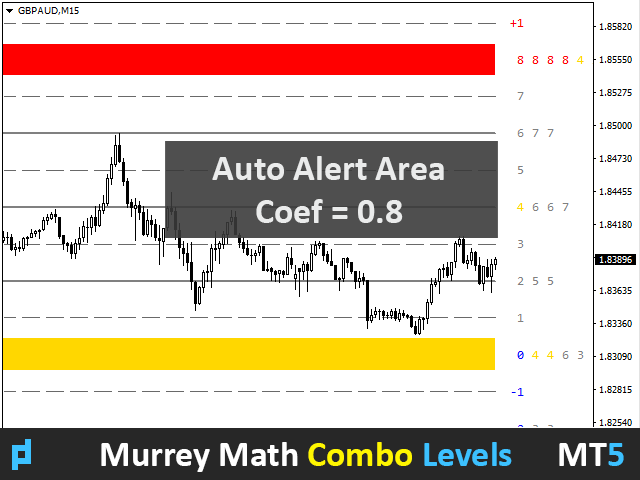
L'avviso intelligente vi aiuterà a segnalare il prezzo relativo al livello del segnale combo.
La dashboard del video non è una funzionalità richiesta e non è inclusa in questo documento! Ancora in fase di sviluppo.
Raccomandazioni di trading.
Non è consigliabile fare trading sui rimbalzi dai livelli combo senza un'analisi tecnica aggiuntiva.
La probabilità di rimbalzo dai livelli blu e rossi è più alta.
Il prezzo è magnetizzato sul livello combo, che non è ancora stato testato dal prezzo (128 candele fa). In questo caso, si consiglia di utilizzare una strategia di tendenza con presa di livello (un livello superiore/inferiore).
Quando il prezzo si muove verso un livello rosso o blu, il giallo non viene scambiato sui rimbalzi lungo il percorso (questo può interrompere il momentum).
I principianti sono fortemente sconsigliati dal fare trading su un rimbalzo da un livello combo, a meno che non ci sia un livello combo opposto.
È preferibile operare su un rimbalzo nella direzione del trend.
Per saperne di più, consultare il link al blog - Murrey Math Trading with UPD1.
Descrizione delle impostazioni.
Impostazioni principali.
Period - numero di candele per il calcolo dei livelli.
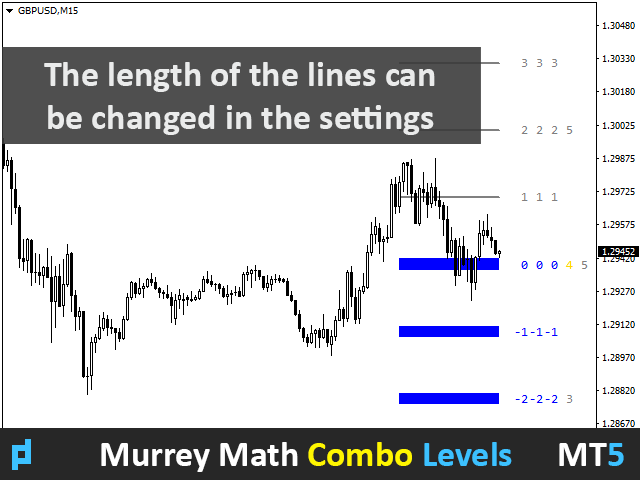
Length - lunghezza degli oggetti di livello in barre.
Do Not Calc M30 if Timeframe Lower - non calcolare i livelli dal timeframe M30 (disattivato). Con questa impostazione attivata, i livelli combinati saranno meno, ma la qualità teoricamente aumenterà.
Do Not Calc MN (Easier Loading of Quotes) - se la valuta non viene caricata, le quotazioni possono essere caricate per 40 secondi (MetaTrader5). Ma se si esclude il timeframe del mese, la velocità di caricamento delle quotazioni è di 10 secondi. Questo accade solo al primo caricamento dell'indicatore.
Pulsante.
Visual Button - se visualizzare o meno il pulsante.
Corner - selezione dell'angolo di vincolo.
Indent X - spostamento lungo l'asse x in pixel.
Indent Y - spostamento lungo l'asse y in pixel.
Etichetta visiva.
Label Visual - selezione della visualizzazione o meno dell'etichetta di livello.
Label Font Size - dimensione del carattere.
Label Shift Bars - imposta l'indentazione in barre rispetto al livello.
Label Tooltip - se visualizzare o meno il tooltip quando si passa il cursore sul livello.
Impostazioni dei livelli semplici e combinati.
Simple Line Width - specifica lo spessore delle linee che non sono combo.
Simple Line Color - specifica il colore delle linee.
Simple Line Style - selezionare lo stile di disegno della linea (punti, linee e altro).
Number Of Levels - specificare il numero di livelli (numero) necessari per contrassegnare questo livello combo (non un livello di segnale).
Line Width - specifica lo spessore delle linee.
Line Color - specificare il colore delle linee.
Number Of Signal Levels - specificare il numero di livelli di segnale (numero) necessari per contrassegnare questo livello combo.
Combo Line Width - lo spessore del livello combo del segnale.
Signal Combo Levels - livelli separati da virgole, che vengono considerati come livelli di segnale. In altre parole, se ce ne sono più di 3 in qualsiasi variazione, si ottiene un livello combo di segnale.
Signal Combo Color - seleziona il colore del livello combo del segnale.
Spec Combo Sell Levels - elenco dei livelli di vendita estremi che consideriamo come livelli di segnale per le combo speciali.
Spec Combo Sell Color - selezionare il colore della combo speciale Sell.
Spec Combo Buy Levels - elenco dei livelli di acquisto estremi che consideriamo come livelli di segnalazione per le combo speciali.
Spec Combo Buy Color - selezionare il colore della combo speciale Buy.
Impostazioni degli avvisi.
Alert Type Line - selezione del tipo di allarme (Tutte le Combo / Solo Spec Combo).
Sensivity Coef - livello di altezza della zona di allarme (0,25).
Smart Alert Touch Combo - impostazione principale che abilita l'avviso quando il prezzo tocca il livello di allarme. Inoltre, viene visualizzato come un quadrato vuoto al centro del livello.
Repeat Signal - ripete il segnale del livello alla candela successiva.
Show Touch Points - visualizza tutti i punti toccati dai livelli del segnale da parte del prezzo. Non è un segnale e funziona solo quando è abilitato l'allarme.
Alert When Levels Recalc - un allarme separato e indipendente che notifica se i livelli di Murray vengono ricostruiti.
Alert Work Time - specifica il periodo di tempo in cui l'avviso sarà attivo.
Alert Pop Up - abilita/disabilita l'avviso pop-up.
Alert Push - abilita/disabilita la notifica al telefono.
Alert Email - abilita/disabilita la notifica via e-mail.
Alert Sound - abilita/disabilita la notifica sonora dell'avviso.
Alert Sound Name - selezionare un file di avviso sonoro.
Altre impostazioni.
Label Number - selezione del colore.
Object id (Combo Levels) - prefisso al nome dell'oggetto.


As others have mentioned in the mt4 version, this is very well designed, and effective. No lag and switches easily among timeframes accurately. The author did a great job in also marking the murray lines which show up in three timeframes or more with a signal line. It is clear the author is very knowledgeable in both development and trading knowledge, Well done.