ADR Alert Dashboard
35 USD
Versione demo scaricata:
213
Pubblicato:
24 febbraio 2021
Versione attuale:
1.20
Non hai trovato un robot adatto?
Ordina il tuo
su Freelance
Vai alla sezione Freelance
Ordina il tuo
su Freelance
Come acquistare un Robot di Trading o un indicatore
Esegui il tuo EA
hosting virtuale
hosting virtuale
Prova un indicatore/robot di trading prima di acquistarlo
Vuoi guadagnare nel Market?
Come presentare un prodotto per venderlo con successo
Ti stai perdendo delle opportunità di trading:
- App di trading gratuite
- Oltre 8.000 segnali per il copy trading
- Notizie economiche per esplorare i mercati finanziari
Registrazione
Accedi
Accetti la politica del sito e le condizioni d’uso
Se non hai un account, registrati
Good afternoon Mr. Samson. The indicator has very good characteristics ... but it does not give me any signal. It is as if it is disconnected the numbers do not move at all. In short it's off Can you help me please?
Sounds to me like you dont have the pairs list set to EXACTLY what your broker has in the market watch window if there is no data moving. Or you dont have data loaded enough, if thats the case you need to switch to your daily timeframe on your charts to make sure data is loaded. Come into the Telegram group for help if you still need it. https://t.me/market_structure_trader_chat
It is working properly, fixed. Your "ADR REVERSAL INDICATOR" indicator is also working very well, I am satisfied. But I would appreciate it if you could explain what the first number and the second number of the "ADR ALERT DASHBOARD" mean, I do not understand it well. I cannot interpret whether it is at 20% or 90%. Thank you for your kindness and patience Mr. Samson
The second number is the ADR of the pair, the first number is where price currently is. for the 125% and above columns the second number is ADR*125% etc, i.e. what price needs to get to to trigger the alert.
Hi Lee,
I have just downloaded this product but when I try to put it on the charts, nothing happens.
Could you please guide me on why this is happening.
Thanks
Hi Lee,
I have just downloaded this product but when I try to put it on the charts, nothing happens.
Could you please guide me on why this is happening.
Thanks
Check the journal and see if there are any clues there. Make sure you are logged into your mql5 account in mt4 so the indicator can be validated.
a big scam you will lose all your money!!!!
You need to understand ADR is NOT a signal indicator it alerts to you a condition in the market which you then use confluence of signal indicators, directional bias and S&R levels to trade from.
good evening I bought an indicator. The numbers are just wrong. I live in Japan and I am attaching a photo of the dashboard at this time. What should I do.
good evening I bought an indicator. The numbers are just wrong. I live in Japan and I am attaching a photo of the dashboard at this time. What should I do.
Looks like your broker uses a prefix or suffix which you need to add to the dashboard. Check your pairs list and see what is before or after the symbols and add it to the relevant column.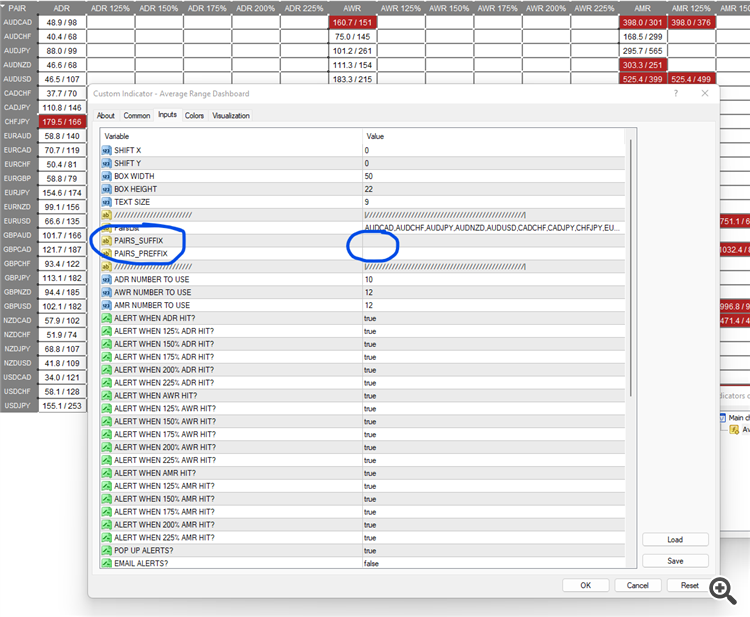
Looks like your broker uses a prefix or suffix which you need to add to the dashboard. Check your pairs list and see what is before or after the symbols and add it to the relevant column.
Do you want to enter like this? It freezes when I try
Do you want to enter like this? It freezes when I try
No, you just enter the suffix or prefix in there.
e.g. If USDJPY in your market watch is USDJPY.e8 then you would enter .e8 in the suffix.
If it was m.USDJPY you would enter m. in the prefix.
If it wanmUSDJPY you would enter m in the prefix etc...
No, you just enter the suffix or prefix in there.
e.g. If USDJPY in your market watch is USDJPY.e8 then you would enter .e8 in the suffix.
If it was m.USDJPY you would enter m. in the prefix.
If it wanmUSDJPY you would enter m in the prefix etc...
Thank you Is this correct? AWR of USDJPY is 420.6/419 AMR of 1115.9/629 As above, what does this mean?
Thank you Is this correct? AWR of USDJPY is 420.6/419 AMR of 1115.9/629 As above, what does this mean?
Yes they look right. Everything you need to know is in the description of the indicator. Those are weekly and monthly ranges.
Yes they look right. Everything you need to know is in the description of the indicator. Those are weekly and monthly ranges.
Thank you USD/JPY ADR is 156.9/254 What does this mean? Looking at the chart, the 100% figure seems to be 140 yen.
Thank you USD/JPY ADR is 156.9/254 What does this mean? Looking at the chart, the 100% figure seems to be 140 yen.
Watch the video to understand about ADR. I can't give lessons in a comments section on how to use ADR! Why I recorded the video :)
Come in the Telegram group, join the live room sessions every day if you need more assistance but all explained on the indicator page what the indicator does, how it works and the video gives more detail.
Telegram: https://t.me/market_structure_trader_chat Website: https://themarketstructuretrader.com/
Thank you. got it.
Hello The dashboard works fine. I've seen your webinars where you explain how you came up with calculating the mean. Is it possible to study the excel files you have built? There may be a further analysis. Suggestions to improve the dashboard: 1) The whole table should close 2) when you go to the signal it should allow you to go directly to the graph by indicating the value with an arrow. P.S. I also bought the ADR indicator. Thank you
Hello The dashboard works fine. I've seen your webinars where you explain how you came up with calculating the mean. Is it possible to study the excel files you have built? There may be a further analysis. Suggestions to improve the dashboard: 1) The whole table should close 2) when you go to the signal it should allow you to go directly to the graph by indicating the value with an arrow. P.S. I also bought the ADR indicator. Thank you
I dont have the spreadsheet I'm afraid, got lost in a hard drive failure. Easy to recreate though yourself by downloadin th edata from investing.com if you wanted to do further research. Will look at your improvements when I next do revisions on the products.