• Panoramica
  • Recensioni (8)
  • Commenti (14)
  • Novità

UPD1 Murrey Math Levels

5

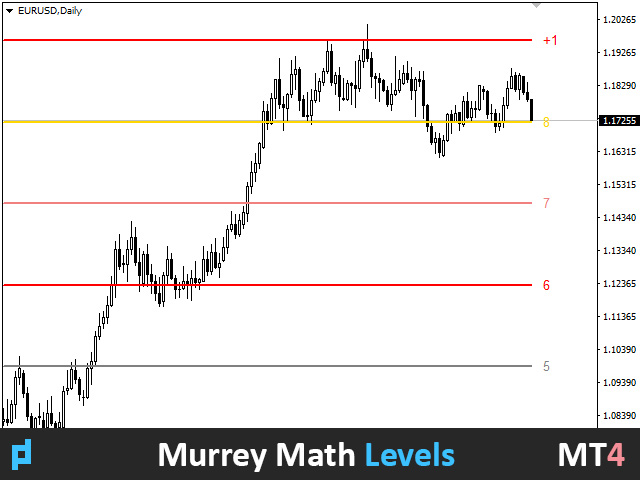
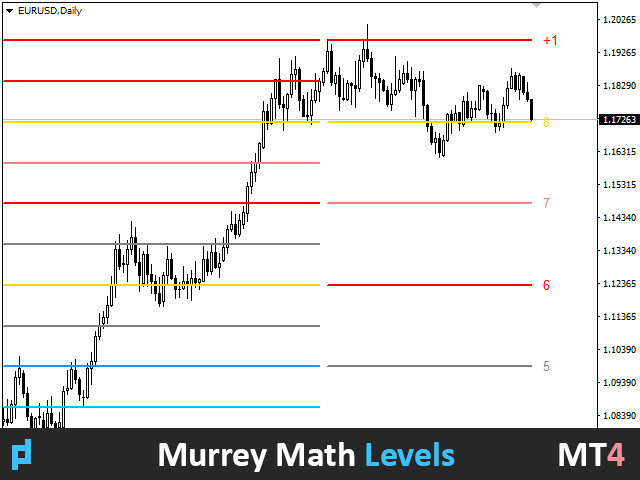
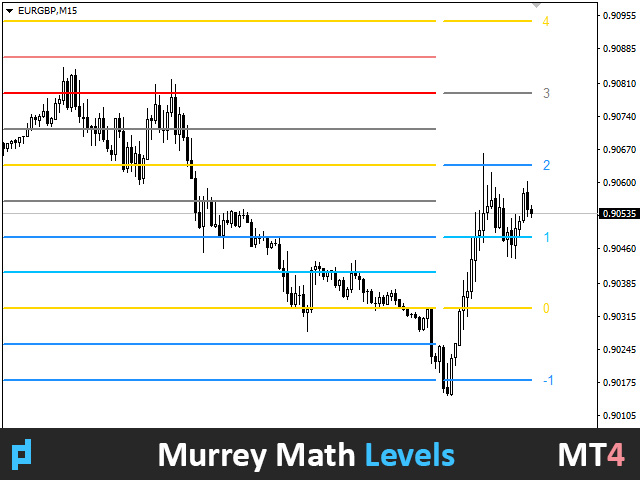
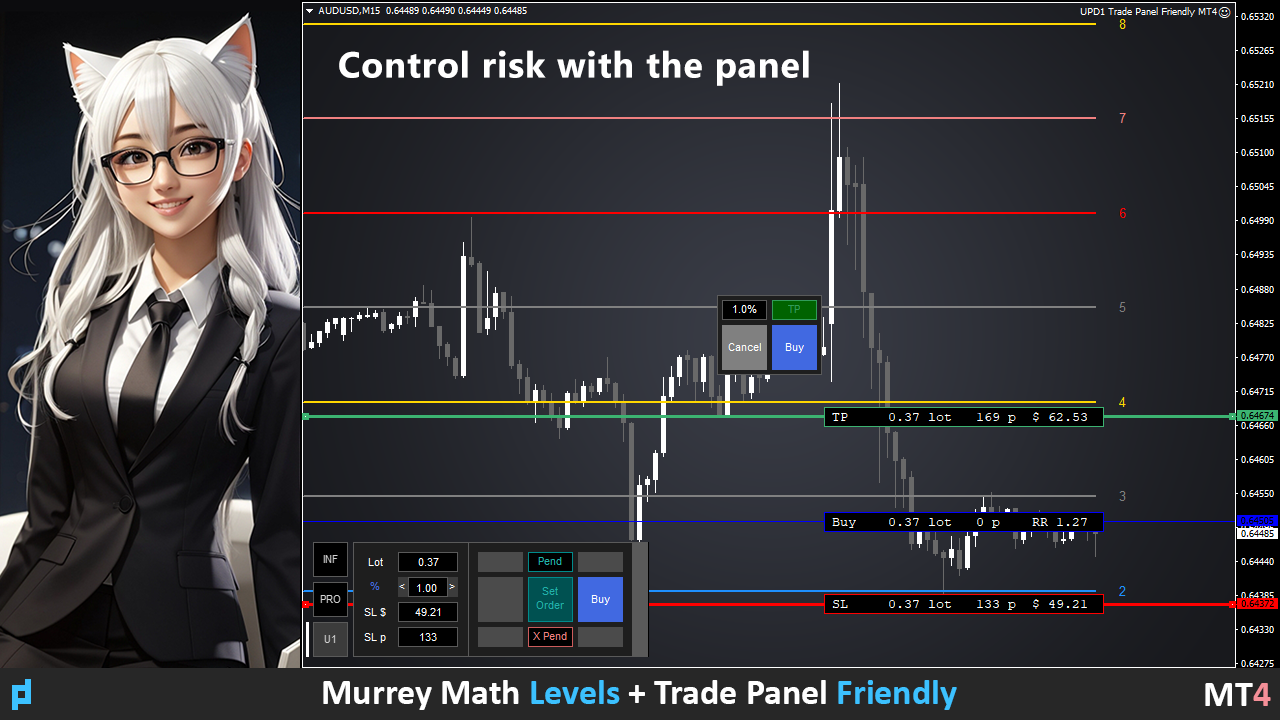
I livelli matematici di Murray si basano sulle osservazioni di Gann e sulla sua teoria della quadraticità dei prezzi. Secondo Gunn, il prezzo si muove in intervalli di 1/8.

Questi 1/8 ci permettono di ottenere diversi livelli di resistenza e supporto per un dato grafico, che hanno le loro caratteristiche.

Quando i livelli -2 o +2 vengono rotti o quando la volatilità diminuisce, vengono ricostruiti.

È possibile scegliere il periodo da visualizzare (corrente o tutta la storia). Tutte le linee sono tracciate attraverso i buffer.

Blog-Link - Murrey Math Trading with UPD1.


Parametri di ingresso.


Period - intervallo di calcolo.

History - storia (corrente / tutto).

Bars Count - lunghezza delle linee.


Visual Button - visualizzazione dei pulsanti (on/off).

Corner - angolo di vincolo del pulsante.

X indent - rientro orizzontale in pixel.

Y indent - rientro verticale in pixel.


Label Visual - visualizza l'etichetta del livello.

Label Font Size - dimensione del carattere.

Label Shift Bars - rientro dell'iscrizione.

Label Tooltip - visualizza l'iscrizione sotto il cursore sopra il livello.

Label Name - breve/pieno.


Levels Color - colore della linea.

Levels Width - spessore della linea.

Levels Style - lo stile delle linee.


Recensioni 8
jerrylew2020
294
jerrylew2020 2023.11.15 12:20 
 

Thank you very much.

paddock
305
paddock 2023.05.22 12:17 
 

Great Indicator. Love the toggle button so I can keep a clean chart. Thanks to the developer for his selflessness.

Lev Vladimirovic Marushkin
1636
Lev Vladimirovic Marushkin 2022.09.14 19:46 
 

Great! Love this indicator!

Prodotti consigliati
The indicator allows you to trade binary options. The recommended time frame is М1 and the expiration time is 1,2,3 minutes. The indicator suitable for auto and manual trading. A possible signal is specified as a arrows above/under a candle. You should wait until the candle closes! Arrows are not re-painted Trade sessions: TOKYO section (Half-end) Currency pairs: USD/JPY Working time frame: M1 Expiration time: 1,2,3 minutes. The indicator also shows good results when using the martingale strateg
FREE
Market Profile 3
Hussien Abdeltwab Hussien Ryad
4 (4)
Market Profile 3 MetaTrader 4 indicator  — is a classic Market Profile implementation that can show the price density over time, outlining the most important price levels, value area, and control value of a given trading session. This indicator can be attached to timeframes between M1 and D1 and will show the Market Profile for daily, weekly, monthly, or even intraday sessions. Lower timeframes offer higher precision. Higher timeframes are recommended for better visibility. It is also possible t
FREE
Email Drawdown Alert
Roman Starostin
5 (15)
Free informative Indicator-helper. It'll be usefull for traders who trade many symbols or using grid systems (Averaging or Martingale). Indicator counts drawdown as percent and currency separate. It has a number of settings: Count deposite drawdown according equity value and send e-mail or notifications to user if DD more than set; Sending e-mail when max open orders reached; Shows price and remaining pips amount before MarginCall on current chart and Account generally; Display summary trade lot
FREE
Donchian channels are a tool in technical analysis used to determine the relative volatility of a market and the potential for price breakouts. Can help identify potential breakouts and reversals in price, which are the moments when traders are called on to make strategic decisions. These strategies can help you capitalize on price trends while having pre-defined entry and exit points to secure gains or limit losses. Using the Donchian channel can thus be part of a disciplined approach to manag
FREE
Rainbow MT4
Jamal El Alama
Rainbow MT4 is a technical indicator based on Moving average with period 34 and very easy to use. When price crosses above MA and MA changes color to green, it’s a signal to buy. When price crosses below MA and MA changes color to red, it’s a signal to sell. The Expert advisor ( Rainbow EA MT4) based on Rainbow MT4 indicator, as you can see in the short video below is now available here .
FREE
Traditional MACD MT4
Daniel Lewis
4.6 (70)
MACD indicator in MetaTrader 4/5 looks different than MACD does in most other charting software. That is because the MetaTrader 4/5 version of MACD displays the MACD line as a histogram when it is traditionally displayed as a line. Additionally, the MetaTrader 4/5 version computes the Signal line using an SMA, while according to MACD definition it is supposed to be an EMA. The MetaTrader 4/5 version also does not compute a true MACD Histogram (the difference between the MACD/Signal lines). This
FREE
Necessary for traders: tools and indicators Waves automatically calculate indicators, channel trend trading Perfect trend-wave automatic calculation channel calculation , MT4 Perfect trend-wave automatic calculation channel calculation , MT5 Local Trading copying Easy And Fast Copy , MT4 Easy And Fast Copy , MT5 Local Trading copying For DEMO Easy And Fast Copy , MT4 DEMO Easy And Fast Copy , MT5 DEMO The homeopathic indicator is also called the CCI indicator. The CCI indicator was propos
FREE
ZigZag Fibo Retracement
Dang Khoa Nguyen
5 (1)
ZigZag Fibo Retracement Indicator Optimize Your Trading Strategy! Are you seeking to optimize your trading strategy in the financial markets? Explore the unique features of the ZigZag Fibo Retracement Indicator, a powerful tool designed to help you identify potential support and resistance levels based on the combination of ZigZag patterns and Fibonacci ratios. Integration of ZigZag Patterns and Fibonacci: The ZigZag Fibo Retracement Indicator combines the effectiveness of ZigZag patterns, helpi
FREE
Trender MT4
Alexandr Gladkiy
Индикатор Trender определяет смену тренда. Для того чтобы её не пропустить, настройте его на отправку уведомлений в ваш мобильный терминал (Push),  или в виде алерта ( Alert ), или по Email. Также индикатор предоставляет потенциальные точки входа и расчитывает и отображает уровни стоплосс и тейкпрофит. Преимущества: - Не перерисовывается - Может помочь в фильтрации сигналов в вашей стратегии - Работает на всех парах и таймфреймах - Прост в настройке  - Даёт уже готовые сигналы для открытия поз
FREE
Follow The Line
Oliver Gideon Amofa Appiah
4 (13)
FOLLOW THE LINE GET THE FULL VERSION HERE: https://www.mql5.com/en/market/product/36024 This indicator obeys the popular maxim that: "THE TREND IS YOUR FRIEND" It paints a GREEN line for BUY and also paints a RED line for SELL.  It gives alarms and alerts of all kinds. IT DOES NOT REPAINT and can be used for all currency pairs and timeframes. Yes, as easy and simple as that. Even a newbie can use it to make great and reliable trades. NB: For best results, get my other premium indicators for more
FREE
PZ Penta O MT4
PZ TRADING SLU
2.25 (4)
The Penta-O is a 6-point retracement harmonacci pattern which usually precedes big market movements. Penta-O patterns can expand and repaint quite a bit. To make things easier this indicator implements a twist: it waits for a donchian breakout in the right direction before signaling the trade. The end result is an otherwise repainting indicator with a very reliable trading signal. The donchian breakout period is entered as an input. [ Installation Guide | Update Guide | Troubleshooting | FAQ | A
FREE
Ho creato questo semplice indicatore mentre stavo imparando a conoscere TheStrat di Rob Smith e l'ho trovato così utile, ho pensato di condividerlo con te. Se lo trovi utile, guarda gli altri indicatori che ho pubblicato su MQL5. L'indicatore disegna semplicemente una singola linea sul grafico che mostra il livello di prezzo selezionato da un periodo di tempo più elevato. Usando le impostazioni hai il pieno controllo sull'intervallo di tempo visualizzato ma, per   impostazione predefinita, calco
FREE
OrderBlock TS Roman
Vladislav Vlastovskii
4 (7)
Индикатор строит блоки заказов (БЗ) по торговой системе (ТС) Романа. Поиск блоков осуществляется одновременно на двух таймфремах: текущем и старшем (определяемым в настройках). Для оптимизации и игнорирования устаревших блоков в настройках задается ограничение количества дней в пределах которых осуществляется поиск блоков. Блоки строятся по правилам ТС состоящем из трех шагов: какую свечу вынесли (что?); какой свечой вынесли (чем?); правило отрисовки (как?).
FREE
This trial scanner works with the other "Smart Market Structure Opportunity Scanner", and is basically an extension of that scanner with added features to find more accurate entry opportunities for day trading or refined swing trading.  The most important added features are:  1) The ADRs ( Average Daily Range ) for the last 5 days would have color and  +/- sign that shows the direction of each days ADR     move.  2) I added RSI values for each of the trading timeframes ( 1min, 5min, 15min, 30min
FREE
TrendPlus
Sivakumar Subbaiya
4.21 (14)
Trend Plus   Trendplus  Indicator   Time Frame: Suitable for any time frame.  Purpose: Trend Prediction. Blue and red candle indicate the buy and sell call respectively. Buy: When the blue candle is formed buy call is initiated. close the buy trades when the next red candle will formed.   Sell: When the Red candle is formed Sell call is initiated. close the Sell trades when the next blue candle will formed.   Happy trade!!
FREE
Wave Reversal Indicator - determines the direction of trend waves and price reversals. The indicator shows wave movements and trend directions. It gives recommendations where to follow the trader, helps to follow the trading strategy. It is an addition to an intraday or medium-term strategy. Almost all parameters are selected for each time frame and are changed automatically, the only parameter for manual adjustment is the wavelength. Works on various trading instruments and timeframes, rec
FREE
Kombajn Signal
Mariusz Piotr Rodacki
The indicator still has a few bugs but is ready for testing. This is my first indicator that determines entry and exit points. The entry point is based on breaking the peaks determined by a channel indicating highs and lows (invisible channels). TP1 is a probable target at which most positions can be closed. The channel determining the opening and closing of positions is based on different assumptions. The red stop loss line is determined based on lows and highs. The stop loss can be adjusted
FREE
Check my paid tools they work great and I share Ea's based on them for free please r ate The Dual Timeframe RSI (Relative Strength Index) indicator is a novel trading tool that allows traders to monitor RSI readings from two different timeframes on a single chart. This dual perspective enables traders to identify potential trend confirmations and divergences more effectively. For instance, a trader might use a 1-hour RSI alongside a daily RSI to ensure that short-term trades align with the bro
FREE
This pointer is supplied of a double smoothing in such way to succeed to be more reactive of a blunt Moving Average but without tracing the noises of bottom of the market. Its use will have to be exclusively turned to the search and to the identification of the trend in action (even if graphically it could seem an indicator that indicates an inversion of the prices) because   the first useful signal is had to the opening of the successive bar to that one that has made to invert the sense of the
FREE
Extremum Reverse Bar
Yurij Izyumov
3.55 (11)
This indicator has been created for finding the probable reversal points of the symbol price. A small candlestick reversal pattern is used it its operation in conjunction with a filter of extremums. The indicator is not redrawn! If the extremum filter is disabled, the indicator shows all points that have a pattern. If the extremum filter is enabled, the condition works – if the history Previous bars 1 candles back contains higher candles and they are farther than the Previous bars 2 candle, such
FREE
StatsBar
Maksim Kalachev
StatBar 1.6 Indicator showing balance, earnings for today, yesterday and the day before yesterday. The indicator also shows: - Server; - GMT; - Server time; - Shoulder; - Spread. Description of variables: extern int Magic = "-1"; // Magic for statistics -1 = all 0 = manual extern string Symboll = "-1"; // Symbol for statistics -1 = all 0 = current EURUSD = for EURUSD
FREE
WPR Signal AM
Andriy Matviyevs'kyy
This indicator displays the signals based on the values of the classic WPR indicator. The WPR indicator can be used for determining the overbought or oversold areas on the chart. Reaching these levels means that the market can soon turn around, but it does not give signal, as in a strong trend the market can stay in the overbought or oversold state for quite a long time. As with most oscillators, the signals are generated when leaving these areas. This indicator allows to display three types of
FREE
RSX Signal 2 AM
Andriy Matviyevs'kyy
The indicator displays the signals of the RSX oscillator on the price chart. (To display these signals in a separate window, along with the oscillator, another indicator is used -  RSX Osc 4 AM ). It is optimal to use the indicator signals as signals to open a trade when the price overcomes the maximum or minimum of the bar at which the signal was given. An opposite signal cancels the previous signal. Settings: Data period for indicator calculation - data period for indicator calculation; Data
FREE
Triple RSI
Pablo Leonardo Spata
2.5 (2)
LOOK AT THE FOLLOWING STRATEGY WITH THIS INDICATOR. Triple RSI is a tool that uses the classic Relative Strength Indicator, but in several timeframes to find market reversals.    1.  ️ Idea behind the indicator and its strategy: In Trading, be it Forex or any other asset, the ideal is to keep it simple, the simpler the better . The triple RSI strategy is one of the simple strategies that seek market returns. In our experience, where there is more money to always be won, is in the marke
FREE
Discover the power of precision and efficiency in your trading with the " Super Auto Fibonacci " MT4 indicator. This cutting-edge tool is meticulously designed to enhance your technical analysis, providing you with invaluable insights to make informed trading decisions. Key Features: Automated Fibonacci Analysis: Say goodbye to the hassle of manual Fibonacci retracement and extension drawing. "Super Auto Fibonacci" instantly identifies and plots Fibonacci levels on your MT4 chart, saving you tim
FREE
RSI Candle Signal
Jonathan Destailleur
4.67 (3)
RSI Candle Signal Indicator will change bars’ color when set overbought or oversold levels reach. How to Use RSI Candle Signal Uptrend/Downtrends  - RSI may be used to detect trending markets. For example, the RSI may stay above the mid line 50 in an uptrend. Top and Buttoms  - RSI may help in identifying the tops around the overbought readings (usually above 70), and the bottoms around the oversold area (usually below 30). Divergence  - divergence occurs when RSI directional movement is not c
FREE
The indicator uses the Chester W. Keltner's channel calculation method, modified by the well-known trader Linda Raschke. Due to the modification, the calculated channel contains a much more complete overview of the price movements, which allows increasing the probability of an accurate prediction of the upcoming price movement. Unlike the classic Keltner method, the base line of the channel is plotted based on the Exponential Moving Average, and the Average True Range is used to calculate the up
FREE
MASi Three Screens
Aleksey Terentev
5 (2)
MASi Three Screens is based on the trading strategy by Dr. Alexander Elder. This indicator is a collection of algorithms. Algorithms are based on the analysis of charts of several timeframes. You can apply any of the provided algorithms. List of versions of algorithms:     ThreeScreens v1.0 - A simple implementation, with analysis of the MACD line;     ThreeScreens v1.1 - A simple implementation, with analysis of the MACD histogram;     ThreeScreens v1.2 - Combines the first two algorithms
FREE
OsMA Arrow
Pavel Shutovskiy
4.36 (11)
The indicator displays crossing zero level by Moving Average of Oscillator (OsMA) in the form of arrows. The indicator notifies about a signal by means of a pop-up Alert window, or sending notification to e-mail. Parameters Fast EMA Period - fast EMA. This is an exponential moving average from a price with a short period. Slow EMA Period - slow EMA. This is also an exponential moving average of a market price but with a longer period. Signal SMA Period - MACD SMA. This is a signal line which i
FREE
Shooter AM
Andriy Matviyevs'kyy
This indicator is an implementation of the "One shot - one hit" principle. In the course of work on the creation of this product, an attempt was made to achieve the maximum balance between the sensitivity of the indicator and the effectiveness of its signals. This tool is as reliable and effective as a 45 caliber revolver, but in the same way it requires discipline and understanding of the conditions and purpose of use from its user. The indicator has only one adjustable parameter that determine
FREE
Gli utenti di questo prodotto hanno anche acquistato
Gann Made Easy
Oleg Rodin
4.92 (62)
Gann Made Easy è un sistema di trading Forex professionale e facile da usare che si basa sui migliori principi del trading utilizzando la teoria di mr. WD Gann. L'indicatore fornisce segnali ACQUISTA e VENDI accurati, inclusi i livelli di Stop Loss e Take Profit. Puoi fare trading anche in movimento utilizzando le notifiche PUSH. Vi prego di contattarmi dopo l'acquisto! Condividerò i miei consigli di trading con te e fantastici indicatori bonus gratuitamente! Probabilmente hai già sentito parlar
ATTUALMENTE SCONTATO DEL 26% La soluzione migliore per ogni principiante o trader esperto! Questo indicatore è uno strumento di trading unico, di alta qualità e conveniente perché abbiamo incorporato una serie di caratteristiche proprietarie e una nuova formula. Con un solo grafico è possibile leggere la forza delle valute per 28 coppie Forex! Immaginate come migliorerà il vostro trading perché sarete in grado di individuare l'esatto punto di innesco di una nuova tendenza o di un'opportunit
Atomic Analyst
Issam Kassas
5 (3)
Innanzitutto, vale la pena sottolineare che questo indicatore di trading non è repaint, non è ridisegno e non presenta ritardi, il che lo rende ideale sia per il trading manuale che per quello automatico. Manuale utente: impostazioni, input e strategia. L'Analista Atomico è un indicatore di azione del prezzo PA che utilizza la forza e il momentum del prezzo per trovare un miglior vantaggio sul mercato. Dotato di filtri avanzati che aiutano a rimuovere rumori e segnali falsi, e aumentare il pote
Gold Stuff
Vasiliy Strukov
4.89 (254)
Gold Stuff è un indicatore di tendenza progettato specificamente per l'oro e può essere utilizzato anche su qualsiasi strumento finanziario. L'indicatore non ridisegna e non è in ritardo. Periodo consigliato H1. Su di esso l'indicatore funziona in modo completamente automatico Expert Advisor EA Gold Stuff. Lo trovi nel mio profilo. Contattami subito dopo l'acquisto per avere le impostazioni e un bonus personale!   IMPOSTAZIONI Disegna freccia - acceso spento. disegnando frecce sul grafi
TPSproTREND PrO
Roman Podpora
5 (15)
TPSpro TRENDPRO  - is a trend indicator that automatically analyzes the market and provides information about the trend and each of its changes, as well as giving signals for entering trades without redrawing! The indicator uses each candle, analyzing them separately. referring to different impulses - up or down impulse. Exact entry points into transactions for currencies, crypto, metals, stocks, indices!  -  Version MT5               DETAILED DESCRIPTION        /       TRADING SETUPS           
Advanced Supply Demand
Bernhard Schweigert
4.92 (310)
CURRENTLY 26% OFF !! Best Solution for any Newbie or Expert Trader! This indicator is a unique, high quality and affordable trading tool because we have incorporated a number of proprietary features and a new formula. With this update, you will be able to show double timeframe zones. You will not only be able to show a higher TF but to show both, the chart TF, PLUS the higher TF: SHOWING NESTED ZONES. All Supply Demand traders will love it. :) Important Information Revealed Maximize the potenti
TPSpro RFI Levels
Roman Podpora
5 (13)
A key element in trading is zones or levels from which decisions to buy or sell a trading instrument are made. Despite attempts by major players to conceal their presence in the market, they inevitably leave traces. Our task was to learn how to identify these traces and interpret them correctly. Reversal First Impulse levels (RFI)   -  Version MT5                INSTRUCTIONS                 RUS                 ENG                                       R ecommended to use with an indicator   -  
ON Trade Optuma Astro
Abdullah Alrai
5 (4)
Presentazione dell'Indicatore Astronomico per MT4: Il tuo compagno di trading celeste definitivo Sei pronto a elevare la tua esperienza di trading a livelli celesti? Non cercare oltre, il nostro rivoluzionario Indicatore Astronomico per MT4 è qui. Questo strumento innovativo va oltre gli indicatori di trading tradizionali, sfruttando algoritmi complessi per offrirti intuizioni astronomiche senza pari e calcoli di precisione. Un universo di informazioni a portata di mano: Ammira un pannello compl
Scopri il segreto per il trading Forex di successo con il nostro indicatore MT4 personalizzato! Ti sei mai chiesto come raggiungere il successo nel mercato Forex, guadagnando costantemente profitti minimizzando il rischio? Ecco la risposta che hai cercato! Permettici di presentare il nostro indicatore MT4 proprietario che rivoluzionerà il tuo approccio al trading. Versatilità unica Il nostro indicatore è appositamente progettato per gli utenti che preferiscono le formazioni di candele Ren
Presentazione       Quantum Trend Sniper Indicator   , l'innovativo indicatore MQL5 che sta trasformando il modo in cui identifichi e scambi le inversioni di tendenza! Sviluppato da un team di trader esperti con un'esperienza di trading di oltre 13 anni,       Indicatore Quantum Trend Sniper       è progettato per spingere il tuo viaggio di trading verso nuove vette con il suo modo innovativo di identificare le inversioni di tendenza con una precisione estremamente elevata. *** Acquista Quant
Break and Retest
Mohamed Hassan
4.56 (9)
‍You can visually backtest Break & Retest to see how it behaved in the past!     Manual guide:   Click here $65  for only 1  copy left! Next price is $120 .  This Indicator only places quality trades when the market is really in your favor with a clear break and retest. Patience is key with this price action strategy! Recommended timeframes: M1 for Scalpers.  M15 for Intraday traders. H1 & H4 for Day traders. Other timeframes are also excellent! After many months of hard w
Vi presentiamo ON Trade Waves Patterns Harmonic Elliot Wolfe, un indicatore avanzato progettato per rilevare vari tipi di pattern sul mercato utilizzando metodi sia manuali che automatici. Ecco come funziona: Pattern Armonici: Questo indicatore è in grado di individuare pattern armonici che appaiono sul vostro grafico. Questi pattern sono fondamentali per i trader che praticano la teoria del trading armonico, come descritta nel libro di Scott Carney "Harmonic Trading vol 1 & 2". Che li disegniat
Trend Screener
STE S.S.COMPANY
4.83 (88)
Indicatore di tendenza, soluzione unica rivoluzionaria per il trading di tendenze e il filtraggio con tutte le importanti funzionalità di tendenza integrate in un unico strumento! È un indicatore multi-timeframe e multi-valuta al 100% non ridipingibile che può essere utilizzato su tutti i simboli/strumenti: forex, materie prime, criptovalute, indici e azioni. Trend Screener è un indicatore di tendenza che segue un indicatore efficiente che fornisce segnali di tendenza a freccia con punti nel gra
74% discount for the next 10 buyers (original price $605): 2 left 3 Indicators in 1 indicator Strategy based on price action Made specifically for the best forex currency pairs Can be used in the best time frame of the market at a very reasonable price This indicator is basically 3 different indicatos . But we have combined these 3 indicators in 1 indicator so that you can use 3 indicators at the lowest price. All three strategies are based on price action. But based on different trends.
Currency Strength Wizard è un indicatore molto potente che ti fornisce una soluzione all-in-one per un trading di successo. L'indicatore calcola la potenza di questa o quella coppia forex utilizzando i dati di tutte le valute su più intervalli di tempo. Questi dati sono rappresentati in una forma di indice di valuta facile da usare e linee elettriche di valuta che puoi utilizzare per vedere il potere di questa o quella valuta. Tutto ciò di cui hai bisogno è collegare l'indicatore al grafico che
on free demo press zoom out button to see back.. cnt number is bar numbers.you can change up to 3000 related to chart bars numbers. minimum value is 500. there is g value set to 1.01. no need to change it. this indicator almost grail,no repaint and all pairs ,all timeframe indicator. there is red and blue histograms. if gold x sign comes on red histogram that is sell signal. if blue x sign comes on blue histogram that is buy signal. this indicator on thise version works all pairs.al timeframes
FX Power MT4 NG
Daniel Stein
5 (9)
Ricevi il tuo aggiornamento quotidiano sul mercato con dettagli e schermate tramite il nostro Morning Briefing qui su mql5 e su Telegram ! FX Power MT4 NG è la nuova generazione del nostro popolare misuratore di forza delle valute, FX Power. Cosa offre questo misuratore di forza di nuova generazione? Tutto ciò che avete amato dell'FX Power originale IN PIÙ Analisi della forza di ORO/XAU Risultati di calcolo ancora più precisi Periodi di analisi configurabili individualmente Limite di calcolo pe
Innanzitutto, vale la pena sottolineare che questo Strumento di Trading è un Indicatore Non-Ridipingente, Non-Ridisegnante e Non-Laggante, il che lo rende ideale per il trading professionale. Corso online, manuale utente e demo. L'Indicatore Smart Price Action Concepts è uno strumento molto potente sia per i nuovi che per i trader esperti. Racchiude più di 20 utili indicatori in uno solo, combinando idee di trading avanzate come l'Analisi del Trader del Circolo Interno e le Strategie di Trading
Scalper Vault
Oleg Rodin
5 (28)
Scalper Vault è un sistema di scalping professionale che ti fornisce tutto il necessario per scalping di successo. Questo indicatore è un sistema di trading completo che può essere utilizzato dai trader di forex e opzioni binarie. L'intervallo di tempo consigliato è M5. Il sistema fornisce segnali di freccia accurati nella direzione della tendenza. Ti fornisce anche i segnali più alti e più bassi e i livelli di mercato di Gann. Gli indicatori forniscono tutti i tipi di avvisi, comprese le notifi
Advanced Currency IMPULSE with ALERT
Bernhard Schweigert
4.91 (494)
ATTUALMENTE SCONTATO DEL 31%! La soluzione migliore per ogni principiante o trader esperto! Questo indicatore è uno strumento di trading unico, di alta qualità e conveniente perché abbiamo incorporato una serie di caratteristiche proprietarie e una formula segreta. Con un solo grafico fornisce avvisi per tutte le 28 coppie di valute. Immaginate come migliorerà il vostro trading perché sarete in grado di individuare l'esatto punto di innesco di una nuova tendenza o opportunità di scalping!
Shepherd Harmonic Pattern
Abdullah Alrai
4.68 (59)
Questo indicatore rileverà modelli armonici disegnati sul grafico mediante metodi manuali e automatici. Puoi consultare il manuale dell'utente tramite questo link: Aggiungi la tua recensione e contattaci per ottenerlo. C'è una versione gratuita per provare questo prodotto su MT4. Puoi usarlo per rilevare i modelli di Gartley e Nenstar: https://www.mql5.com/en/market/product/30181 Puoi acquistare la versione completa di MT4 da: https://www.mql5.com/en/market/product/15212 Note L'indicatore ha un
Market Reversal Alerts
LEE SAMSON
4.21 (121)
Il profitto dalla struttura del mercato cambia quando il prezzo si inverte e si ritira. L'indicatore di avviso di inversione della struttura del mercato identifica quando una tendenza o un movimento di prezzo si sta avvicinando all'esaurimento e pronto a invertire. Ti avvisa dei cambiamenti nella struttura del mercato che in genere si verificano quando stanno per verificarsi un'inversione o un forte pullback. L'indicatore identifica inizialmente i breakout e lo slancio del prezzo, ogni volta
PRO Renko System
Oleg Rodin
5 (25)
PRO Renko System è un sistema di trading altamente accurato appositamente progettato per il trading di grafici RENKO. Questo è un sistema universale che può essere applicato a vari strumenti di trading. Il sistema neutralizza efficacemente il cosiddetto rumore di mercato che consente di accedere a segnali di inversione accurati. L'indicatore è molto facile da usare e ha un solo parametro responsabile della generazione del segnale. Puoi facilmente adattare lo strumento a qualsiasi strumento
Attualmente 20% di sconto! La soluzione migliore per ogni principiante o trader esperto! Questo software per cruscotti funziona su 28 coppie di valute. Si basa su 2 dei nostri indicatori principali (Advanced Currency Strength 28 e Advanced Currency Impulse). Offre un'ottima panoramica dell'intero mercato Forex. Mostra i valori di forza delle valute avanzate, la velocità di movimento delle valute e i segnali per 28 coppie Forex in tutti i (9) timeframe. Immaginate come migliorerà il vostro t
Symbols must be separated by commas (,) and entered into the parameters exactly as displayed by your broker to ensure they are recognized in the dashboard. These symbols will be used for analysis by the indicator. With one click open any pair any timeframe directly from dashboard The MA Speedometer Dashboard is a highly functional MetaTrader 4 (MT4) indicator designed to enhance trading strategies through dynamic market analysis. It offers robust features for identifying market trends, trading
TrendMaestro
Stefano Frisetti
5 (2)
nota: questo indicatore e' per METATRADER4, se vuoi la versione per  METATRADER5 questo e' il link:  https://www.mql5.com/it/market/product/108123 TRENDMAESTRO ver 2.4 TRENDMAESTRO riconosce un nuovo TREND sul nascere, non sbaglia mai. La sicurezza di identificare un nuovo TREND non ha prezzo. DESCRIZIONE TRENDMAESTRO identifica un nuovo TREND sul nascere, questo indicatore prende in esame la volatilita' i volumi ed il momentum per identificare il momento in cui c'e' un'esplosione di uno 
Entry Points Pro
Yury Orlov
4.7 (225)
Indicatore top per MT5 che fornisce segnali accurati per entrare in un trade senza riverniciare! Può essere applicato a qualsiasi attività finanziaria: forex, criptovalute, metalli, azioni, indici.  La versione MT5 è qui Fornirà segnali di trading piuttosto precisi e ti dirà quando è meglio aprire un trade e chiuderlo. Guarda il video (6:22) con un esempio di elaborazione di un solo segnale che ha ripagato l'indicatore! La maggior parte dei trader migliora i propri risultati di trading
IX Power MT4
Daniel Stein
5 (5)
IX Power porta finalmente l'imbattibile precisione di FX Power ai simboli non-Forex. Determina con precisione l'intensità delle tendenze a breve, medio e lungo termine dei vostri indici preferiti, azioni, materie prime, ETF e persino criptovalute. Potete analizzare tutto ciò che il vostro terminale ha da offrire. Provatelo e sperimentate come il vostro tempismo migliori significativamente durante il trading. Caratteristiche principali di IX Power Risultati di calcolo precisi al 100% e n
The 1 2 3 Pattern Scanner
Reza Aghajanpour
4.79 (56)
** All Symbols x All Timeframes scan just by pressing scanner button ** After 17 years of experience in the markets and 3 years of programming, Winner indicator is ready. I would like to share with you! *** Contact me after purchase to send you instructions and add you in "123 scanner group" for sharing or seeing experiences with other users. Introduction The 123 Pattern Scanner indicator with a special enhanced algorithm is a very repetitive common pattern finder with a high success rate . Inte
Trend Forecasting
Mohamed Hassan
5 (20)
This indicator is unstoppable when combined with our other indicator called Katana. After purchase, send us a message and you could get Katana for FREE as a BONUS After purchase, send us a private message for your instructions.  MT5 version: click here 3 copies left available at $45. Next price is $95. Don't miss this great deal!  The Trend Forecasting indicator is a very unique & easy tool that is able to make prediction about future price movement based on the signals generated
Altri dall’autore
Lo scopo di questo indicatore è trovare i livelli di Murray su tutti i timeframe e combinarli in livelli combo che includono livelli di segnale basati su forti livelli di Murray (+2, +1, 8, 4, 0, -1, -2). Più piccolo è il timeframe, maggiori sono le possibilità di vedere immediatamente il livello combo. Sarà evidenziato in colore. Se si posiziona il cursore su un numero qualsiasi, apparirà un tooltip che indicherà a quale timeframe appartiene il livello. Tuttavia, il timeframe corrente sarà semp
UPD1 Volume BOX
Vitaliy Kuznetsov
5 (14)
L'indicatore mostra il profilo del volume orizzontale nell'area specificata (BOX) e il volume massimo (POC). Caratteristiche del prodotto. 1. Puoi usare i tick o solo il prezzo. 2. Spaziatura della griglia adattiva (M1-MN). 3. Fase di ricerca adattiva ad alto volume (mediana) a seconda delle dimensioni della casella. 4. Colore camaleonte automatico per linee di scatole e pulsanti. 5. Caselle multiple, facili da creare ed eliminare. 6. Area del volume del 70% (abilitata nelle impostazioni). 7. 
Pannello di trading con ordini preimpostati e calcolo automatico del lotto per il terminale MT4. Attenzione, il Trading Panel non funziona nel tester della strategia (solo il test del trailing stop). Manuale, Descrizione, Download Light Demo. I trader di successo si distinguono per l'autodisciplina e la gestione competente. Se usi un lotto fisso, allora sei a rischio. Dopotutto, in diversi intervalli di tempo, una distanza diversa e una transazione in perdita possono bloccare diversi profitti. S
UPD1 Volume Cluster
Vitaliy Kuznetsov
4.8 (15)
L'algoritmo trova le zone di volatilità ridotta in base all'indicatore UPD1 Trend Direction e traccia il volume orizzontale massimo in base all'indicatore UPD1 Volume Box . Di norma, un forte movimento di tendenza si verifica quando si esce dall'accumulo. Se il prezzo ha lasciato l'accumulo, può testare il suo volume orizzontale massimo (POC). Smart Alert sono disponibili nelle impostazioni. Parametri di input. Impostazioni di base. Bars Count – numero di barre della cronologia su cui verrà
FREE
UPD1 Profile Levels
Vitaliy Kuznetsov
5 (6)
L'indicatore trova i livelli del volume di prezzo massimo e minimo (profilo di mercato) nell'istogramma di lavoro per il numero specificato di barre.   Profilo composito. L'altezza dell'istogramma è completamente automatica e si adatta a qualsiasi strumento e periodo di tempo. Viene utilizzato l'algoritmo dell'autore e non ripete analoghi noti. L'altezza dei due istogrammi è approssimativamente uguale all'altezza media della candela. Smart alert (smart alert) ti aiuta a comunicare il prezzo rel
UPD1 Impulse Level
Vitaliy Kuznetsov
5 (8)
L'indicatore trova le onde impulsive sul grafico. Analizza la rottura del canale frattale e costruisce i livelli di impulso.  Inoltre, Trova i luoghi presunti Di false rotture e sequestro di liquidità. Nelle impostazioni, è possibile abilitare il dashboard multivaluta e selezionare qualsiasi strumento e intervallo di tempo. Avviso scegli tra il programma corrente o l'intero elenco. Ci sono segnali separati di impulso e falsa rottura. Blog-Link -  Retest and Fake Breakout with UPD1 . Modelli
UPD1 Trend Direction
Vitaliy Kuznetsov
4.78 (9)
Questo indicatore viene utilizzato per visualizzare le posizioni piatte e di tendenza. Il design si basa su un oscillatore. Viene utilizzato come filtro aggiuntivo, sia per il trading su un grafico normale che per le opzioni binarie. Le posizioni piatte vengono utilizzate nell'indicatore UPD1 volume Cluster per il trading secondo il concetto di Smart Money. Un avviso incorporato segnala i luoghi più ipercomprati / ipervenduti. Parametri di input. Impostazioni di base. Bars Count - specifica
FREE
L'indicatore costruisce un semaforo a tre periodi e un pattern di inversione 123 dall'estremo. Il segnale arriva all'apertura della seconda candela. Questo pattern può essere negoziato in diversi modi (test point 3, breakout e altri). L'uscita dal canale o il breakout della trendline è il principale fattore scatenante per trovare un punto di ingresso. Le icone sono colorate in base ai livelli di Fibonacci. Le icone gialle indicano il test di un livello al quale il segnale è amplificato. Utilizz
UPD1 Volume Pixel
Vitaliy Kuznetsov
5 (3)
L'indicatore Trova il volume basso, alto, estremo in base ai coefficienti specificati e li colora nei colori specificati. Sostituisce la funzione di disegno del volume standard nel terminale metatrader. Le candele possono anche essere dipinte nel colore del volume. Sulle candele con volume estremo, viene determinato il volume orizzontale massimo (cluster/POC). A seconda della sua posizione (spinta, neutro, arresto), il cluster ha anche il suo colore. Se il cluster è in ombra e la candela ha un
UPD1 Volume Footer
Vitaliy Kuznetsov
5 (8)
L'indicatore mostra il volume verticale. Nelle impostazioni ci sono 2 fattori per determinare l'alto e l'estremo e 1 per determinare il basso volume. Un algoritmo simile viene utilizzato anche nell'indicatore UPD1 Volume Pixel . Quando viene rilevato un volume specificato, l'istogramma viene colorato nel colore corrispondente. La larghezza dell'istogramma viene selezionata automaticamente, a seconda della scala. Di norma, il prezzo reagisce al volume massimo e minimo. Ma è necessario utilizzare
FREE
UPD1 Volume TimeFrame POC
Vitaliy Kuznetsov
5 (3)
L'indicatore visualizza il volume orizzontale massimo nel periodo di tempo selezionato. Basato sull'indicatore UPD1 Volume Box . Le linee possono essere collegate o separate. Nelle impostazioni, è possibile abilitare l'avviso Smart Touch. Tale indicatore sarà utile per coloro che commerciano utilizzando il profilo di mercato e il concetto di Smart Money. Parametri di input. Impostazioni di base. Bars Count - specifica il numero di barre su cui verrà disegnato TF POC. Data Source - periodo d
FREE
UPD1 Watermark MT4
Vitaliy Kuznetsov
5 (1)
L'indicatore visualizza qualsiasi testo e qualsiasi immagine sul grafico e può anche visualizzare le informazioni richieste dalle macro. Sono disponibili tre blocchi di testo e un blocco per le immagini. Sono disponibili la selezione dei caratteri, la dimensione, il colore, l'indentazione e il posizionamento. Se si desidera marcare le schermate o visualizzare le informazioni richieste su un grafico, UPD1 Watermark sarà uno strumento molto utile. Descrizione delle impostazioni. Impostazioni
FREE
UPD1 Rsi Dots Dashboard
Vitaliy Kuznetsov
5 (1)
L'indicatore mostra segnali basati sull'oscillatore RSI terminale sul grafico. È possibile filtrare i segnali ripetuti. Qui l'oscillatore viene utilizzato per cercare un segnale inverso. È raccomandato come punto di ingresso nelle strategie swing e nel trading dai livelli. È disponibile una dashboard multi-valuta. Con esso, puoi facilmente passare da un grafico all'altro. Nelle discussioni sui prodotti, è possibile suggerire un algoritmo in cui è possibile incorporare un dashboard. Parame
FREE
UPD1 X00 Levels
Vitaliy Kuznetsov
4.92 (12)
L'indicatore mostra livelli circolari sul grafico. Sono anche chiamati livelli psicologici, bancari o dei principali operatori. A questi livelli si verifica una vera e propria lotta tra tori e orsi, l'accumulo di molti ordini, che porta a un aumento della volatilità. L'indicatore si adatta automaticamente a qualsiasi strumento e timeframe. Se il livello 80 viene rotto e poi testato, acquistare. Se il livello 20 viene rotto e poi testato, vendere. L'obiettivo è 00. Attenzione. A causa dei forti
FREE
UPD1 Impulse Channel
Vitaliy Kuznetsov
5 (8)
Un canale non disegnato per il trading di tendenza. È costruito dall'ATR e ha un limite di volatilità opposto. L'indicatore si è dimostrato valido nella strategia sui livelli di impulso e sui falsi breakout. Il punto di ingresso va cercato sulla correzione della linea dell'indicatore e il take profit va fissato sul confine opposto. Blog-Link -   Retest and Fake Breakout with UPD1 . Parametri di ingresso. Bars Count   - cronologia da visualizzare. ATR   - periodo di calcolo. Coefficient   -
FREE
UPD1 X00 Levels MT5
Vitaliy Kuznetsov
5 (1)
L'indicatore mostra livelli circolari sul grafico. Sono anche chiamati livelli psicologici, bancari o dei principali operatori. A questi livelli si verifica una vera e propria lotta tra tori e orsi, l'accumulo di molti ordini, che porta a un aumento della volatilità. L'indicatore si adatta automaticamente a qualsiasi strumento e timeframe. Se il livello 80 viene rotto e poi testato, acquistare. Se il livello 20 viene rotto e poi testato, vendere. L'obiettivo è 00. Attenzione. A causa dei forti
FREE
UPD1 Profile Levels MT5
Vitaliy Kuznetsov
5 (3)
L'indicatore trova i livelli del volume di prezzo massimo e minimo (profilo di mercato) nell'istogramma di lavoro per il numero specificato di barre.   Profilo composito. L'altezza dell'istogramma è completamente automatica e si adatta a qualsiasi strumento e periodo di tempo. Viene utilizzato l'algoritmo dell'autore e non ripete analoghi noti. L'altezza dei due istogrammi è approssimativamente uguale all'altezza media della candela. Smart alert (smart alert) ti aiuta a comunicare il prezzo rela
L'Average True Range ( ATR ) è una misura della volatilità del mercato in un determinato numero di giorni. Non ci si deve aspettare un grande movimento di continuazione quando il prezzo ha raggiunto la fine del range. Si ritiene che il mercato abbia esaurito il carburante. Se il prezzo non ha raggiunto il limite, ha ancora un margine di movimento. La formula dell'indicatore consente di calcolare i livelli High-Low sia in aggregato che singolarmente. È inoltre possibile utilizzare questi livelli
FREE
UPD1 Fibo Levels
Vitaliy Kuznetsov
5 (3)
L'indicatore analizza il numero di candele specificato e costruisce i livelli di Fibonacci in base al massimo e al minimo. Poiché i livelli vengono ricostruiti, siamo interessati al lato destro dell'intervallo. Il prezzo è magnetico rispetto ai livelli e reagisce a un tocco. Utilizzate questo strumento per trovare un punto di ingresso nel trend dopo una correzione. Se a sinistra vediamo che i livelli sono perfettamente al rialzo, allora possiamo presumere di aver trovato la fine del movimento ne
FREE
UPD1 D Levels
Vitaliy Kuznetsov
5 (1)
L'indicatore dei livelli si basa sui dati del giorno precedente. La formula matematica determina i livelli di entrata e di uscita.  Raccomandazioni di trading. I livelli vengono negoziati all'inizio della sessione europea, quando appare la volatilità. In caso di volatilità insufficiente, utilizzare metà del take profit per uscire. Se il prezzo si è invertito a metà del take profit, allora sull'inversione cercate un target anche al livello di metà del take profit. Se il prezzo rimbalza dal liv
FREE
UPD1 Pivot Levels
Vitaliy Kuznetsov
5 (3)
L'indicatore mostra i classici livelli di pivot sul grafico, calcolati sulla base del giorno precedente. È possibile scegliere da quale ora calcolare la formula. Scambiate in un mercato piatto per l'inversione. In un mercato in trend, utilizzateli come target. Combinateli con le vostre strategie per un trading di successo. I livelli vengono costruiti utilizzando i buffer e visualizzati sull'intero storico delle quotazioni disponibili. Parametri di input. Start Hour - da quale ora considerar
FREE
UPD1 Pin Bar Dashboard
Vitaliy Kuznetsov
5 (2)
L'indicatore visualizza il modello di candela della barra Pin. Le impostazioni del rapporto consentono di regolare facilmente il rapporto tra ombra, corpo e dimensione. È possibile filtrare per tendenza (2 medie mobili) e per inversione (RSI e bande di Bollinger). Questo è il modello più popolare di Price Action. Disponibile cruscotto multivaluta. Con esso, puoi passare facilmente da un grafico all'altro. Modelli di trading: Retest per tendenza. Falsa ripartizione. Terzo. EURUSD, GBPUSD, XA
L'indicatore cerca le candele a impulso e le visualizza sul grafico. Include un filtro per le ombre. Trova anche i livelli di breakout delle Bande di Bollinger. È possibile attivare il cruscotto multivaluta nelle impostazioni. Per gli avvisi si può scegliere tra il grafico corrente o l'intero elenco. Blog-Link -  Retest and Fake Breakout with UPD1 Modelli di trading: Trend retest. Falso breakout. Altri. EURUSD, GBPUSD, XAUUSD, ... M15, M30, H1. Parametri di ingresso. Di base. Bars Count
L'indicatore costruisce un semaforo a tre periodi e un pattern di inversione 123 dall'estremo. Il segnale arriva all'apertura della seconda candela. Questo pattern può essere negoziato in diversi modi (test point 3, breakout e altri). L'uscita dal canale o il breakout della trendline è il principale fattore scatenante per trovare un punto di ingresso. Le icone sono colorate in base ai livelli di Fibonacci. Le icone gialle indicano il test di un livello al quale il segnale è amplificato. Utilizz
L'indicatore Cerca e visualizza automaticamente grandi ombre sul grafico in base alla volatilità. Le ombre sono ulteriormente filtrate dalla dimensione dell'onda. L'algoritmo analizza la rottura del frattale con un'ombra nell'intervallo specificato e visualizza il livello. Nelle impostazioni, è possibile abilitare il dashboard multi-valuta. L'avviso viene scelto tra il grafico corrente o l'intero foglio del dashboard. Segnali a grandi ombre e quelli che hanno sfondato il livello frattale posson
L'indicatore visualizza il modello "Rails" sul grafico. Questo schema consiste in due candele multidirezionali con corpi identici e piccole ombre. Se sul timeframe corrente il pattern "Rails", sul timeframe x2 apparirà come una Pin Bar (Doji). Questo indicatore è stato creato per trovare automaticamente il pattern nel modo più efficiente, con impostazioni logicamente semplici che possono essere facilmente modificate. È possibile filtrare in base alla tendenza (2 medie mobili) e all'inversione (
Un indicatore che visualizza il pattern candela inghiottendo. Nelle impostazioni, è possibile specificare il tipo di engulfing (corpo, ombra e combinazione). È possibile filtrare per tendenza (2 medie mobili) e per inversione (RSI e Bande di Bollinger). Questo è un modello di azione dei prezzi molto popolare. È disponibile una dashboard multi-valuta. Con esso, puoi facilmente passare da un grafico all'altro. Modelli di trading: Ripetere il test per tendenza. Falso breakout. Blocco ordine. Alt
L'indicatore mostra un segnale sul grafico quando la seconda candela è all'interno della prima, cioè non ha superato i suoi limiti. Questo modello di candela è chiamato Inner Bar. Questo schema non è così popolare come la Pin Bar o il Engulfing, ma viene talvolta utilizzato da alcuni trader. Esiste la possibilità di filtrare per tendenza (2 medie mobili) e per inversione (RSI e Bande di Bollinger). È disponibile un pannello multivaluta. Con il suo aiuto è possibile passare facilmente da un graf
Filtro:
jerrylew2020
294
jerrylew2020 2023.11.15 12:20 
 

Thank you very much.

Vitaliy Kuznetsov
30344
Risposta dello sviluppatore Vitaliy Kuznetsov 2023.11.15 12:38
Thank you for the high rating
paddock
305
paddock 2023.05.22 12:17 
 

Great Indicator. Love the toggle button so I can keep a clean chart. Thanks to the developer for his selflessness.

Vitaliy Kuznetsov
30344
Risposta dello sviluppatore Vitaliy Kuznetsov 2023.11.15 12:38
Thank you for the high rating
aworex
1722
aworex 2022.09.25 13:43 
 

A very good indicator for those who understand the Murray Maths strategy. The Combo version is even better.

Vitaliy Kuznetsov
30344
Risposta dello sviluppatore Vitaliy Kuznetsov 2023.11.15 12:38
Thank you for the high rating
Lev Vladimirovic Marushkin
1636
Lev Vladimirovic Marushkin 2022.09.14 19:46 
 

Great! Love this indicator!

Vitaliy Kuznetsov
30344
Risposta dello sviluppatore Vitaliy Kuznetsov 2023.11.15 12:38
Thank you for the high rating
Enrique Enguix
59719
Enrique Enguix 2022.02.08 15:21 
 

Thank you for sharing this freely, it has been very interesting

Vitaliy Kuznetsov
30344
Risposta dello sviluppatore Vitaliy Kuznetsov 2023.11.15 12:37
Thank you for the high rating
Frank Paetsch
6978
Frank Paetsch 2021.07.27 22:53 
 

great! thank you

Vitaliy Kuznetsov
30344
Risposta dello sviluppatore Vitaliy Kuznetsov 2023.11.15 12:37
Thank you for the high rating
tr4ppist
97
tr4ppist 2021.03.12 22:19 
 

Thanks

Vitaliy Kuznetsov
30344
Risposta dello sviluppatore Vitaliy Kuznetsov 2023.11.15 12:37
Thank you for the high rating
Issara Seeboonrueang
6167
Issara Seeboonrueang 2020.10.02 04:09 
 

It's Murrey Math showing a history. I can settings to appropriate Symbol and Timeframe. For me, It helps to define SL and TP points. (It would be great if there was a button to On | Off) Thank you

Vitaliy Kuznetsov
30344
Risposta dello sviluppatore Vitaliy Kuznetsov 2023.11.15 12:37
Thank you for the high rating
Rispondi alla recensione
Versione 1.35 2023.12.12
Improved grid calculation on currencies whose values exceed 100k
compiled a new build 1400
Versione 1.31 2023.09.05
New build
Versione 1.29 2020.10.28
fixed errors in the description of settings
Versione 1.28 2020.10.08
fix bug
Visual button default off
Versione 1.15 2020.10.07
Add Button On/Off