PZ Divergence Trading MT5
- Indicatori
- PZ TRADING SLU
- Versione: 15.0
- Aggiornato: 19 luglio 2024
- Attivazioni: 20
Unlock hidden profits: accurate divergence trading for all markets
Special Offer: Purchase now to receive free bonuses worth $90! (Read more for details)
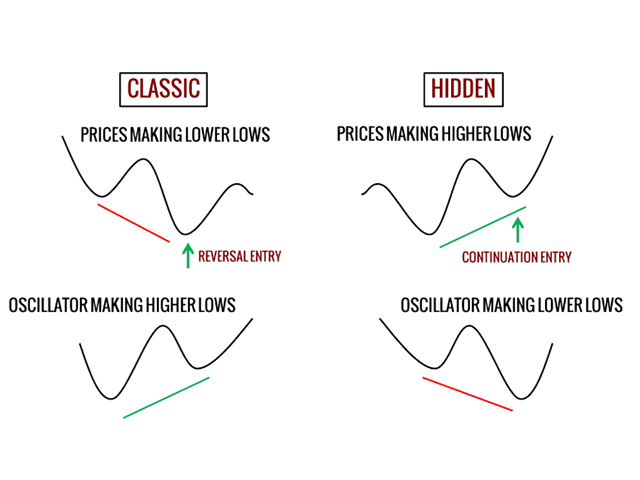
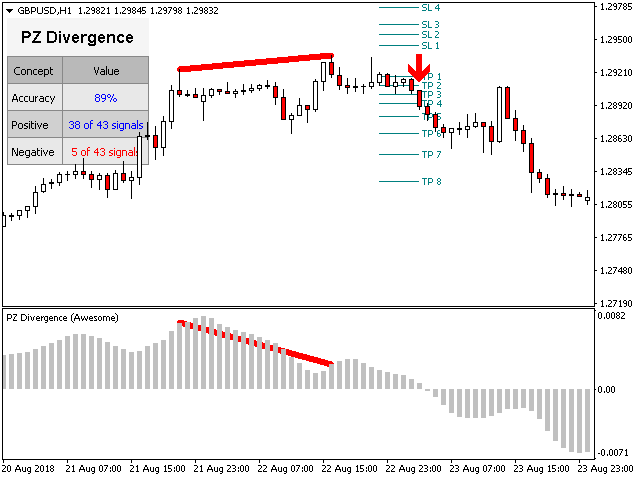
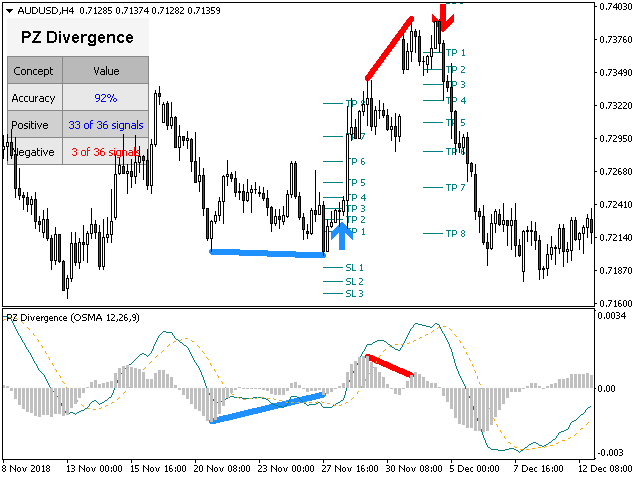
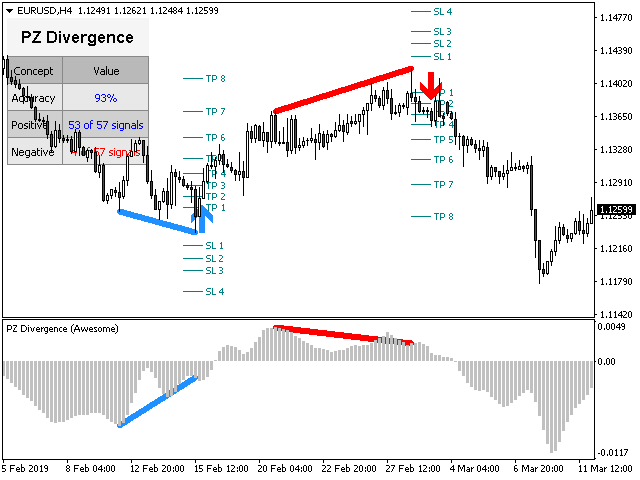
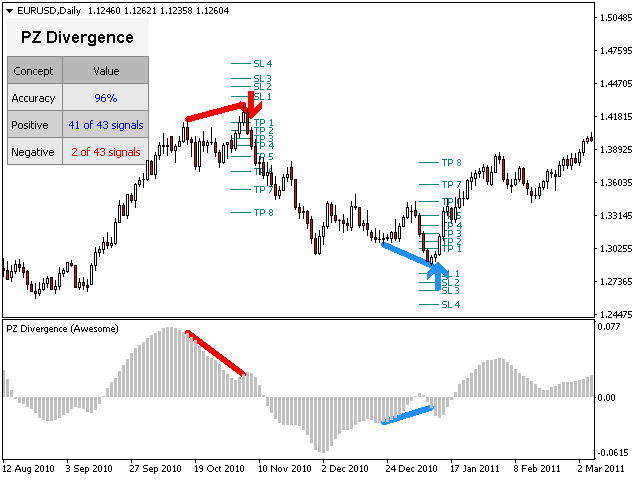
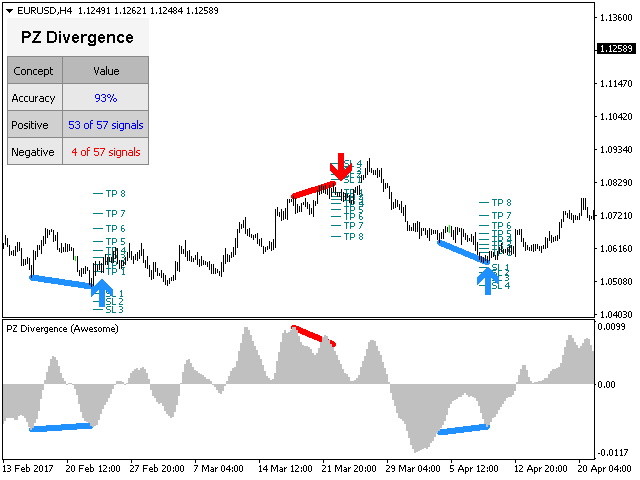
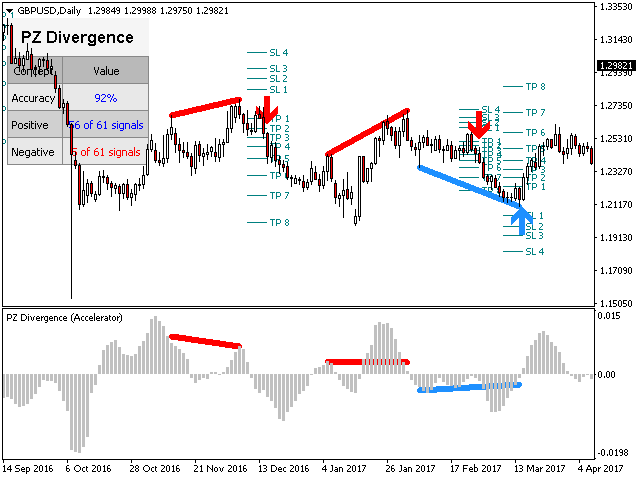
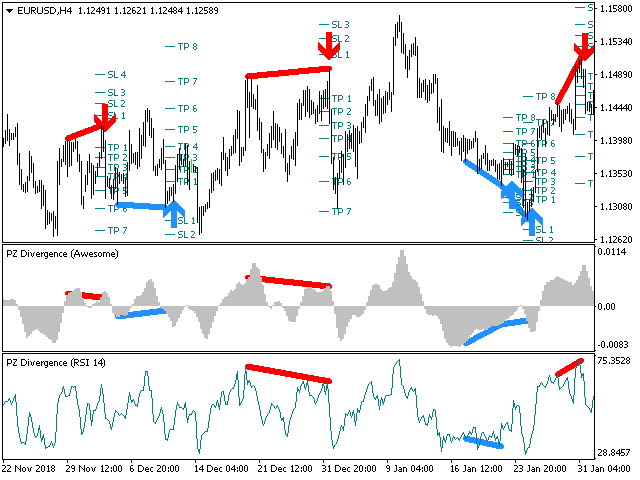
Tricky to find and scarce in frequency, divergences are one of the most reliable trading scenarios. This indicator finds and scans for regular and hidden divergences automatically using your favourite oscillator. [ Installation Guide | Update Guide | Troubleshooting | FAQ | All Products ]
- Easy to trade
- Finds regular and hidden divergences
- Supports many well known oscillators
- Implements trading signals based on breakouts
- Displays suitable stop-loss and take-profit levels
- Configurable oscillator parameters
- Customizable colors and sizes
- Filter divergences by size in bars
- It implements performance statistics
- It implements email/sound/visual alerts
To offer a broad market perspective, the indicator can be loaded many times in the same chart using different oscillators, without interference. The indicator supports the following oscillators:
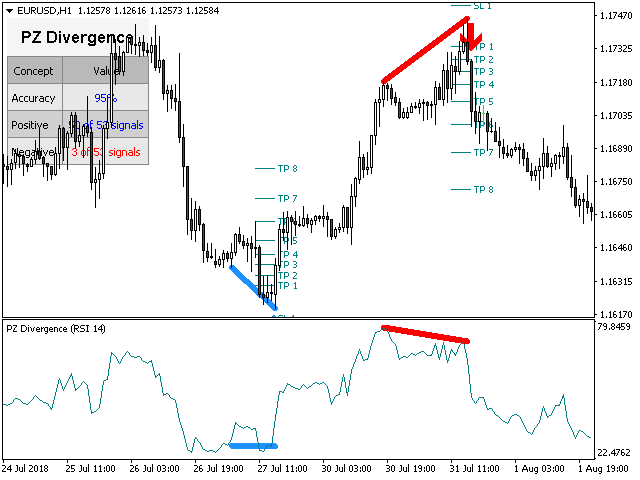
- RSI
- CCI
- MACD
- OSMA
- Stochastic
- Momentum
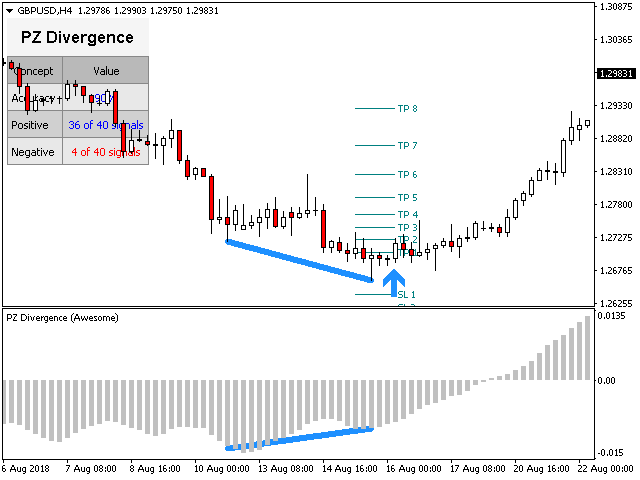
- Awesome Oscillator
- Accelerator Oscillator
- Williams Percent Range
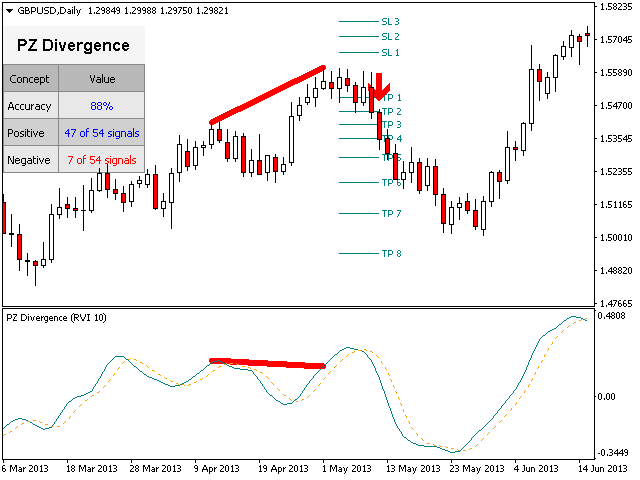
- Relative Vigor Index
- Rate of Change
Since divergences can expand quite a bit, especially in the Forex market, this indicator implements a twist: it waits for a donchian breakout to confirm the divergence before signaling the trade. The end result is an otherwise repainting indicator with a very reliable trading signal.
Input Parameters
- Amplitude: Zig-Zag period used to find divergences
- Oscillator - Choose the oscillator to load to the chart.
- Breakout period - Breakout period in bars for the trading signals.
- Divergence types - Enable or disable divergence types: hidden, regular or both.
- Min divergence size in bars - Minimum size in bars for a divergence to be displayed.
- Max divergence size in bars - Maximum size in bars for a divergence to be displayed.
- Max. history bars - Amount of bars to evaluate when the indicator is loaded.
- Indicator Settings - Desired indicator settings for all the oscillators involved.
- RSI period
- CCI period
- WPR period
- Momentum period
- Stochastic periods
- MACD settings
- RVI period
- ROC period
- Drawing Settings - Choose colors and line sizes of the divergences.
- Alerts - Enable or disable alerts of all kinds, plus set a custom alert text.
Buy today and unlock exclusive bonuses!
- PZ Chart Overlay Indicator (worth $30)
- PZ Multi Oscillator Indicator (worth $30)
- PZ Multi TDI Indicator (worth $30)
To claim these bonuses, simply send me a private message. I will provide the bonuses to actual buyers of the indicator. To ensure it is you, please leave a review for the product first, or alternatively, provide the mql5 operation number of your purchase. I'll get back to you with your bonuses as soon as possible.
The price of this indicator might increase next week!
We've introduced dynamic pricing for this indicator to reflect its true market value. With each sale, the price increases by $1, rewarding early buyers. If no sales occur within a week, the price resets to the original rate, with prices updated every Monday. This model lets the market decide the product's value, but there’s always a chance to grab your desired tools at a cheaper price if you prefer to wait.
Author
Arturo López Pérez, private investor and speculator, software engineer and founder of Point Zero Trading Solutions.


Good indicator. Thank you