PZ Divergence Trading MT5
- 指标
- PZ TRADING SLU
- 版本: 14.5
- 更新: 31 一月 2022
- 激活: 20
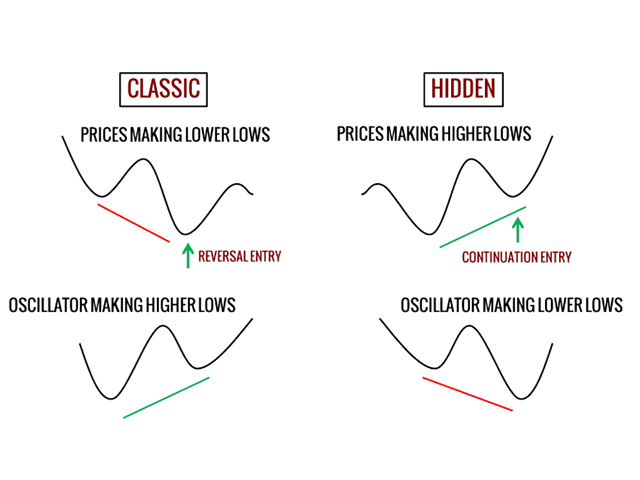
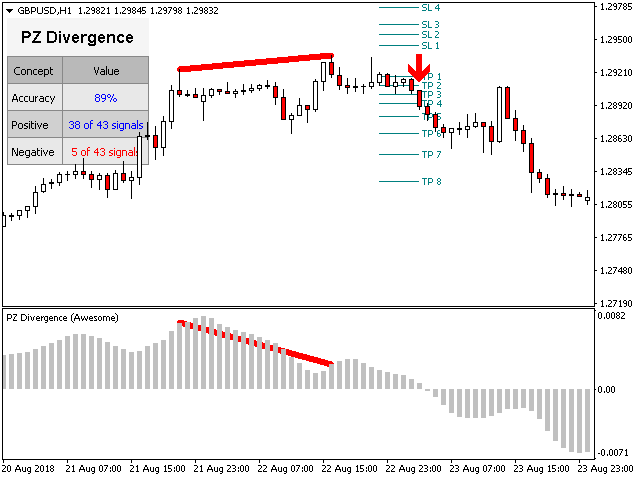
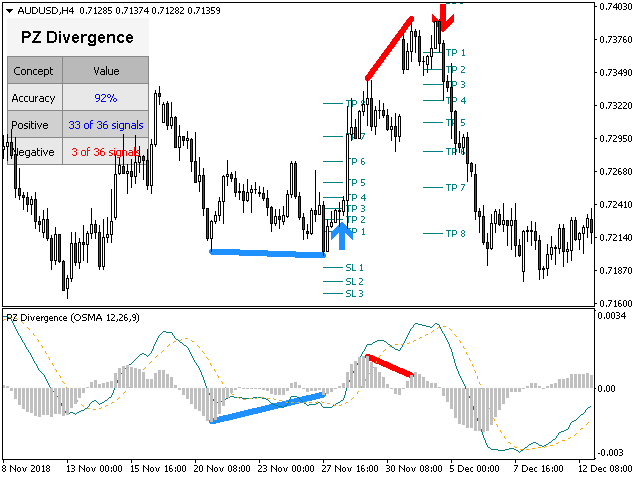
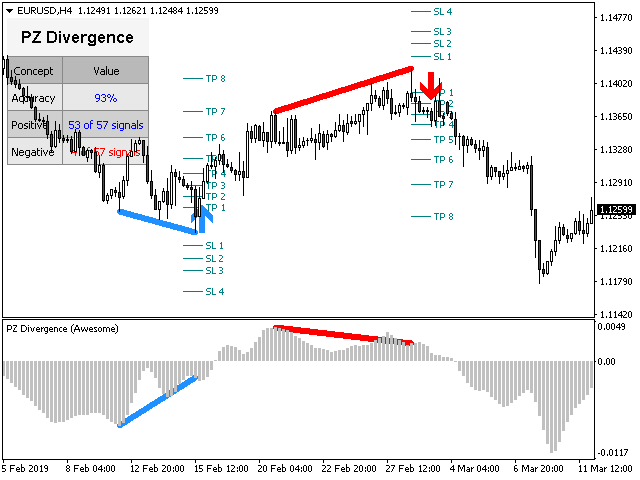
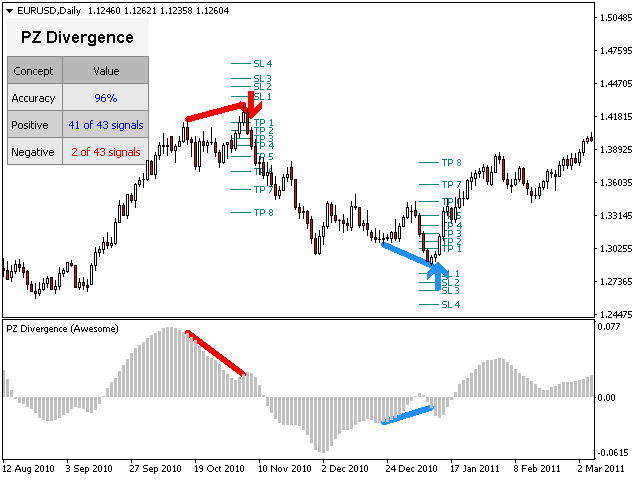
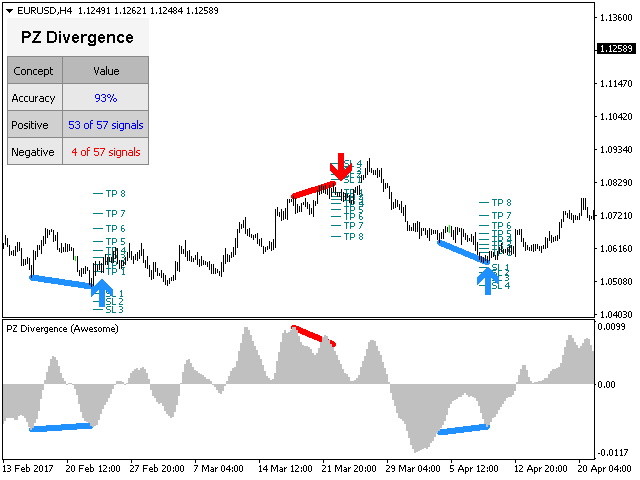
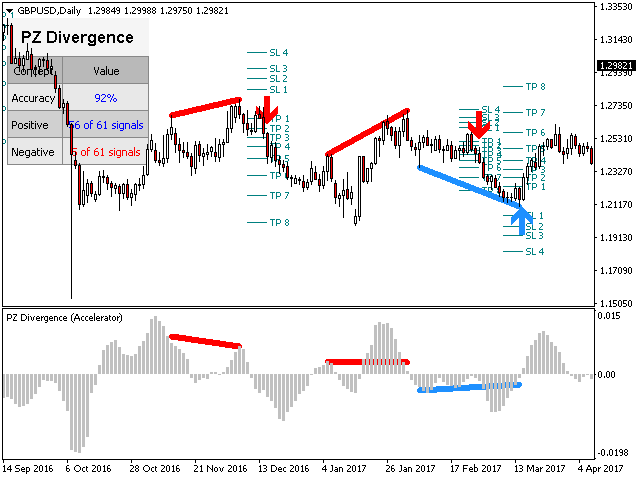
棘手的发现和频率稀缺是最可靠的交易方案之一。该指标使用您喜欢的振荡器自动查找并扫描常规和隐藏的发散。
[ 安装指南 | 更新指南 | 故障排除 | 常见问题 | 所有产品 ]
- 容易交易
- 发现常规和隐藏的分歧
- 支持许多知名的振荡器
- 根据突破实现交易信号
- 显示适当的止损和获利水平
- 可配置的振荡器参数
- 可自定义的颜色和尺寸
- 按条形过滤大小差异
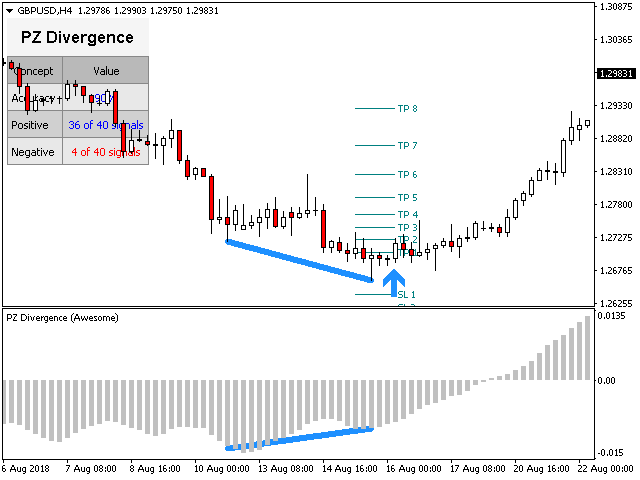
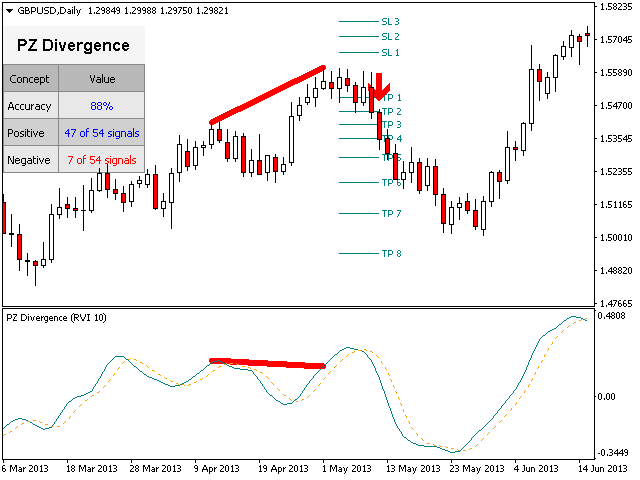
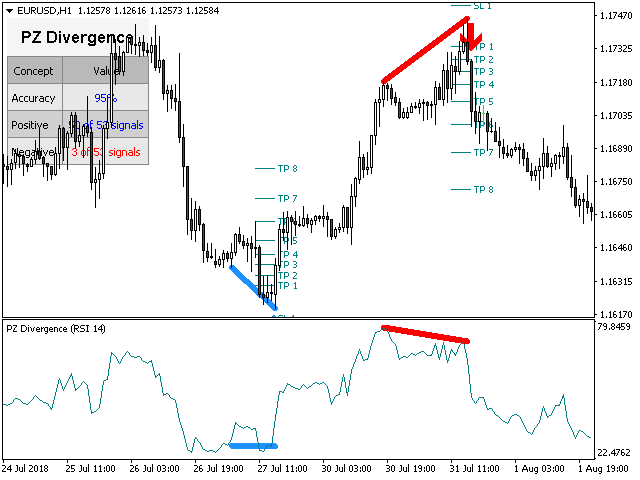
- 实现绩效统计
- 它实现了电子邮件/声音/视觉警报
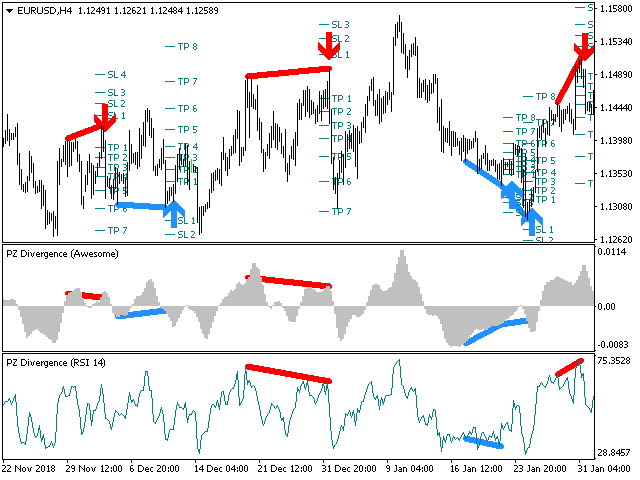
为了提供广阔的市场前景,可以使用不同的振荡器在同一张图表中多次加载该指标,而不会产生干扰。该指标支持以下振荡器:
- RSI
- CCI
- MACD
- OSMA
- 随机
- 动量
- 很棒的振荡器
- 加速器振荡器
- 威廉姆斯百分比范围
- 相对活力指数
由于差异可能会扩大很多,尤其是在外汇市场中,因此该指标产生了转折:它在等待交易突破之前等待donchian突破确认差异。最终结果是带有非常可靠的交易信号的重新粉刷指示器。
输入参数
- 幅度:用于寻找差异的之字形周期
- 振荡器-选择要加载到图表的振荡器。
- 突破期-交易信号的突破期,以柱为单位。
- 发散类型-启用或禁用发散类型:隐藏,常规或两者。
- 最小散度单位为条形-最小散度单位为条形,以显示散度。
- 最大发散尺寸(以条为单位)-显示的发散最大尺寸(以条为单位)。
- 最大。历史柱线-指标加载时评估的柱线数量。
- 指标设置-所有相关振荡器的所需指标设置。
- RSI时期
- CCI期
- WPR期间
- 动量期
- 随机时期
- MACD设置
- RVI期
- 图纸设置-选择散度的颜色和线大小。
- 警报-启用或禁用各种警报,以及设置自定义警报文本。
作者
ArturoLópezPérez,私人投资者和投机者,软件工程师,零零点交易解决方案的创始人。


I raised amplitude to 30 and hidden divergence was spot on. excellent..
Go hidden and with the trend. Using RSI