Lumetra Session Range Boxes

  • Indicatori
  • Varun Katoch
    Varun Katoch
    Sono uno sviluppatore indipendente con 10 anni di esperienza nella creazione di strumenti di trading pratici, oggi concentrato su MetaTrader 5.
    I miei prodotti MT5 sul Market di MQL5:
  • Versione: 1.0

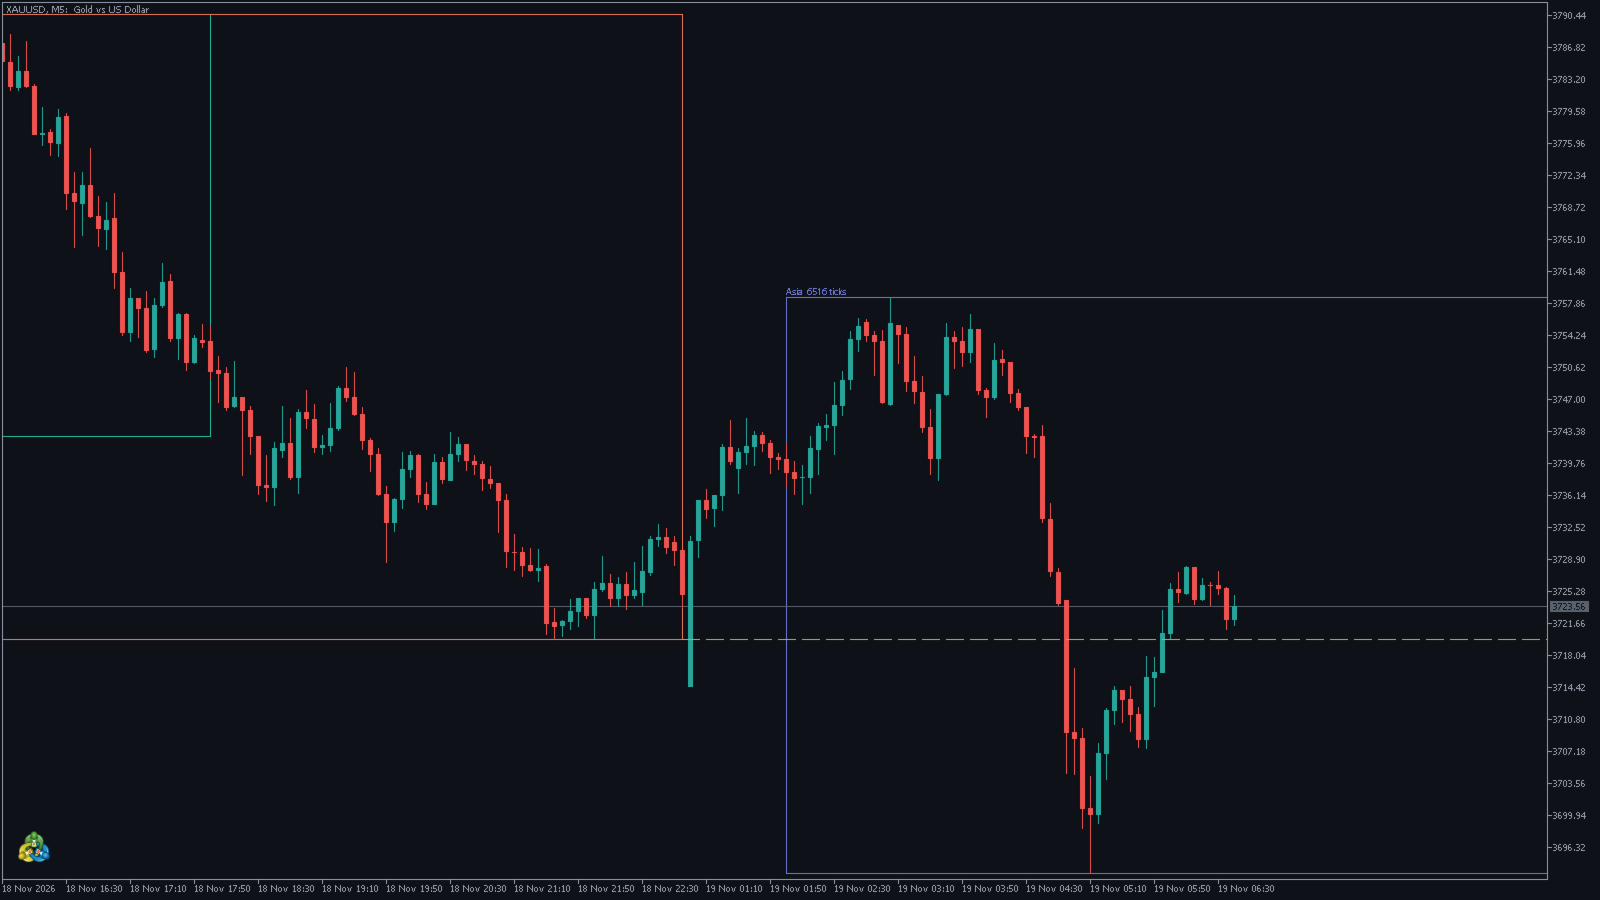
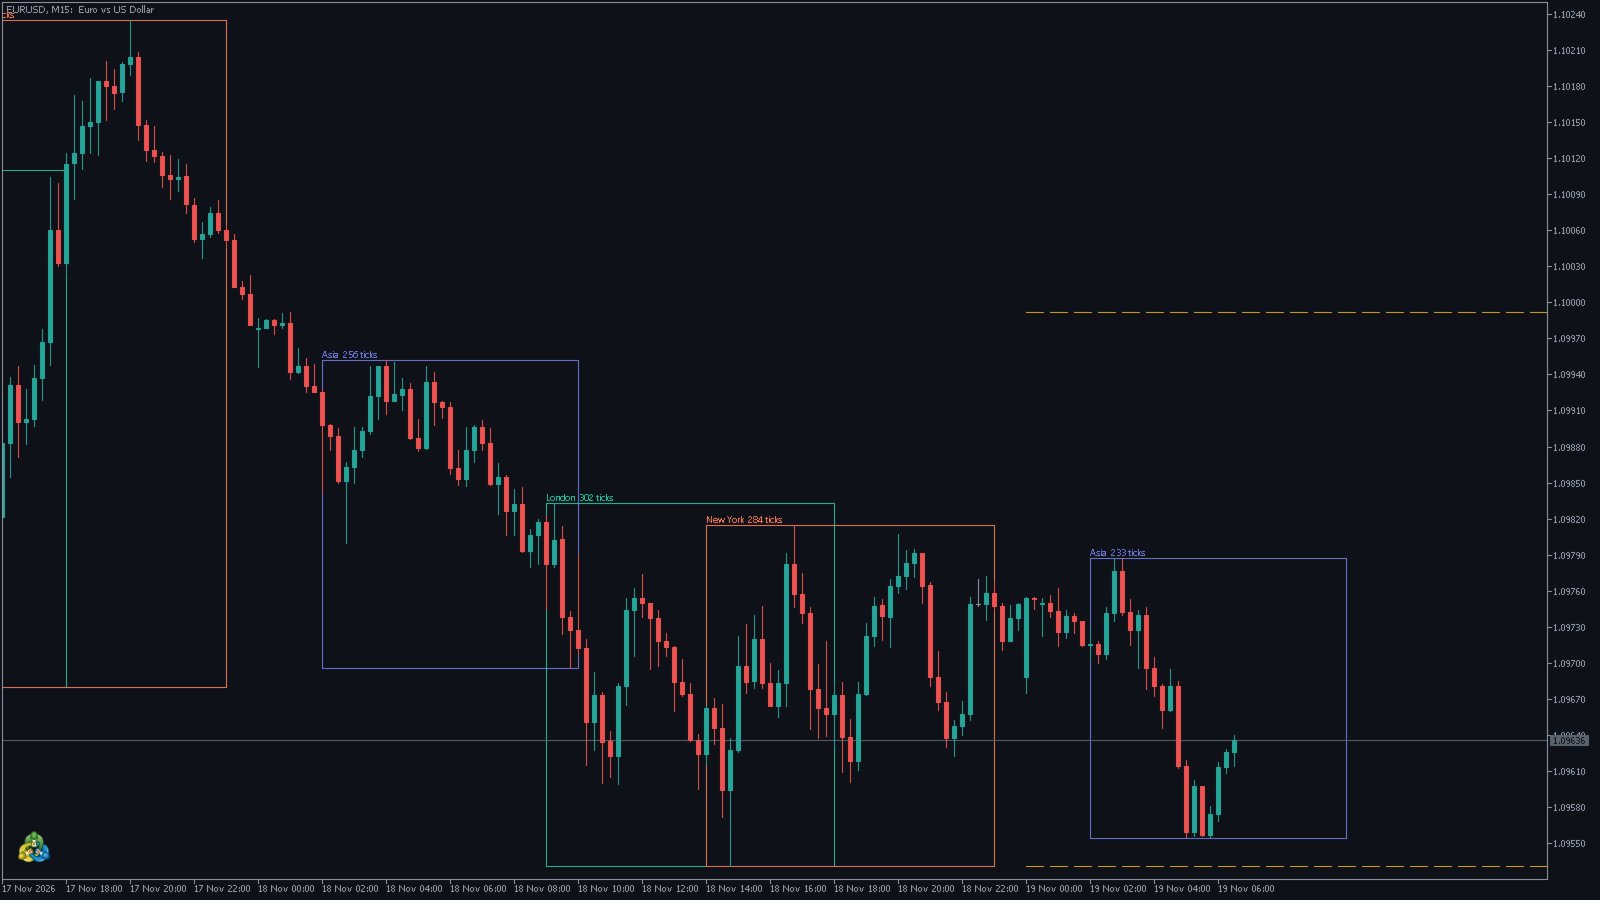
Lumetra Session Range Boxes outlines the Asia, London and New York sessions on your chart with their high, low and range in ticks, and draws the previous day high and low. Session times are set in UTC and converted to your broker's server time automatically, so the boxes line up on any broker.

What it does

  • Outlined session boxes that stay readable where sessions overlap.
  • Range label (in ticks) on every session box.
  • Previous day high (PDH) and low (PDL) lines.
  • The current session box grows live as the session develops.
  • Set any start and end hour per session, and how many days to show.

Works on M1 to H1 charts on every symbol.

More Lumetra tools for price action traders: Lumetra Fair Value Gap Zones, Lumetra Market Structure BOS CHoCH and Lumetra Twin Band Bias Cloud. Find them on my seller page.

Questions or feature requests: send me a message on MQL5.
Altri dall’autore
TickATR Indicator for MT5 Description The TickATR indicator is a powerful volatility measurement tool for MetaTrader 5 that displays the Average True Range (ATR) in terms of actual price ticks. This innovative approach provides traders with a more precise and instrument-independent way to gauge market volatility compared to traditional ATR indicators. By measuring volatility in ticks rather than price units, TickATR offers consistent readings across different instruments regardless of their pric
Apri, dimensiona e gestisci i tuoi trade direttamente dal grafico, con la giusta size del lotto ogni volta. Nexus Trade Manager è un pannello di trading veloce e pulito per MetaTrader 5. Trascina sul grafico le linee di ingresso, stop loss e take profit, guarda il rischio prima di cliccare e lascia che il pannello calcoli il lotto, sposti a breakeven e gestisca il trailing stop. Perché i trader lo usano Stesso rischio su ogni trade: inserisci quanti dollari vuoi rischiare e il pannello calcola i
Lumetra Fair Value Gap Zones finds every three-candle imbalance (fair value gap) on your chart and draws it as a clean, colour-coded zone that keeps extending to the right until price comes back and fills it. Filled gaps are removed automatically, so your chart only shows the imbalances that still matter. What it does Detects bullish and bearish fair value gaps on closed bars only. Zones never repaint. Extends each open gap to the current bar until it is mitigated. Three mitigation rules: touch,
Lumetra Market Structure maps price action for you: it labels confirmed swing highs and lows as HH, HL, LH or LL and marks every break of structure (BOS) and change of character (CHoCH) with a clean line from the broken swing to the candle that closed through it. What it does Swing points are confirmed after a set number of bars on each side, then they never move. BOS and CHoCH need a candle close beyond the swing, not just a wick, which removes most false breaks. CHoCH lines are solid and BOS l
Lumetra Twin Band Bias Cloud combines two band envelopes (for example an EMA-based and an SMA-based band) into a buy cloud below price and a sell cloud above it. The clouds show where price has been stretched, and the panel in the corner gives you the daily bias, current volatility in ticks and the distance between the clouds. What it does Buy zone = area between the two lower bands. Sell zone = area between the two upper bands. Each band has its own period, average type (SMA, EMA, SMMA, WMA), d
Lumetra Order Block Zones marks the last opposite candle before a strong displacement move: the order block Smart Money (SMC) traders watch for a return of price. Each block is drawn as a clean glowing zone that extends to the right, shows whether it is still fresh or already tested, and disappears once price closes through it. What it does Finds bullish and bearish order blocks on closed bars only. Blocks never repaint. Displacement filter: the move away from the block must be larger than a mul
Lumetra Liquidity Sweep Marker shows where liquidity rests and when it gets taken. Swing highs (buy-side liquidity, BSL) and swing lows (sell-side liquidity, SSL) are drawn as pools that extend to the right. When a candle wicks through a pool and closes back inside, the indicator marks the sweep with a line, a label and an arrow: the classic stop hunt that Smart Money traders look for before a reversal. What it does Liquidity pools at confirmed swing highs and lows (BSL / SSL), extended until th
Lumetra Anchored VWAP Bands plots the volume weighted average price from the anchor you choose (each session, each week, each month or any custom date and time) together with two standard deviation bands. The outer bands are filled as soft clouds, so stretched prices are easy to see, and the panel tells you exactly how many standard deviations price is away from VWAP right now. What it does Anchors: session (with your own session start hour), week, month or a custom time. VWAP from typical price
Filtro:
Nessuna recensione
Rispondi alla recensione