SMC Complete Toolkit
- Indicatori
- Versione: 1.0
- Attivazioni: 10

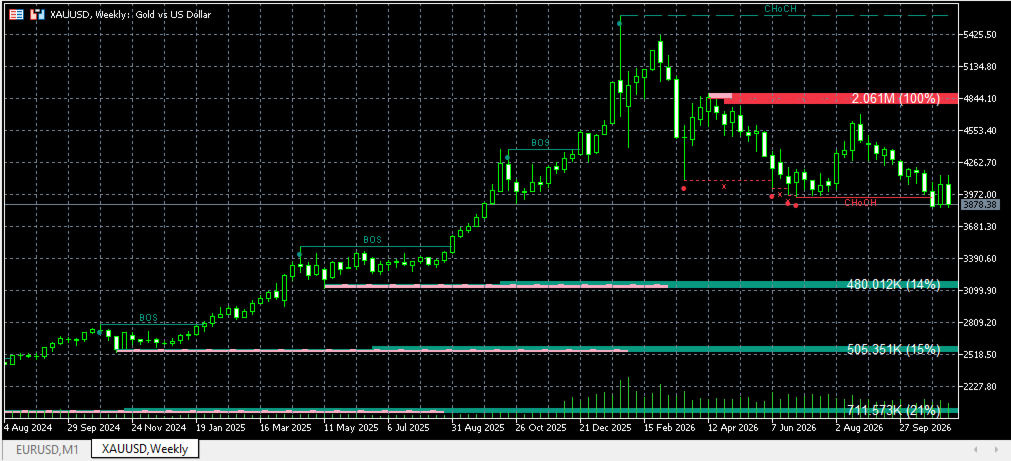
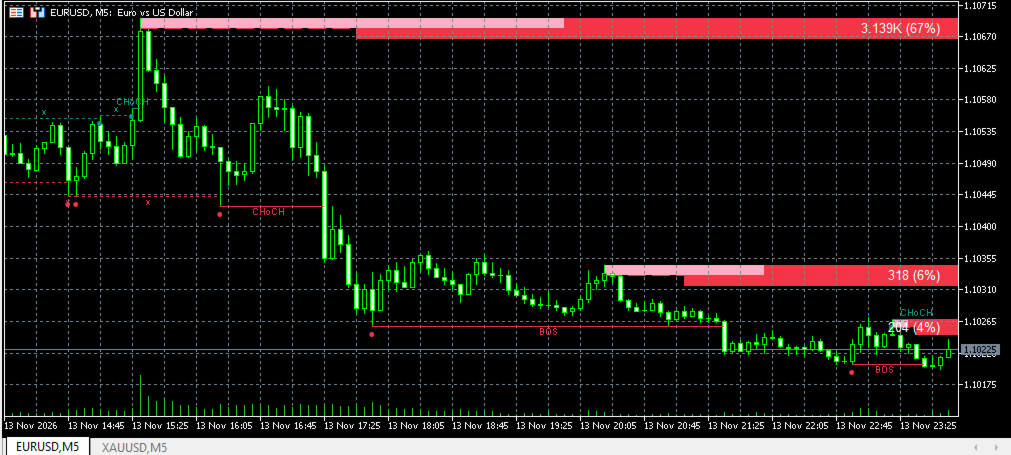
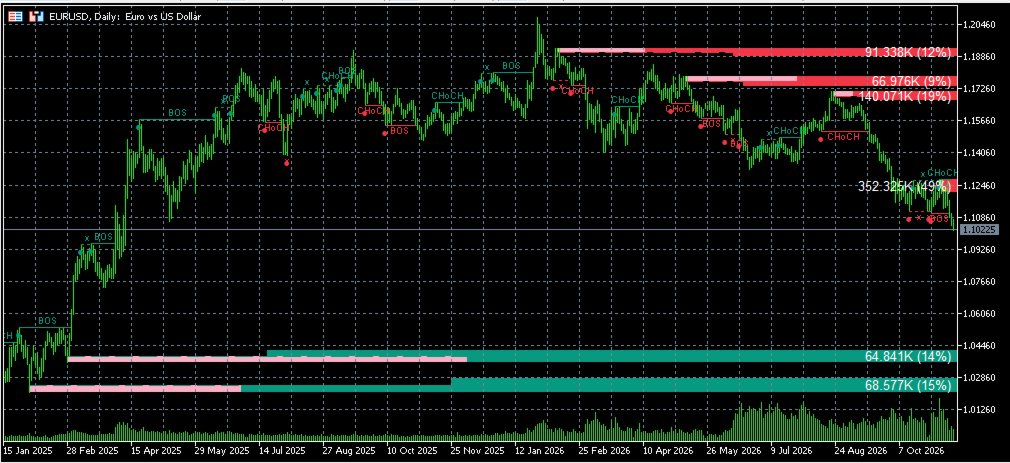
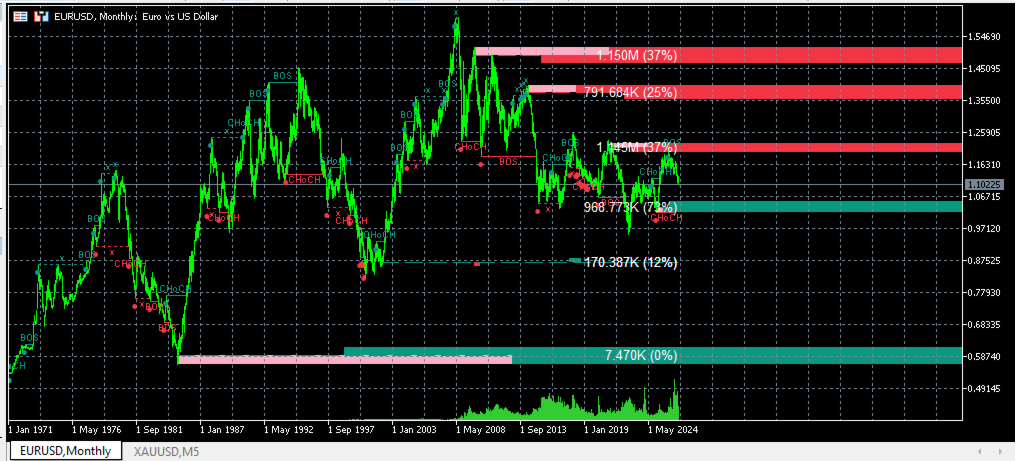
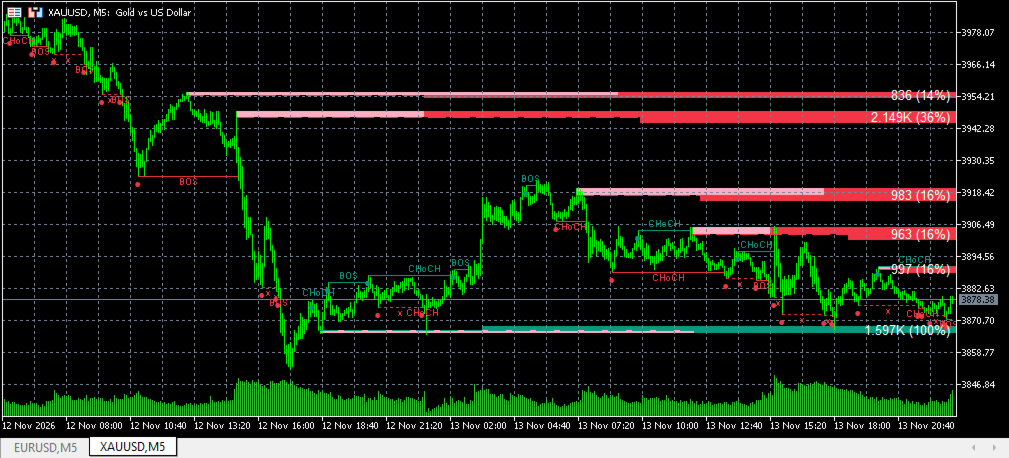
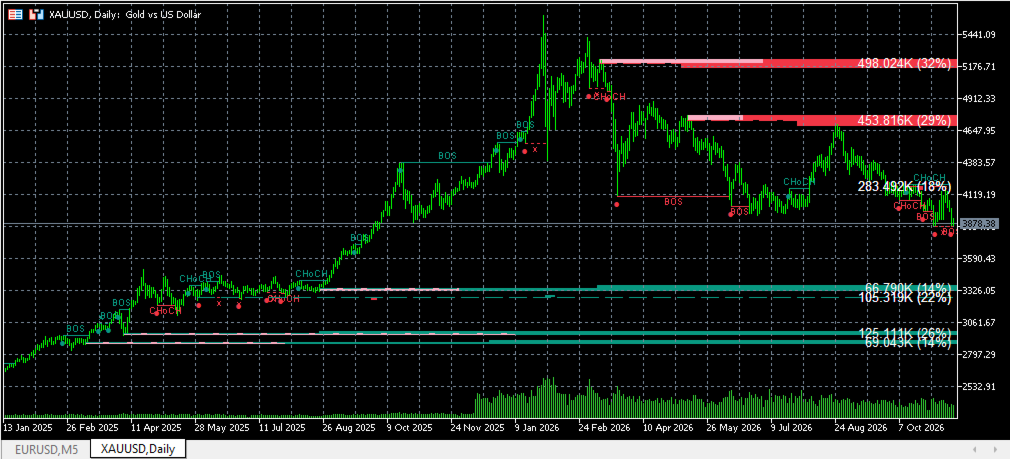
SMC Complete Toolkit is a technical indicator that operates on an “all-in-one” basis—it independently analyzes the market. It puts together all the key Smart Money Concepts tools into a single indicator: market structure, BoS, CHoCH and sweeps, order blocks (OB) with breakers, volumes, levels, fair value gaps (FVG) and structure mapping. No need to stack and configure many different tools. Attach the indicator to your instrument graphic and you are good to go with the default settings. You can also personalize the tool to your own preferences in the settings.
🌟SMC Complete Toolkit is an analysis indicator to help you read the market the way smart money pro traders do, with every key tool on one chart. This shortens your market analysis time.
What you gain:
1. Market structure (BOS, CHoCH, sweeps)
- Automatic detection of Break of Structure (BOS) and Change of Character (CHoCH)
- Liquidity sweeps marked with an “x”
- Optional candle coloring by trend, so you can see the current direction at a glance
- Adjustable pivot length, with optional bubbles on the structure points
- Two algorithms: Extreme Points and Adjusted Points
2. Volumetric order blocks (OB)
- Bullish and bearish order blocks drawn as zones extended to the right
- The volume of each block and its share of the total, so you can see which blocks carry the most weight
- A buy/sell activity split inside each block
- Breakers: blocks that have been broken turn into opposite zones
- Mitigation methods: Close, Wick or Avg (Average)
- Overlapping blocks can be hidden, keeping the most recent or the oldest
- Optional mid-line and metrics text
3. Fair value gaps (FVG)
- Bullish and bearish gaps with an adjustable size threshold
- FVG or Breakers mode
- Optional extension to the right, mid-line and raid display
- Overlapping gaps can be hidden
4. Structure mapping
- A simplified swing map that shows the market’s path without the noise
Why traders choose it
- Four tools in one indicator, with one set of settings
- Full control over colors, text sizes, transparency and how zones show
- Works on any symbol (forex, gold, indices, crypto) and any timeframe
How to use it
- Attach it to a chart on any symbol or timeframe.
- Observe the market structure: trend, BoS or CHoCH.
- Use order blocks and FVGs as areas of interest where price is more likely to react.
- Use breakers and liquidity sweeps for confirmation purpose.
- Practice risk management.
Most frequently used parameters
- The default settings are generally good to go.
- Calculation mode :
- On bar close (no repaint): zones and structure are calculated only on closed bars. This is the default and the lightest on the CPU.
- On every tick (repaints while the bar forms): the forming bar is also analyzed live, as on charting platforms such as TradingView. Zones and signals can appear and disappear before the bar closes, so use this mode with that in mind.
- Window size (limit the calculation range): Limits the calculation to the last N bars (minimum 1000, default 5000).
Good to know
- SMC Complete Toolkit is an analysis tool. It draws structure and zones, and it does not place trades or give automatic entry signals.
- Volume figures use the tick volume provided by your broker.
- It analyzes the chart’s own timeframe and does not pull data from other timeframes.
- All objects are drawn on the chart, and they are removed when you remove the indicator.
All parameters and their details
1. Calculation mode
| Parameter | Role | How to use |
|---|---|---|
| Calculation mode | Decides when the indicator calculates | On bar close (default): levels are final once a bar closes, no repaint, lightest on the CPU. On every tick: the forming bar is analyzed live, so zones can appear and disappear before the close. |
2. Market structure
| Parameter | Role | How to use |
|---|---|---|
| Window + Window size | Limits the calculation to the last N bars (minimum 1000, default 5000) | Keep it on for speed. Lower the size on slow terminals. Turn it off to analyze the full history. |
| Show swing structure | Draws the BOS / CHoCH lines | Turn off if you only want zones. |
| Limit swing structure to the last N items | Number of structure lines kept on screen | Lower it for a cleaner chart. |
| Bullish / Bearish swing color | Colors of the structure lines | Match your chart theme. |
| Show mapping structure | Draws the simplified swing map | Off by default. Turn on for a clean view of the swing path. |
| Mapping line style / color | Look of the mapping line | Cosmetic. |
| Color candles by trend | Colors candles by the current structure trend | Turn on for a quick read of direction. |
| Structure text size | Size of the BOS / CHoCH labels | Increase on high-resolution screens. |
| Algorithmic logic | Extreme Points or Adjusted Points | Extreme uses the absolute highs and lows. Adjusted refines the structure using confirmed pivots. Compare both on your instrument. |
| Pivot length (min. 2) | Bars on each side needed to confirm a pivot | A larger value gives fewer, more significant structure points. A smaller value reacts faster. |
| Build sweeps (x) | Marks liquidity sweeps with an “x” | Turn off to remove the sweep marks. |
| Show bubbles | Dots at the start of the structure lines | Cosmetic. |
3. Volumetric order blocks
| Parameter | Role | How to use |
|---|---|---|
| Show order blocks + Number shown | Displays the last N order blocks | Keep a low number (3–5) for clarity. |
| Bullish / Bearish order block color | Zone colors | Cosmetic. |
| Show buy/sell activity + colors | Splits each block into buy and sell activity | Useful to judge which side was active inside the block. |
| Show breakers + colors | Keeps broken blocks as opposite zones | Turn on if you work with breaker blocks. |
| Construction | Length or Full | Length sizes the block with the ATR. Full uses the whole candle range. |
| Length (min. 1) | ATR factor for the Length construction | Lower values give thinner blocks, higher values give thicker ones. |
| Mitigation method | Close, Wick or Avg | Defines when a block counts as broken: by the candle close, by the wick, or by the mid-line. Close is the strictest. |
| Metrics text size + Show metrics | Volume and percentage label on each block | Turn off for a minimal chart. |
| Show mid-line | 50% line of each block | Helps with partial mitigation. |
| Hide overlapping blocks + Overlap: keep | Removes blocks that overlap each other | Keep Recent or Old, depending on which one you consider more relevant. |
4. Fair value gap
| Parameter | Role | How to use |
|---|---|---|
| Show fair value gaps | Turns the FVG display on | Off by default. |
| Mode | FVG or Breakers | FVG removes a gap once it is mitigated. Breakers keeps it as an opposite zone. |
| Number of FVGs shown | Gaps kept on screen | Keep it low for a clean chart. |
| Bullish / Bearish FVG color | Zone colors | Cosmetic. |
| Mitigation method | Close / Wick / Avg | Same logic as for order blocks. |
| Threshold (0 – 2) | Filters out small gaps, based on the ATR | 0 shows all gaps. Raise it to keep only the significant ones. |
| Hide overlapping FVGs | Removes overlapping gaps | Keep on to reduce clutter. |
| Show mid-line | 50% line of each gap | Optional. |
| Extend FVGs to the right | Projects gaps into the future | Turn on to see gaps ahead of price. |
| Display raids (sweep of a gap’s edge by price) | Marks gap raids | Off by default. |
5. Display (MT5)
| Parameter | Role | How to use |
|---|---|---|
| Use transparency | Enables transparent fills | Turn off if fills look odd on your terminal. |
| Order block / Activity / Breaker / FVG opacity (0–255) | Opacity of each fill (0 = invisible, 255 = solid) | Lower for a lighter chart, raise for stronger zones. |
| Extension to the right (bars) | Length of the zone projection | Increase to see zones further ahead. |
Wishing you successful and profitable trading sessions .👍