Ogs
- Utilità
- Versione: 1.0
- Attivazioni: 5

# Omega — Session-Cycle Visualization & Analytics for MT5
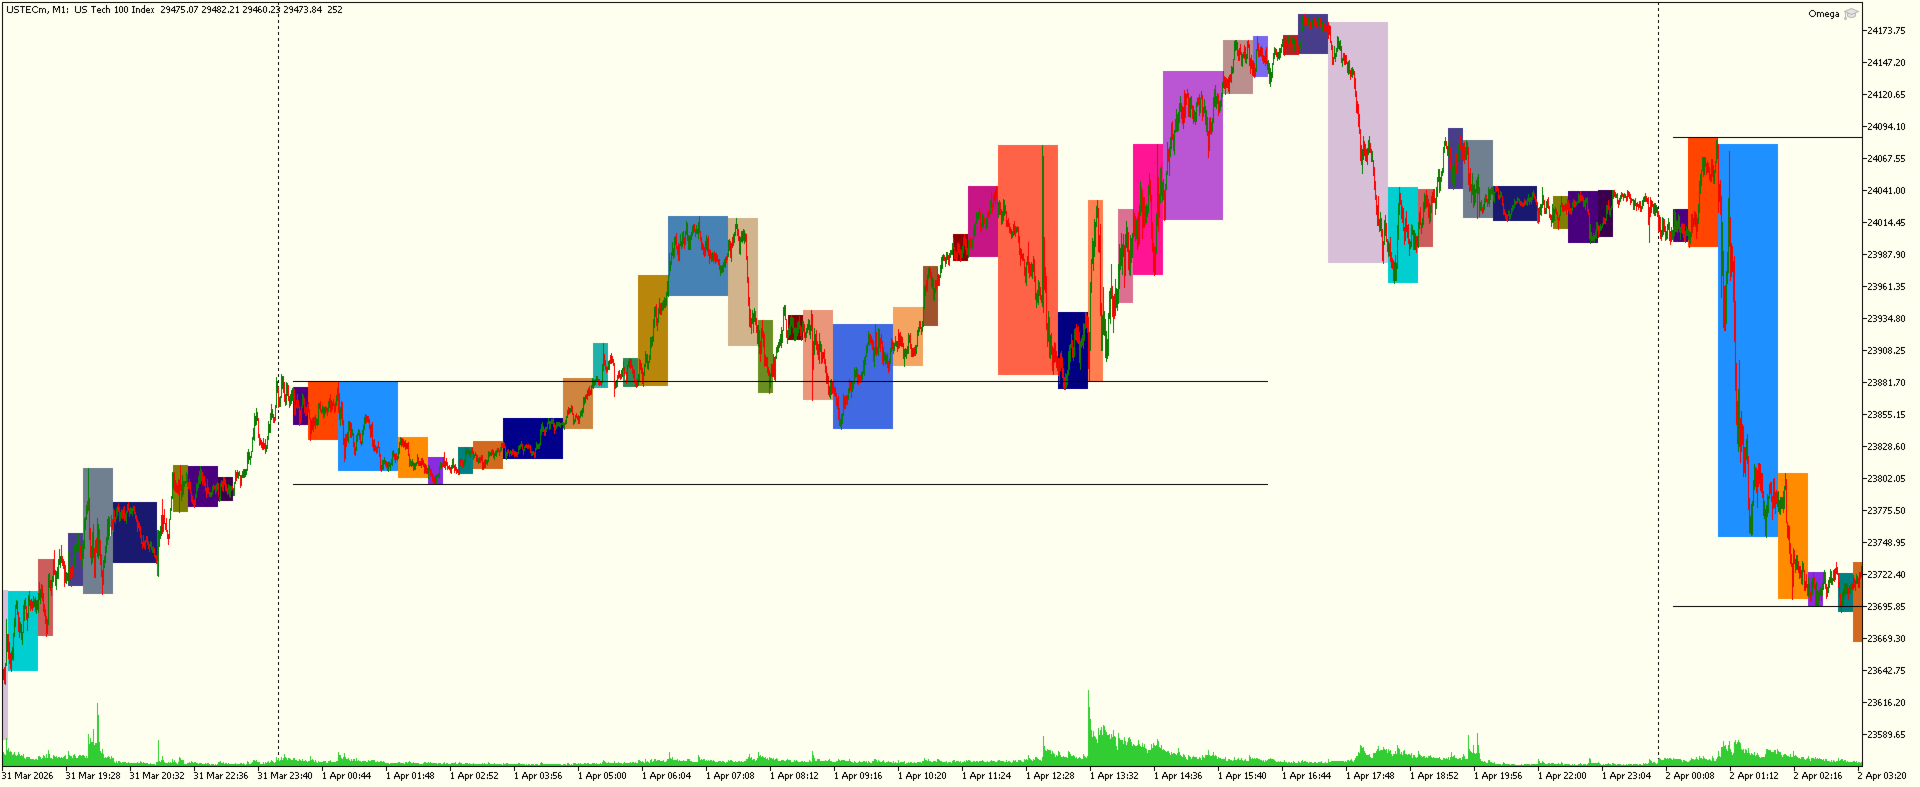
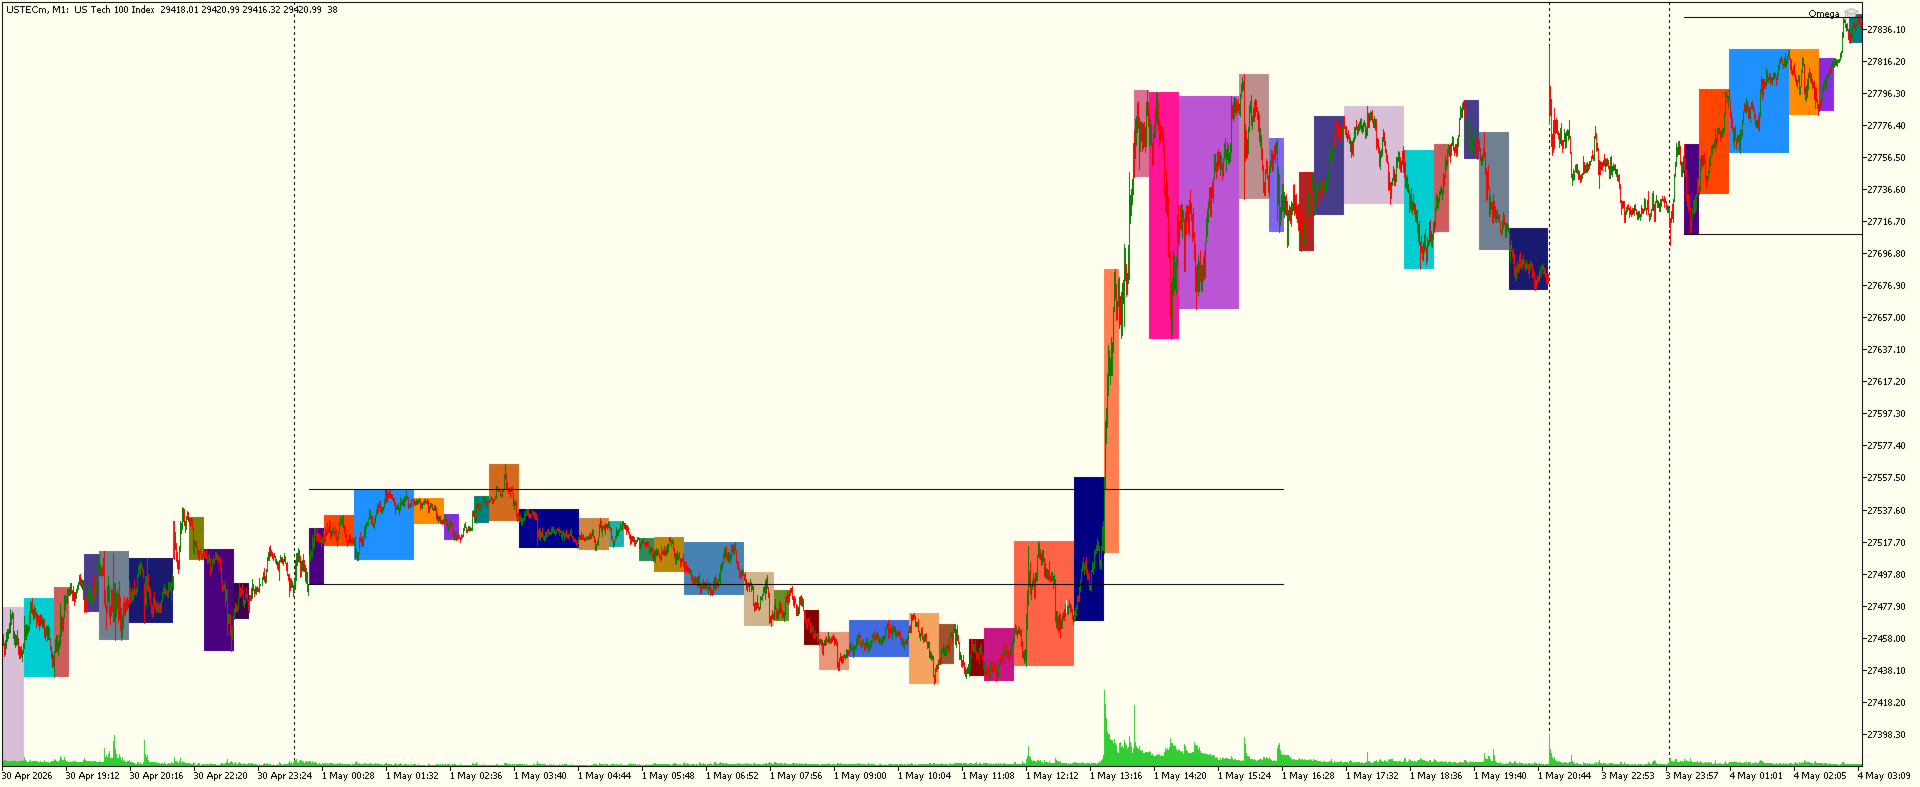
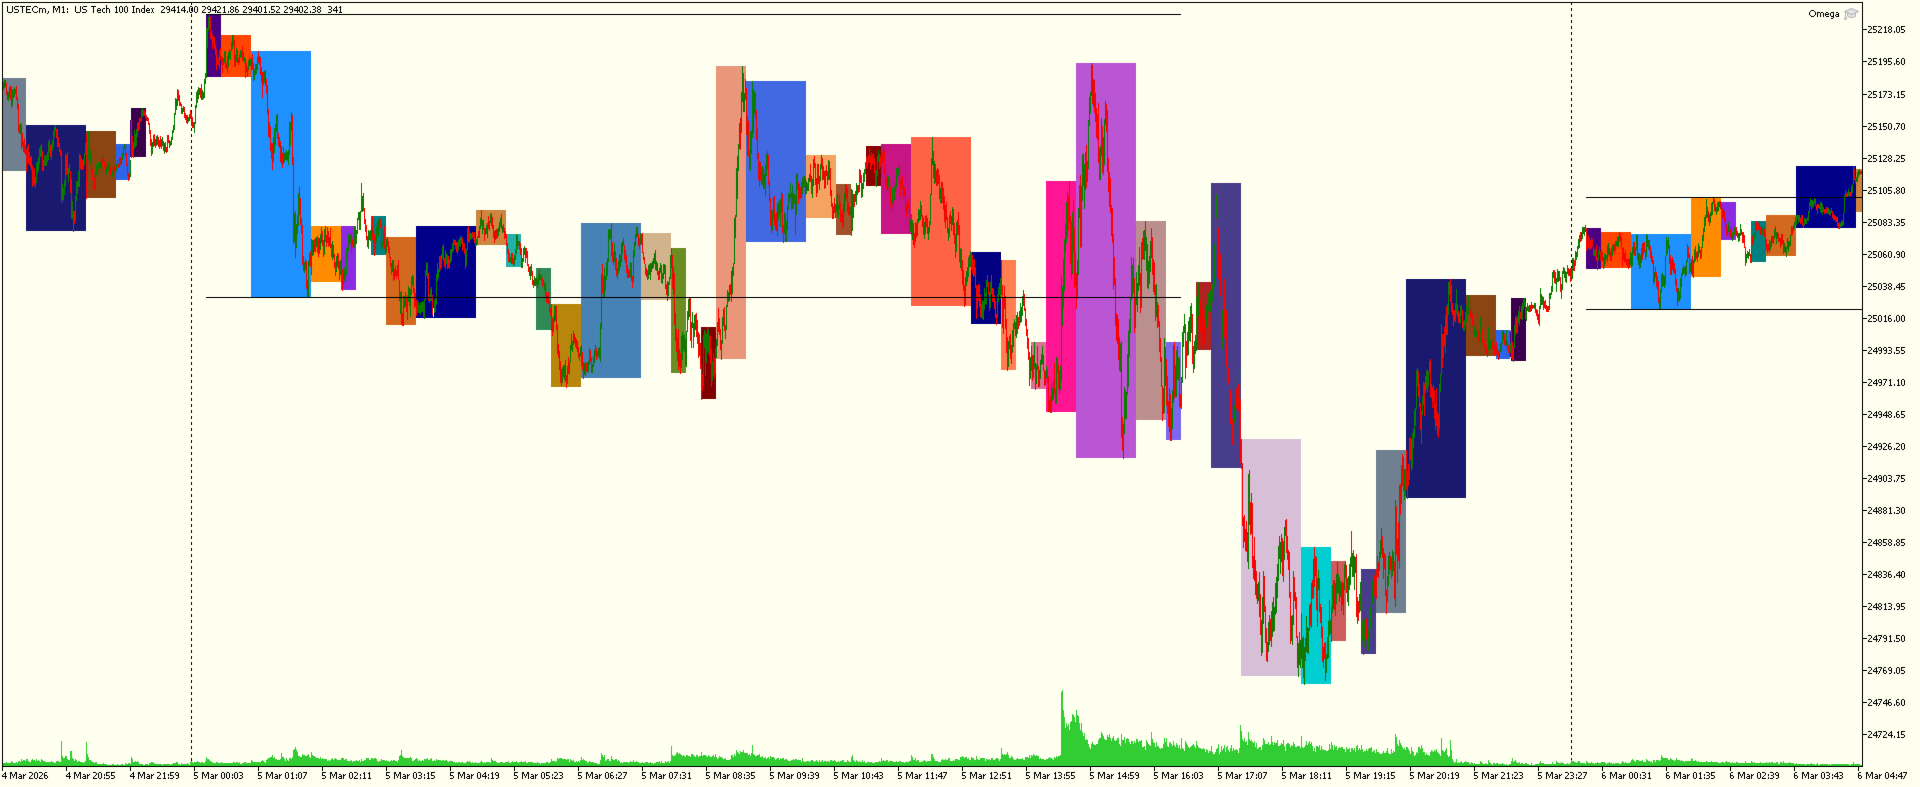
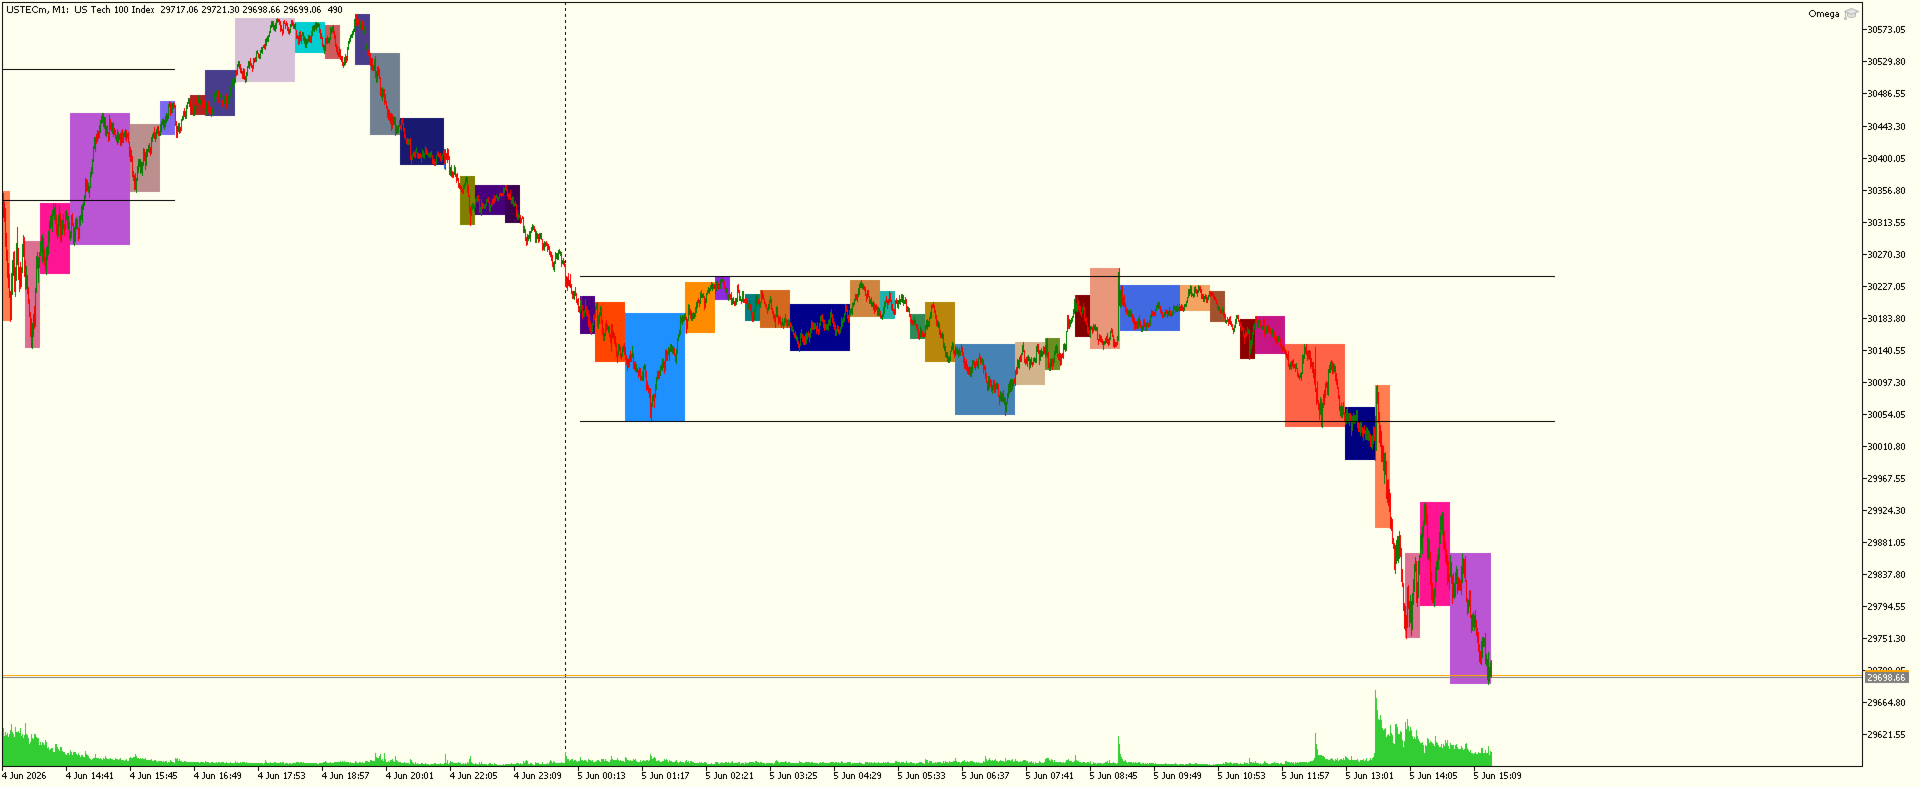
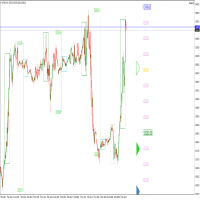
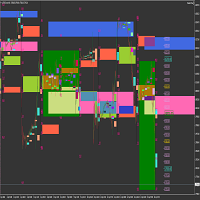
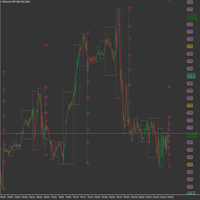
**Omega** turns your chart into a structured map of the trading day. It automatically
divides every session into 9 recurring time-cycles, draws them as color-coded
rectangles, overlays a live Fibonacci fan, and silently logs every box, breakout,
and structural event to a local SQLite database you can query, chart, or build a
dashboard on top of — all with zero manual input.
This is a **visualization and analytics tool**, not a signal generator: Omega does
not place trades. It gives you a clean, consistent, repeatable structural reference
that you apply with your own discretion or your own strategy logic.
## Key Features
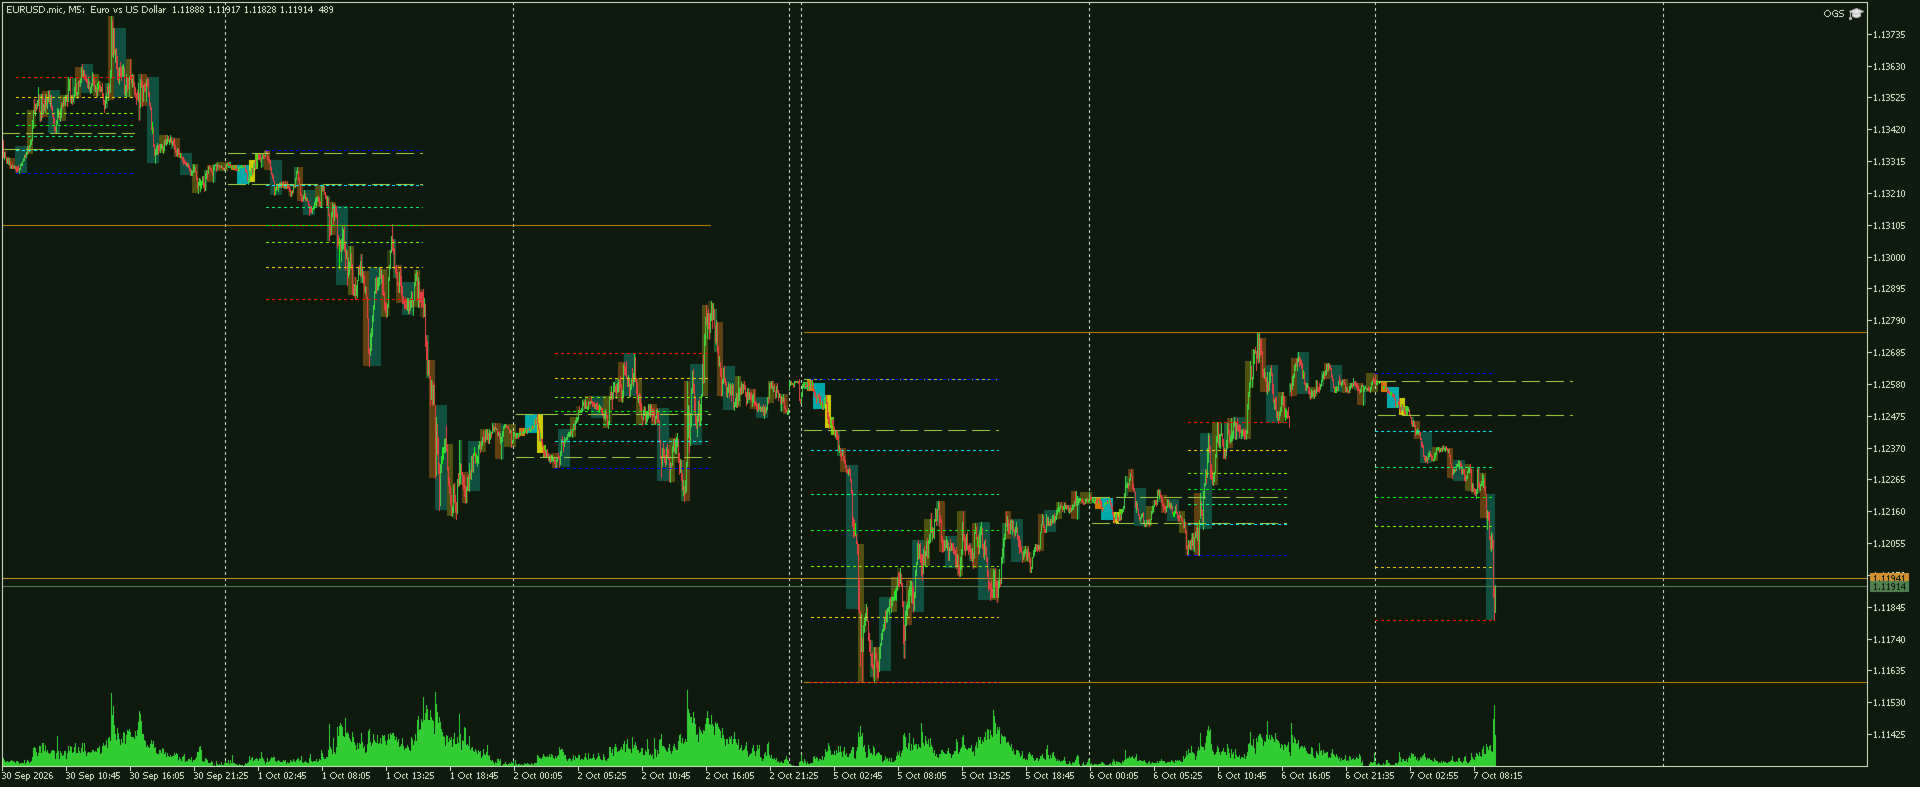
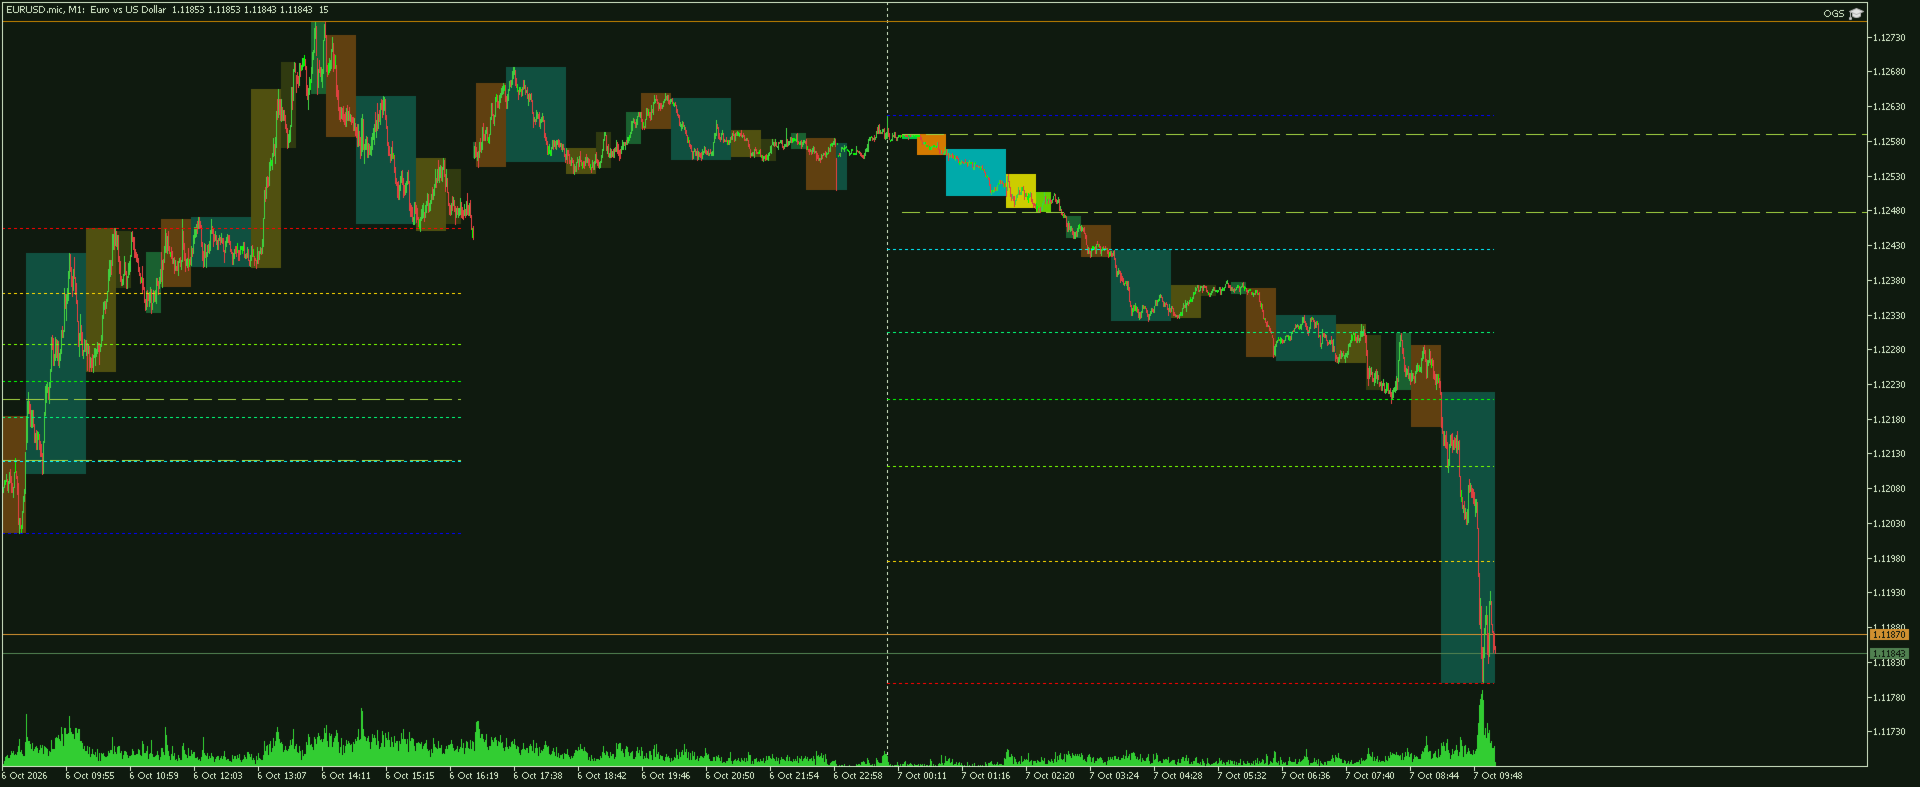
**Automatic 9-cycle session mapping**
Every trading day is split into 9 recurring cycles (Cycle 1 is the daily "Anchor"),
each broken into 5 sub-slots (opening micro-session → early development → mid-session
body → late-session → closing micro-session). Boxes are generated automatically as
each new day rolls in — no manual redrawing, no re-attaching the EA.
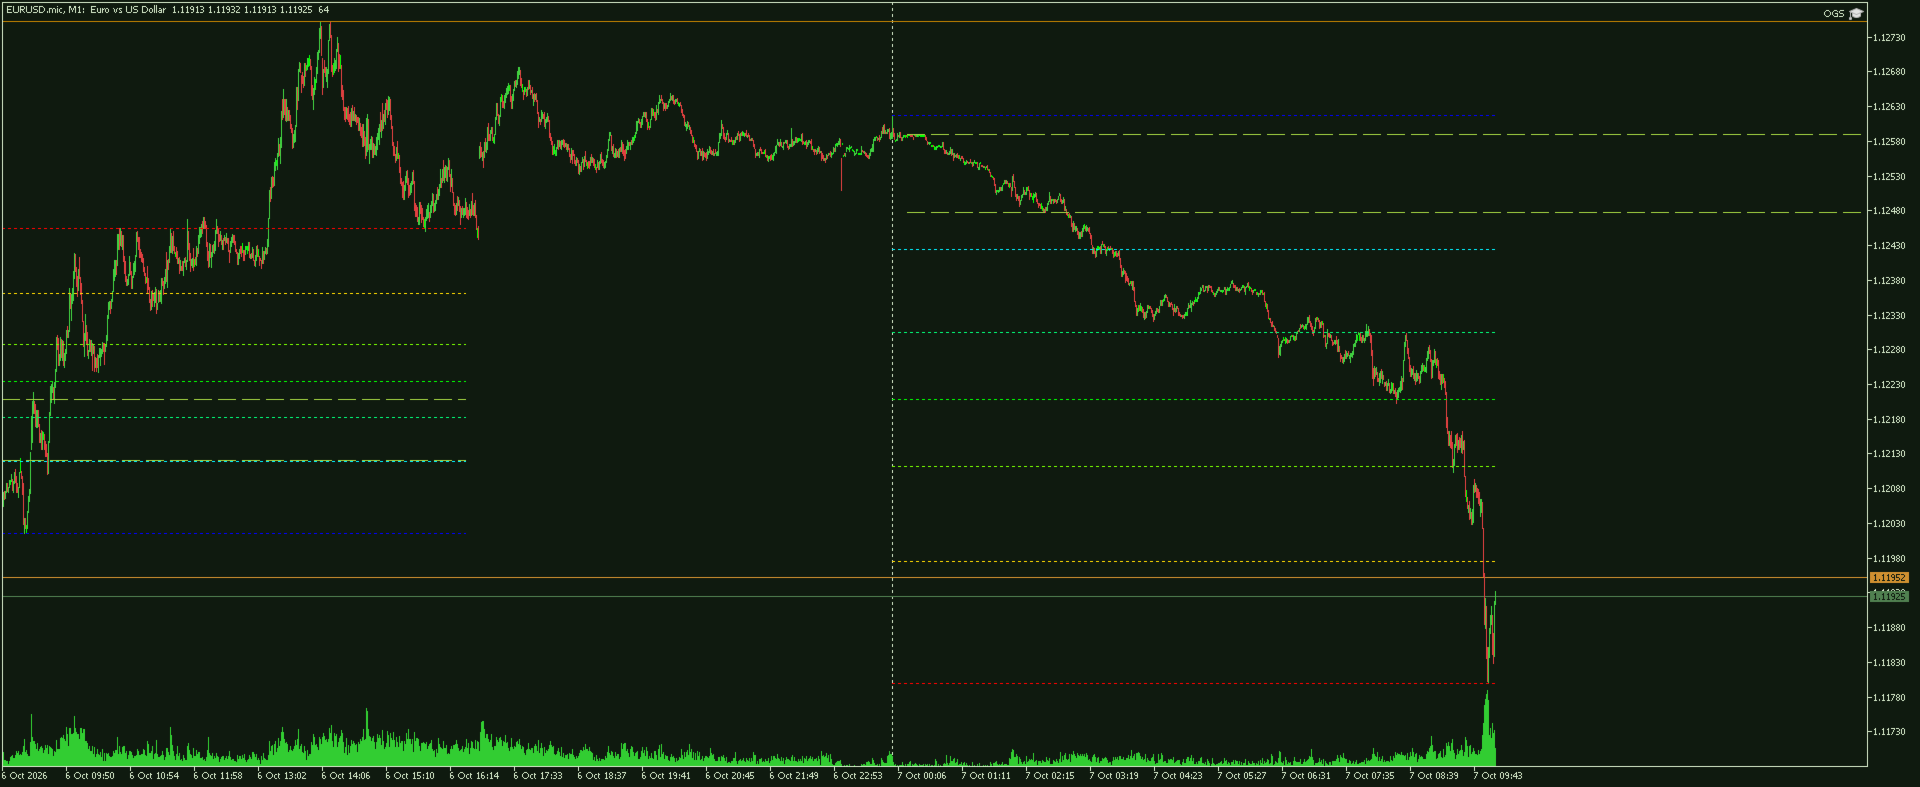
**Live daily Fibonacci fan**
A 7-level Fibonacci fan (0%, 23.6%, 38.2%, 50%, 61.8%, 78.6%, 100%) is plotted across
the day's developing range and heat-colored from blue (0%) through to red (100%) for
instant visual read. The fan tracks the session in real time while it forms, then
locks once the window closes.
**Helix structural analytics**
For every completed cycle box, Omega computes how far price deviated above and below
the daily anchor range and classifies the result (clean bullish/bearish extension,
or a "Helix Weave" — a choppy move that fails through both sides). Every close-through
breakout of a box edge is also detected and measured in pips.
**Daily & weekly anchor references**
Cycle 1's range becomes the day's anchor; Monday+Tuesday's combined range becomes the
week's anchor. Both are drawn as persistent reference lines and resolve automatically
once enough of the session has actually printed — no lookahead, no repainting.
**Built-in SQLite analytics database**
Every session box, breakout event, and Helix reading is written to a local
`SessionHistory.sqlite` database (tables: `SessionRectangles`, `BreakoutHistory`,
`HelixAnalytics`), ready for your own queries, journaling, or an external dashboard.
The database self-maintains: older data is periodically archived, and a configurable
size cap (default 2 GB) triggers a full, automatic reset so it never grows unbounded.
**5 built-in color themes**
Midnight Steel, Solar Savanna, Arctic Dawn, Volcanic Forge, and Forest Canopy — switch
your whole chart's palette (background, candles, cycle colors, anchor lines) with one
input.
**Performance-minded by design**
Only the single "live" session box is reprocessed every tick; everything else updates
on bar close. The Fibonacci fan recomputes once per closed bar rather than on every
tick, keeping it fast and stable with no visual flicker. History rendering depth, M1
timeframe lock, and auto-zoom are all configurable.
## Inputs
| Group | Input | Description |
|---|---|---|
| Display | InpColorTheme | One of 5 built-in color themes |
| Display | InpHistoryDays | How many days of history to render (chart objects) |
| Display | stay_on_M1 | Force the chart to stay on the M1 timeframe |
| Display | auto_zoom | Automatically adjust chart zoom |
| Database | DB_MaxSizeBytes | Size cap (bytes) before the database is fully reset — default 2 GB |
## Who it's for
Traders who use session-time, Fibonacci-retracement, or opening-range style analysis
and want it drawn consistently, every day, without manually marking up the chart —
plus a ready-made analytics log to review or build on.
## Notes for the listing
- Requires MetaTrader 5.
- Works on any symbol/timeframe; the session-cycle boxes are time-based and chart
timeframe only affects which boxes are visible at once.
- No trades are placed — this is a visualization/analytics utility.
- SQLite database file (`SessionHistory.sqlite`) is created automatically in the
terminal's sandboxed `MQL5\Files` folder.