Scalping Simple Pro
- Indicatori
- Versione: 1.0
- Attivazioni: 20

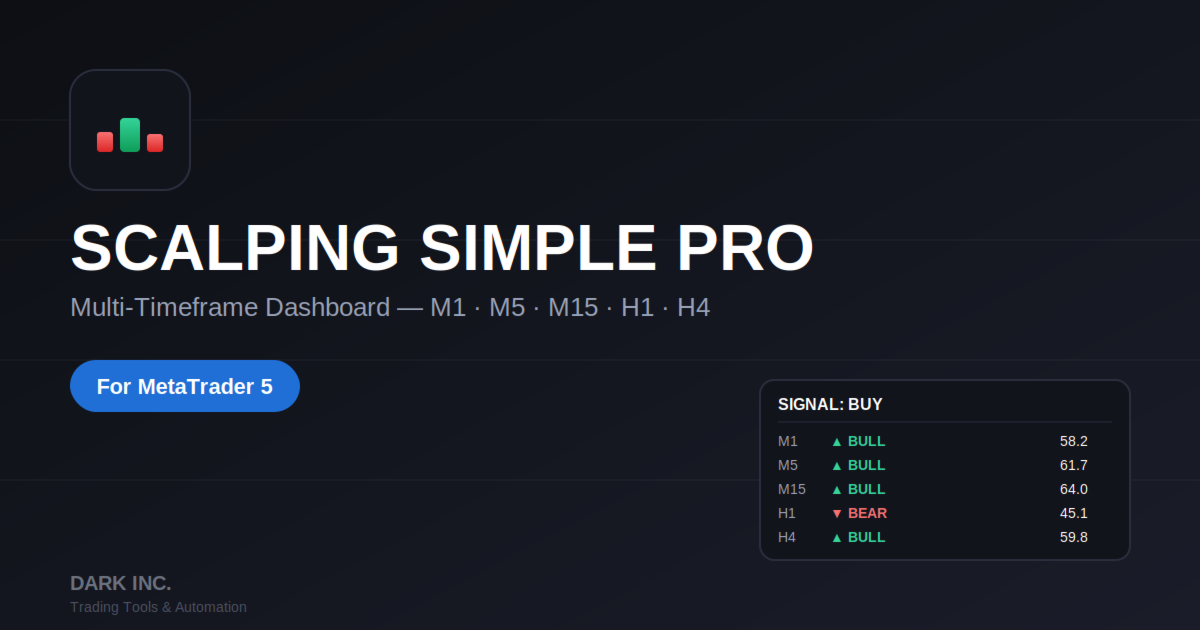
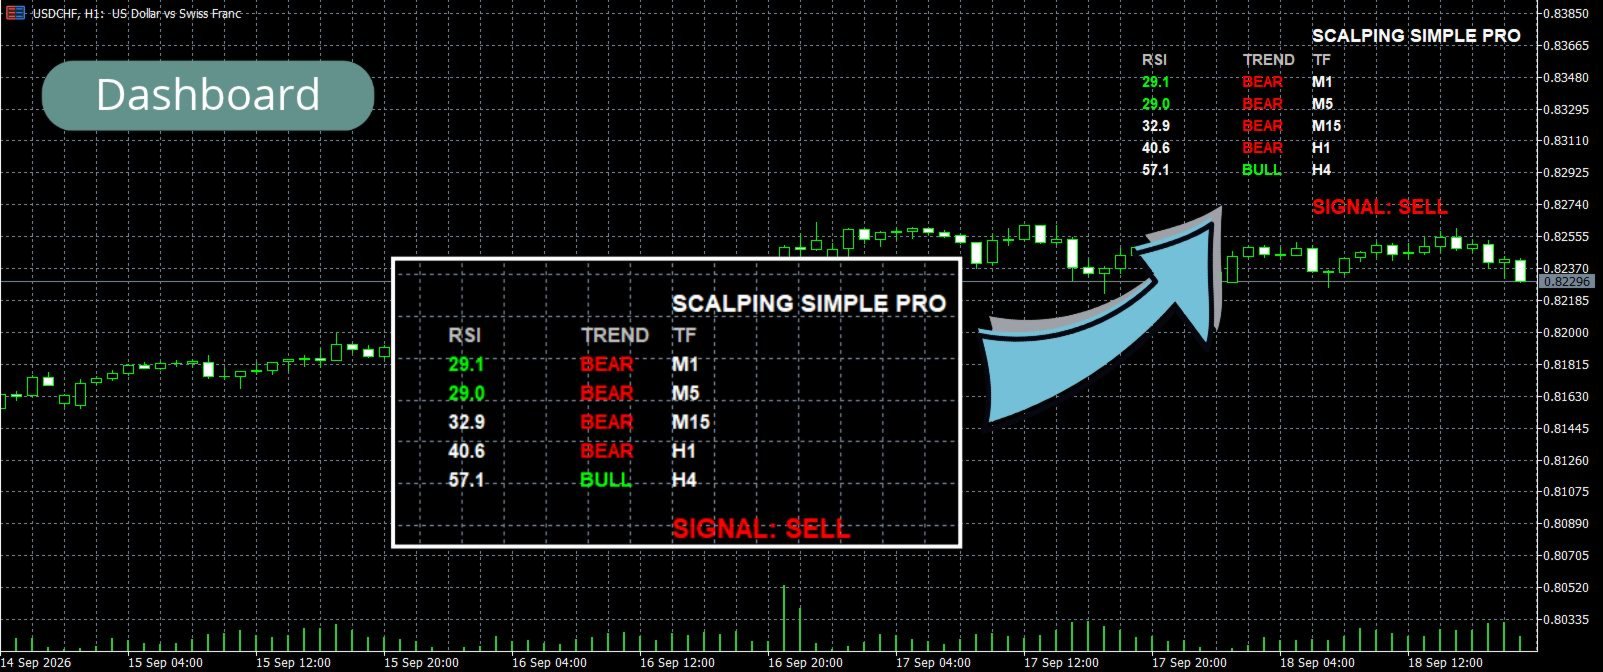
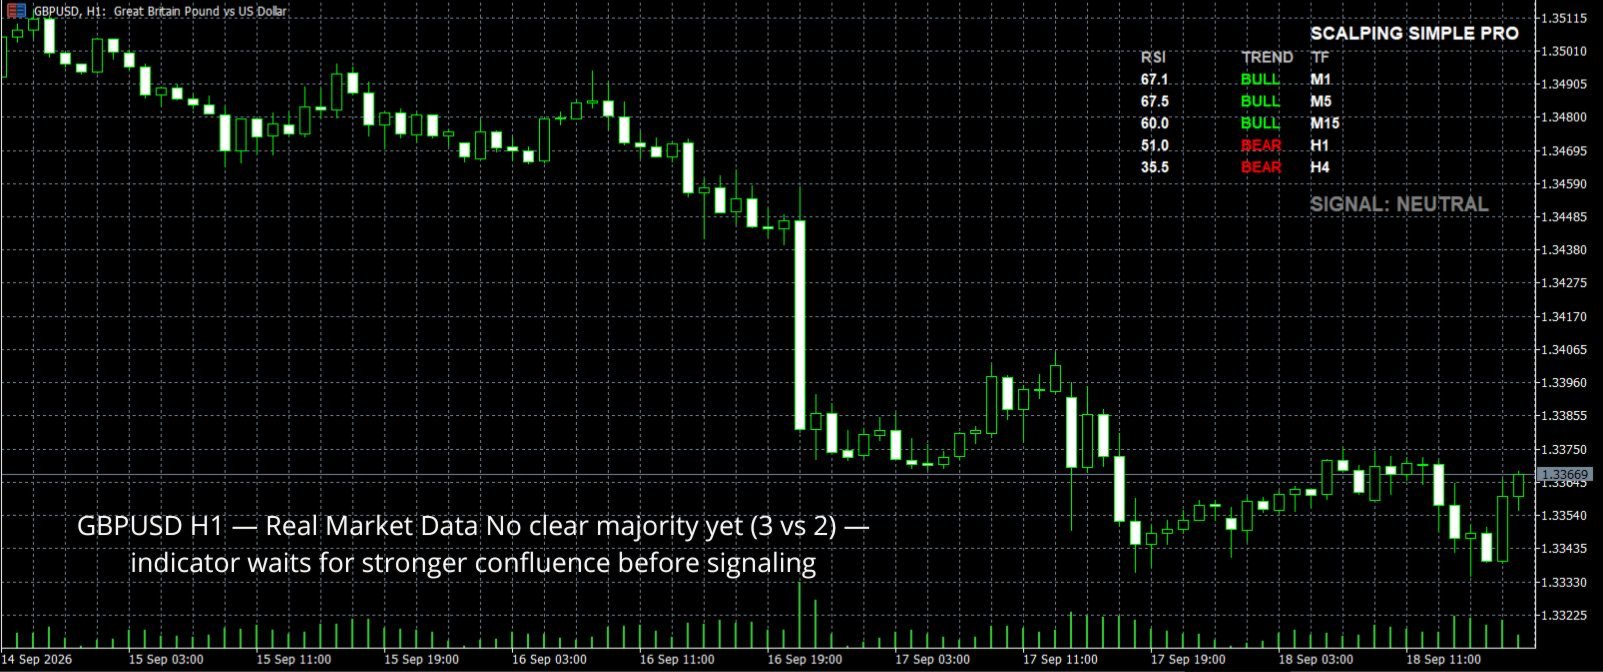
Scalping Simple Pro is a multi-timeframe dashboard indicator that lets you check trend and momentum alignment across 5 timeframes (M1, M5, M15, H1, H4) without switching charts. Instead of manually checking each timeframe one by one, the indicator scans all of them for you and displays the result in a single, easy-to-read panel — with an automatic BUY/SELL confluence signal when the majority of timeframes align.
It is designed for scalpers and short-term traders who rely on multi-timeframe confirmation before entering a trade, on Forex, Gold (XAUUSD), Indices, and Crypto pairs.
━━━━━━━━━━━━━━━━━━━━━
ADVANTAGES
━━━━━━━━━━━━━━━━━━━━━
• Monitors 5 timeframes simultaneously (M1, M5, M15, H1, H4) in one on-chart dashboard
• Trend detection based on EMA Fast vs EMA Slow crossover, per timeframe
• RSI value displayed per timeframe with overbought/oversold color coding
• Automatic confluence signal (BUY/SELL) when a configurable minimum number of timeframes align
• Visual arrow markers on the chart when a new signal forms
• Fully adjustable: EMA periods, RSI period/levels, minimum timeframe threshold, dashboard position, font size
• Lightweight — does not slow down the chart or terminal
• Works on any symbol and any account type
━━━━━━━━━━━━━━━━━━━━━
HOW IT WORKS
━━━━━━━━━━━━━━━━━━━━━
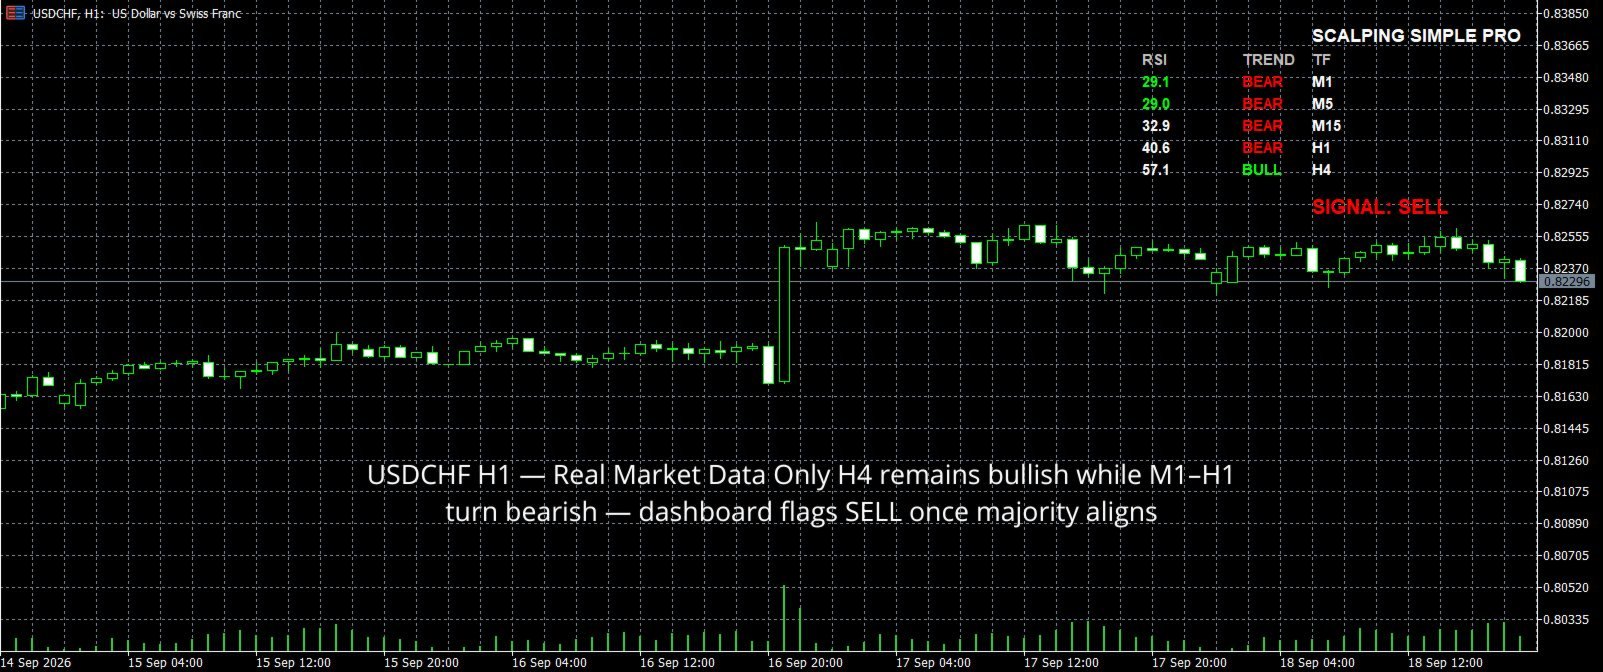
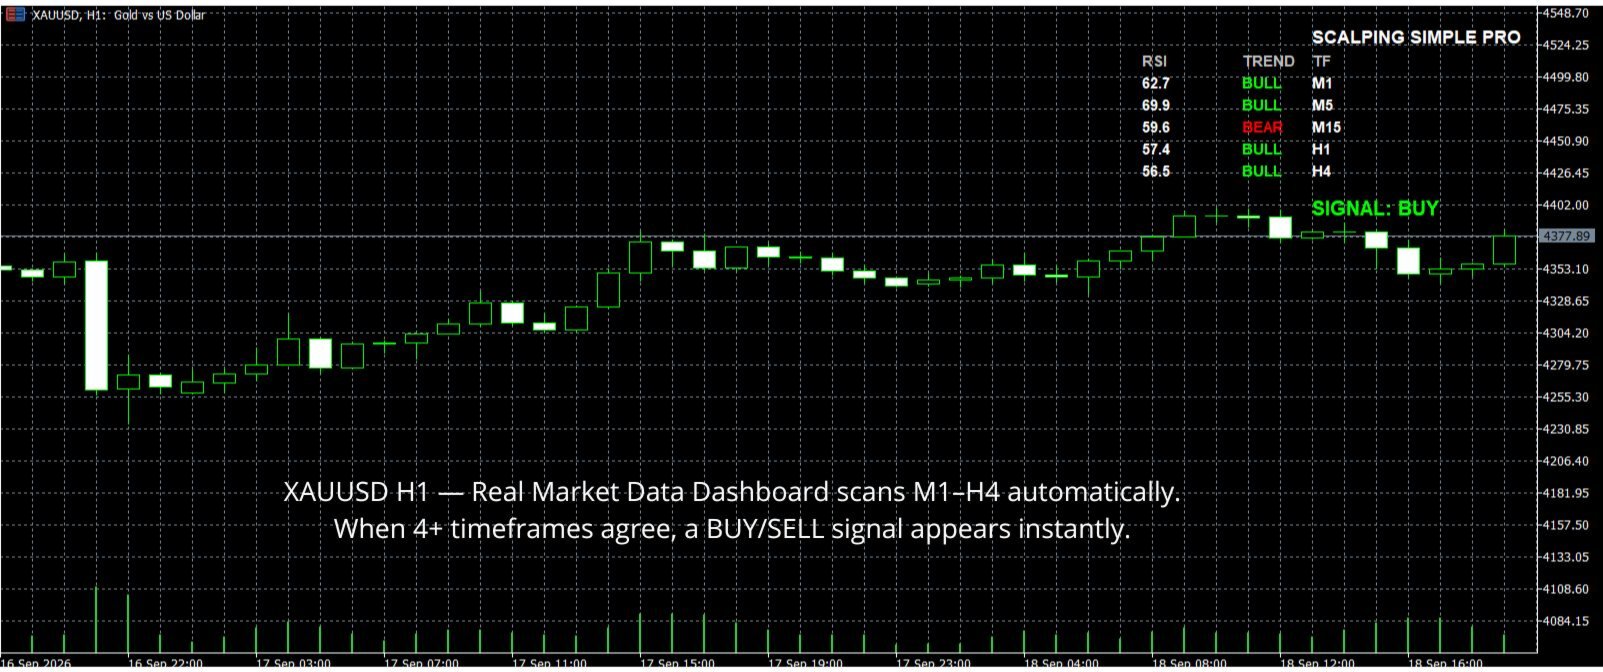
For each of the 5 timeframes, the indicator compares EMA Fast against EMA Slow to determine the trend (Bullish/Bearish/Flat) and calculates RSI to gauge momentum. When at least 4 timeframes are bullish, a BUY signal is displayed. When at least 4 timeframes are bearish, a SELL signal is displayed. Both thresholds are adjustable in the input settings. All values update live on every new tick.
━━━━━━━━━━━━━━━━━━━━━
INPUT PARAMETERS
━━━━━━━━━━━━━━━━━━━━━
Dashboard Settings
• Show Dashboard — enable/disable the on-chart panel
• Dashboard Corner — panel position on the chart
• Font Size — text size of the dashboard
Signal Settings
• EMA Fast / EMA Slow — moving average periods used for trend detection
• RSI Period — RSI calculation period
• RSI Overbought / RSI Oversold — RSI threshold levels
• Min Bullish TF for BUY — minimum number of bullish timeframes required to trigger a BUY signal
• Min Bearish TF for SELL — minimum number of bearish timeframes required to trigger a SELL signal
━━━━━━━━━━━━━━━━━━━━━
RECOMMENDATIONS
━━━━━━━━━━━━━━━━━━━━━
• Best used as a confirmation tool alongside your own entry strategy, not as a standalone auto-trading system
• Test on a demo account first to find the EMA/RSI settings that fit your trading style and instrument
• Works well combined with support/resistance or price action for entry timing
━━━━━━━━━━━━━━━━━━━━━
DISCLAIMER
━━━━━━━━━━━━━━━━━━━━━
This indicator is a technical analysis tool and does not guarantee profit. Always use proper risk management. Past performance shown in screenshots does not guarantee future results.
Developed by Dark Inc. — Trading Tools & Automation.