Volume Structure MT4
- Indicatori
- Part-time Day Trader
- Versione: 1.0
- Attivazioni: 15
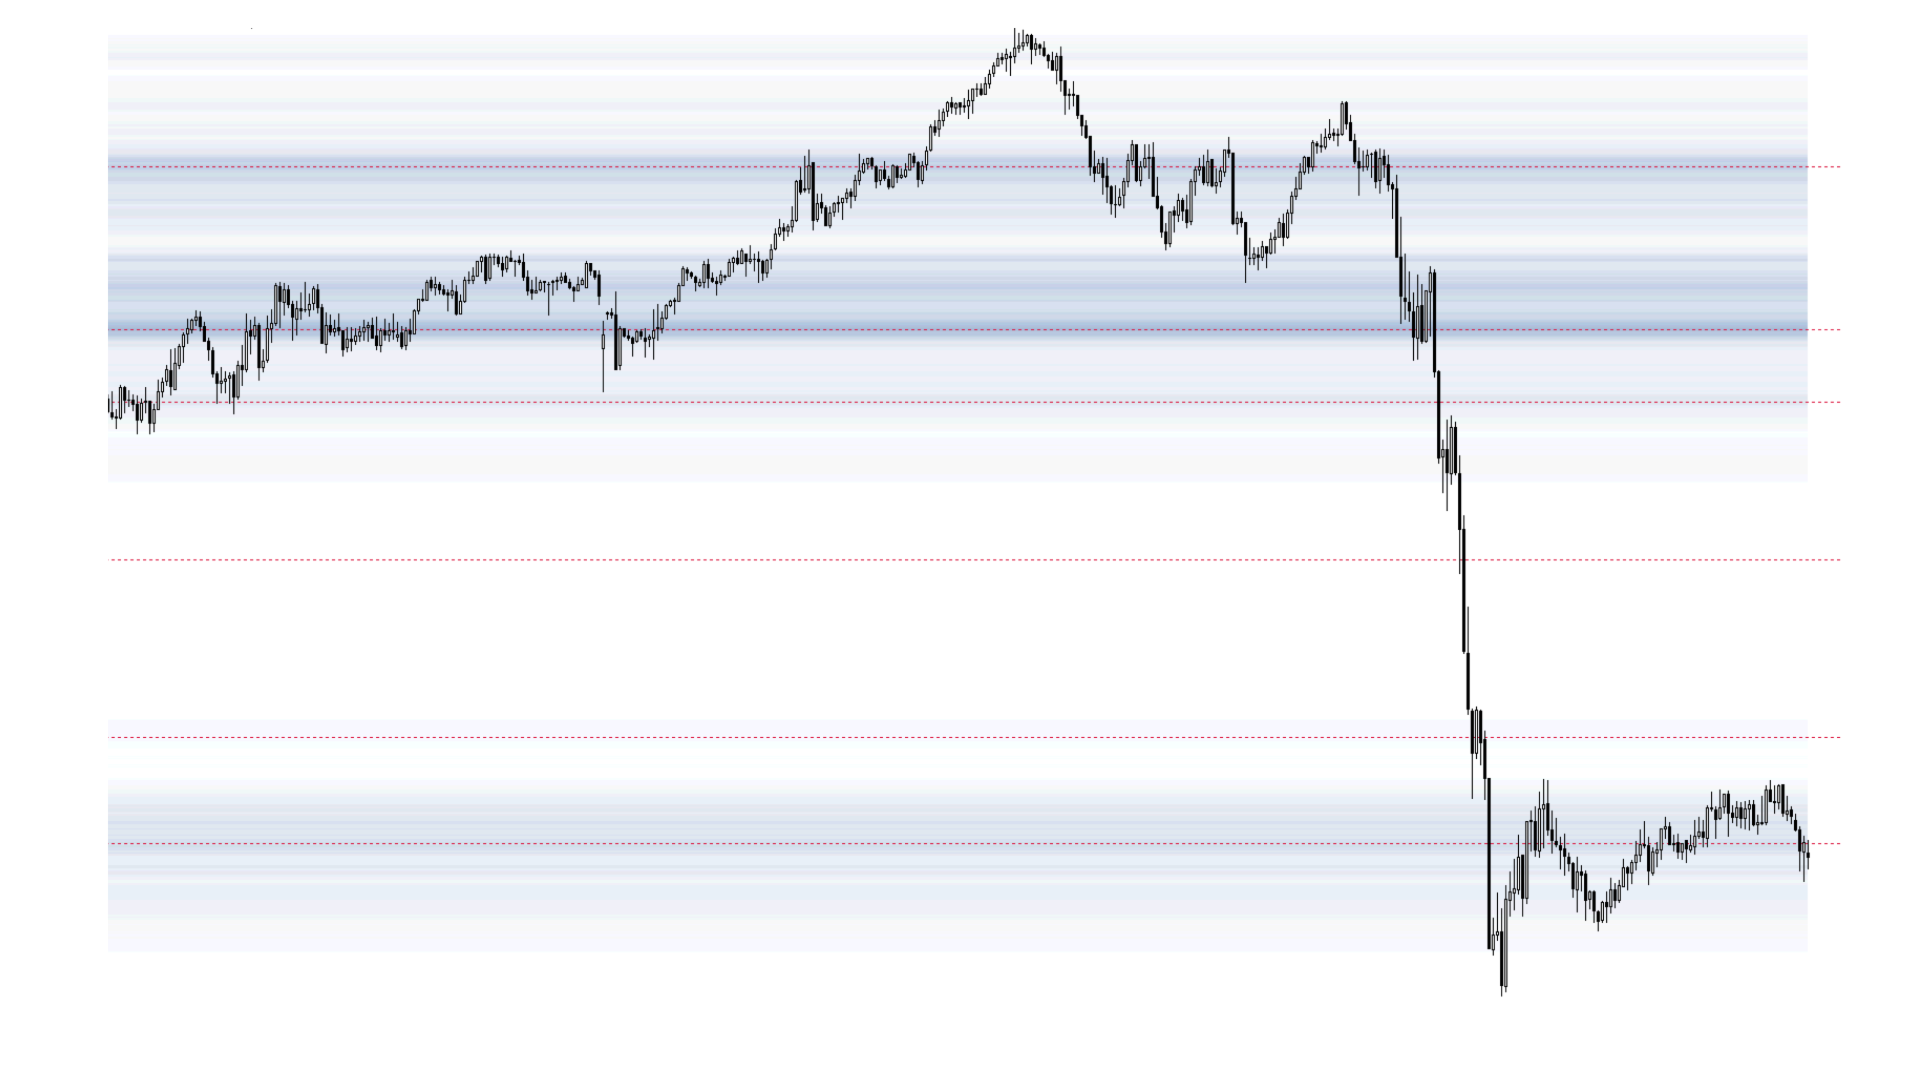
Volume Structure turns the Visible Range Volume Profile into a full support and resistance heatmap overlay across the chart.
It highlights volume peaks as key price levels, making the next structure to trade from or towards easy to spot.
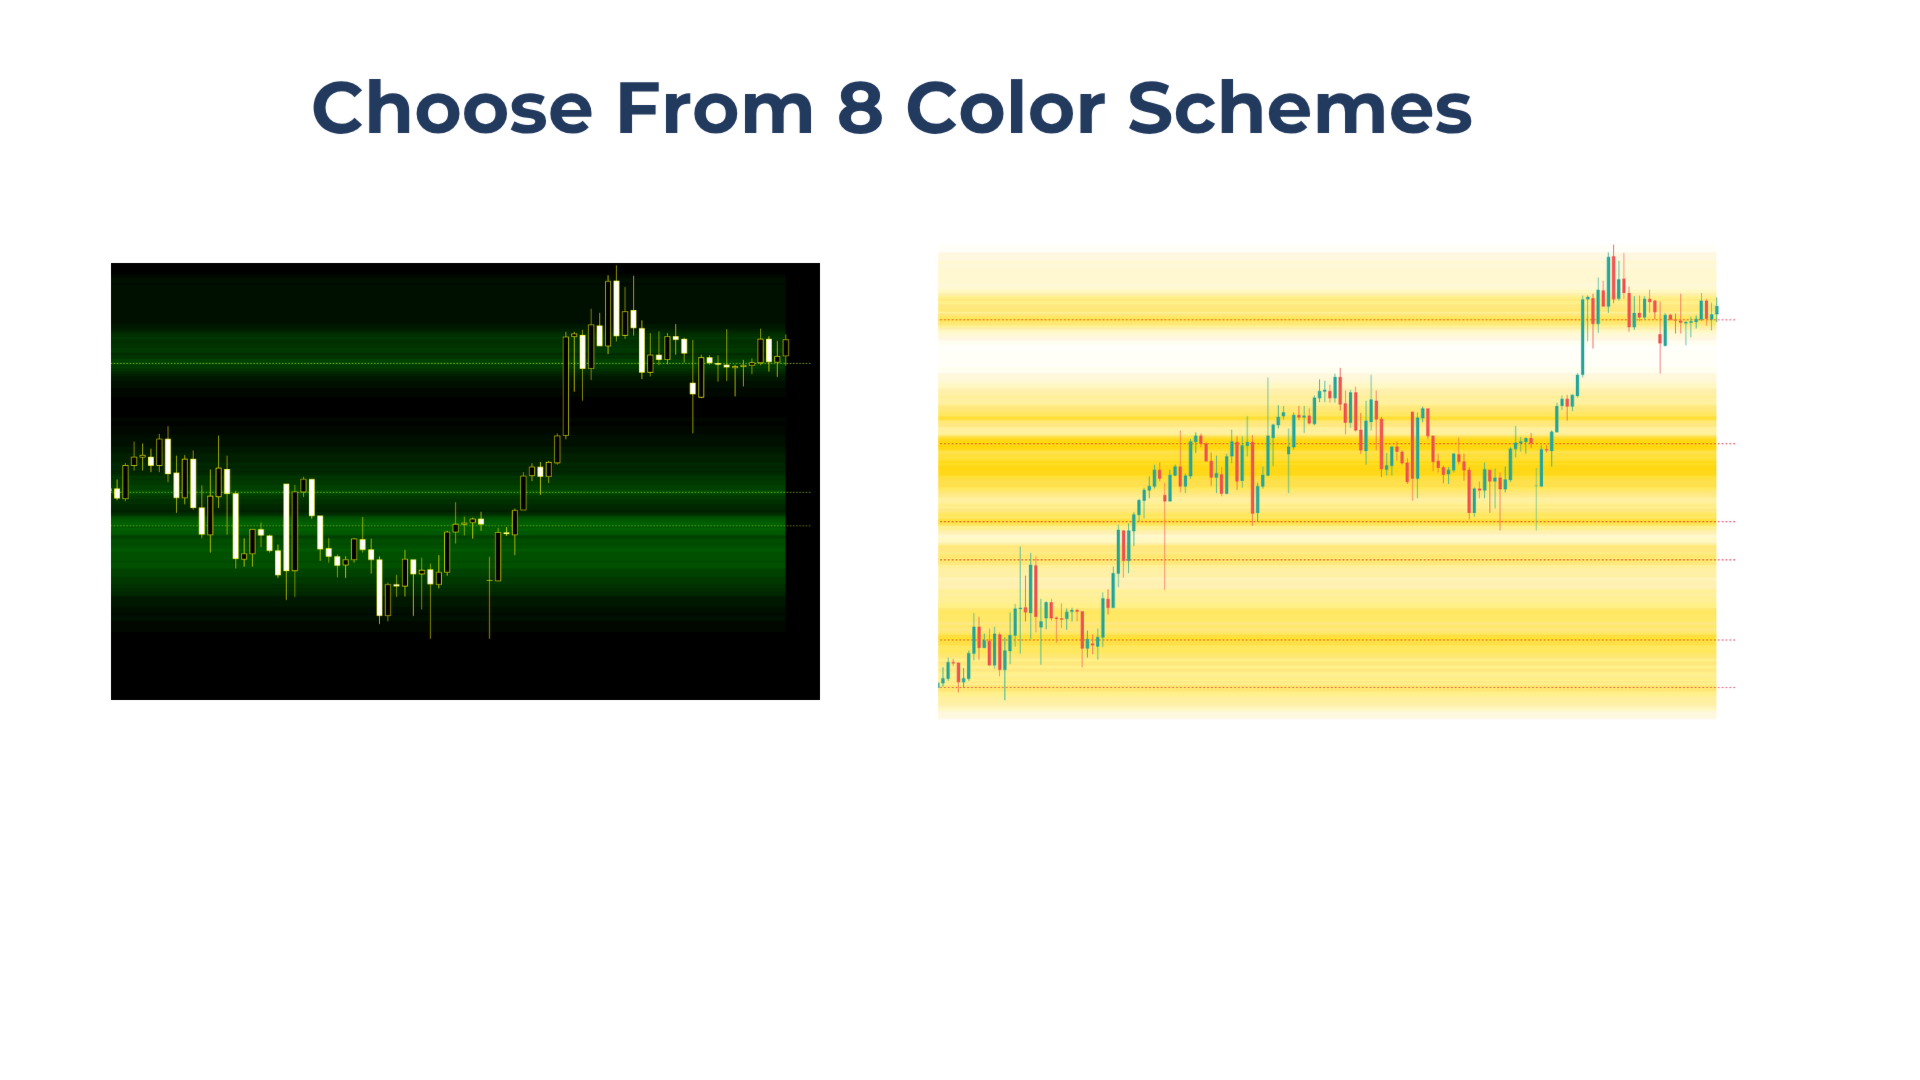
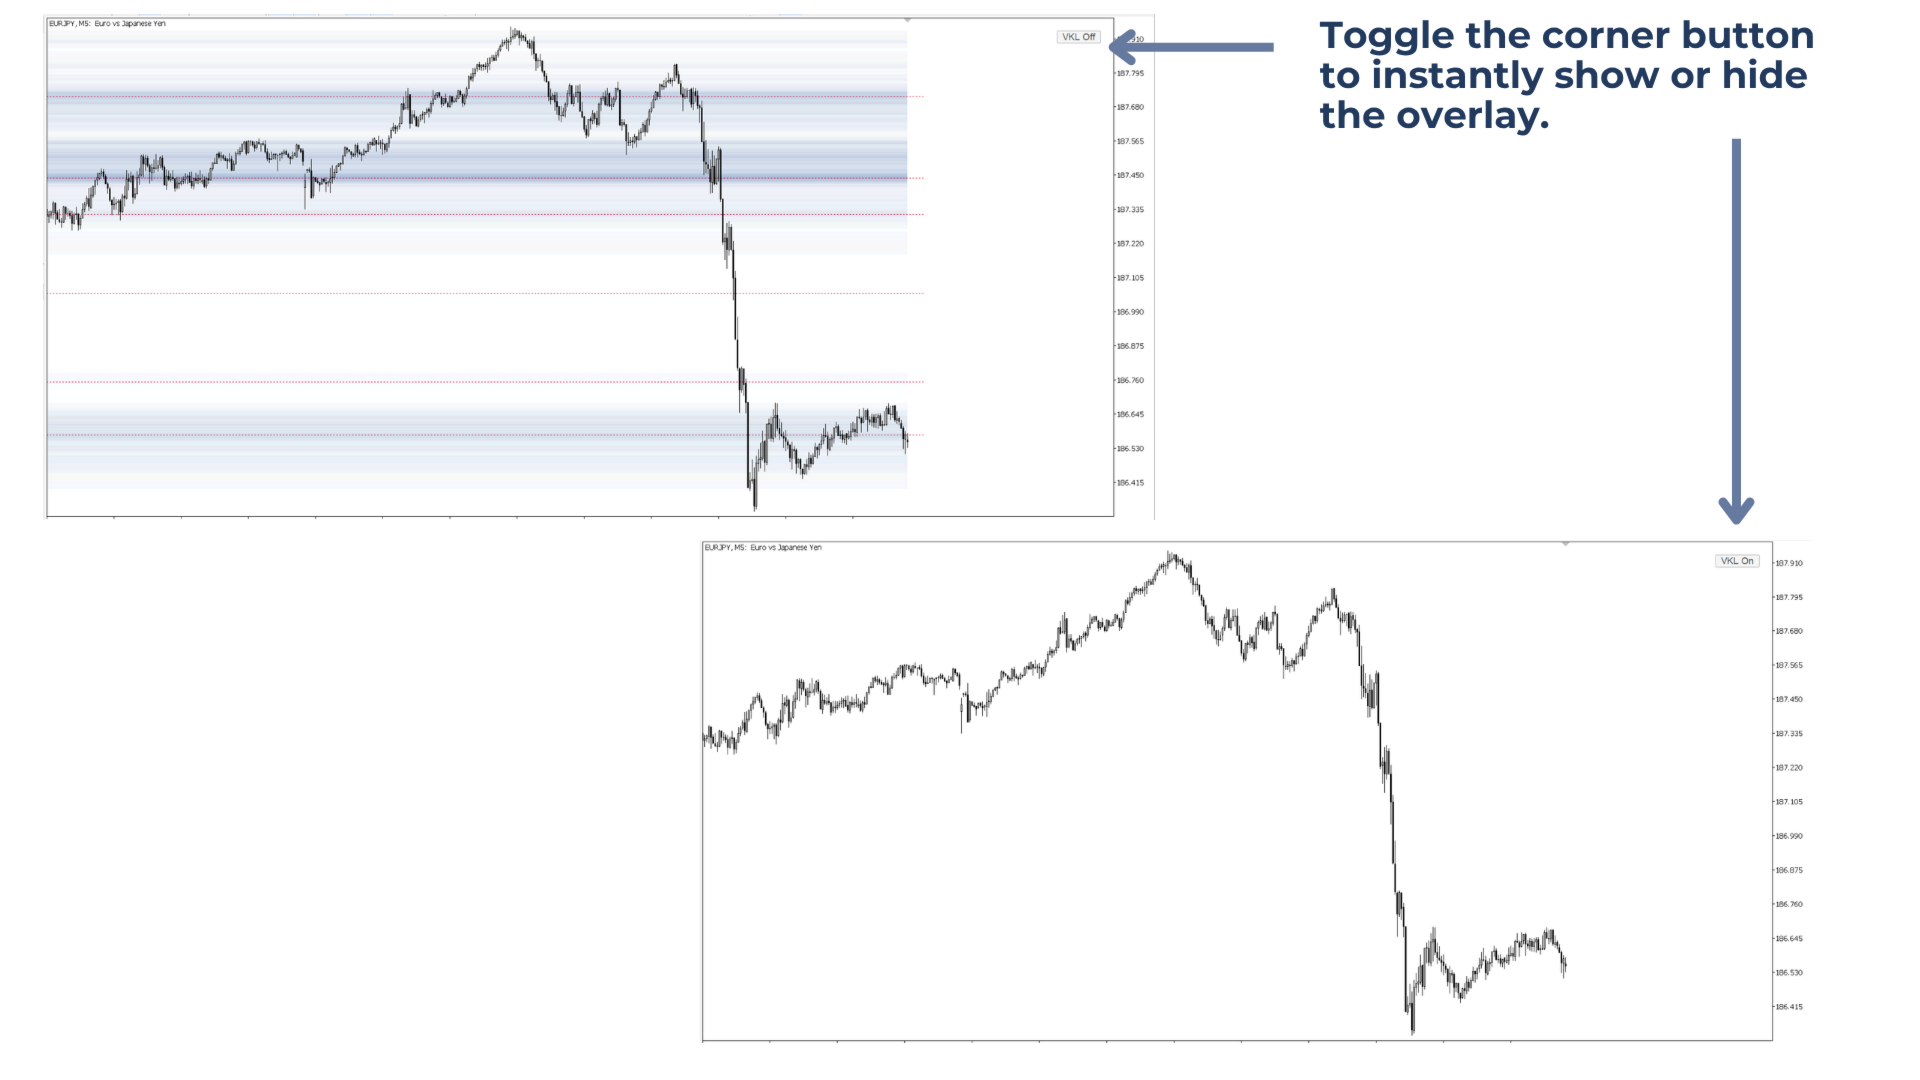
The overlay can be shown or hidden instantly using the corner button on the chart. It includes 8 color schemes.
Built for traders who focus on:
Market reversals at key zones
Volume Profile levels
Support and resistance
Supply and demand zones
What Does Volume Structure Do?
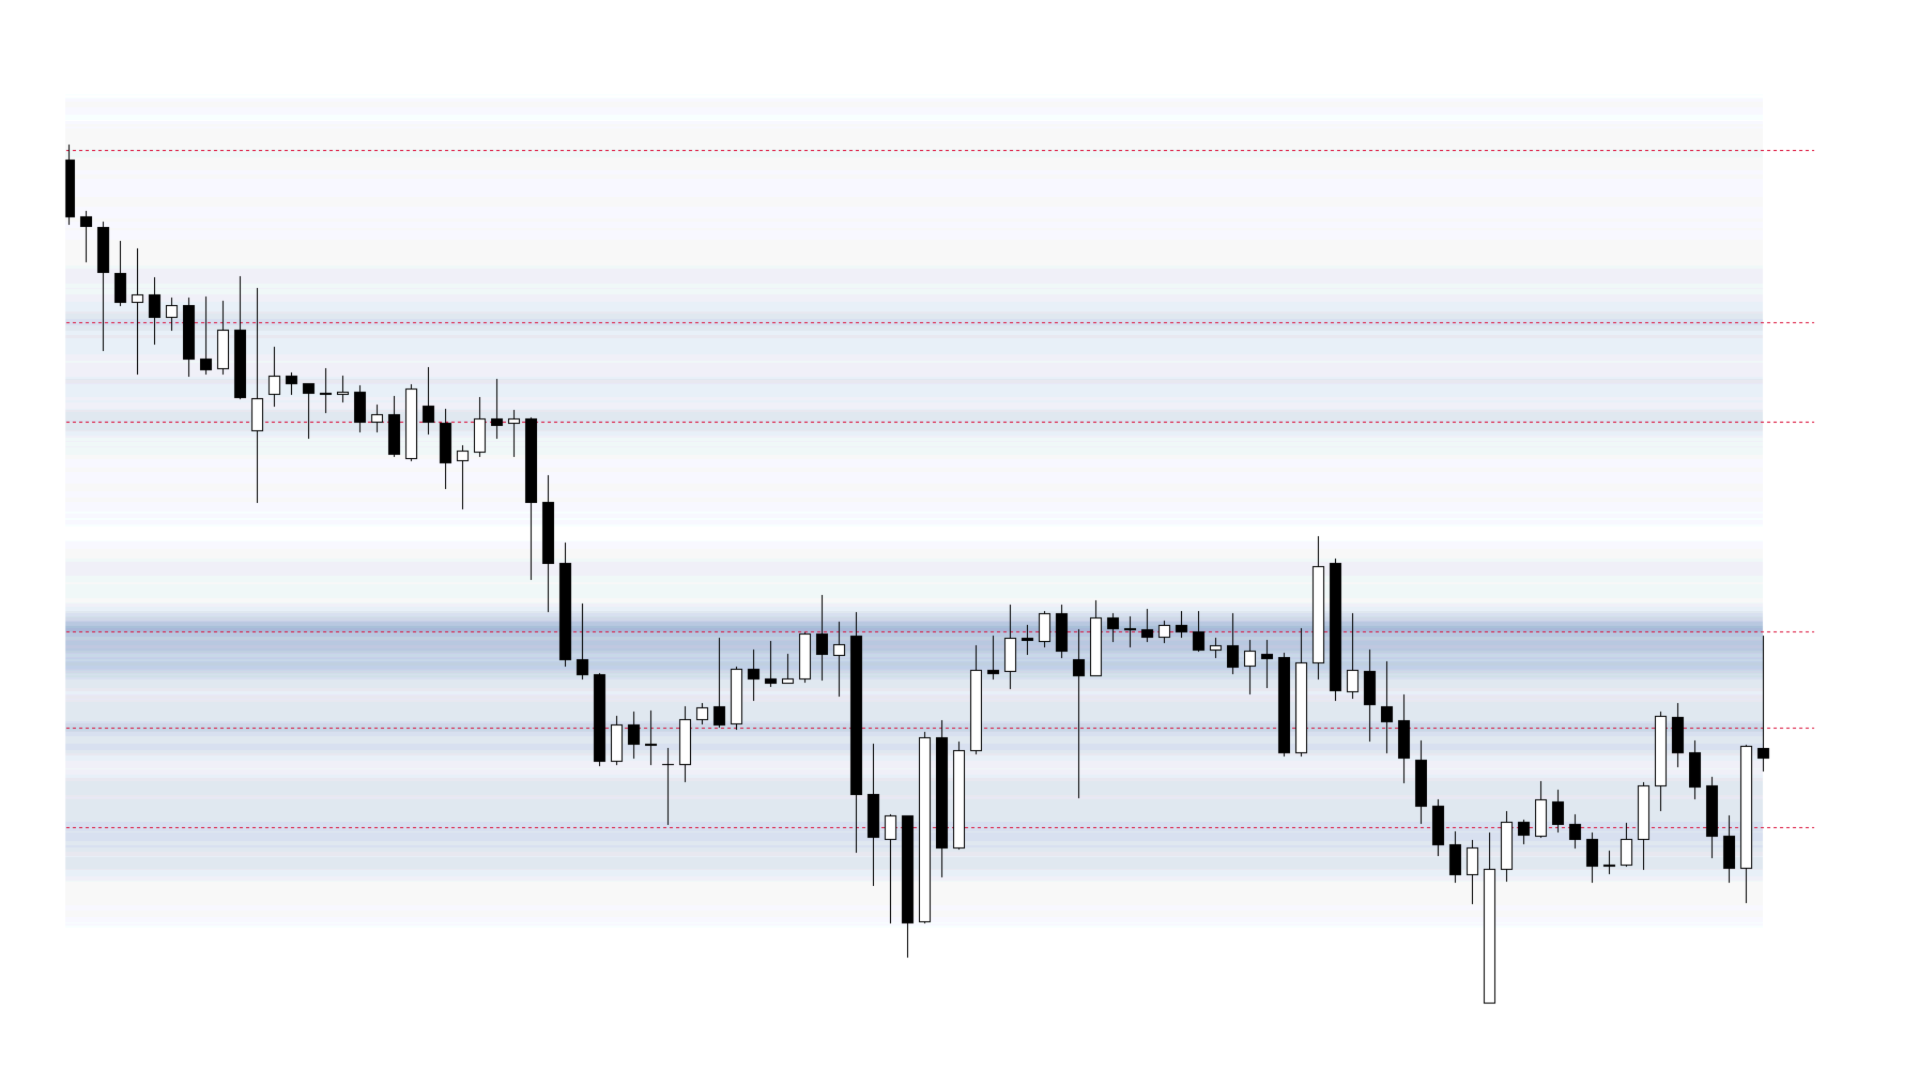
Volume Structure displays a chart-wide heatmap of volume zones and marks key levels at major volume peaks.
With one click on the corner button, the overlay can be shown or hidden whenever needed.
Key benefits
- Makes key support and resistance areas easy to spot for faster and more consistent trade planning.
- Uses the visible chart range, so the level of structural detail can be adjusted directly by zooming in or out.
- Keeps the chart clean by showing or hiding the overlay with one click.
Main features of Volume Structure
Lightweight performance: Updates only when needed, to keep CPU usage low and chart performance smooth.
8 Color schemes: Choose from 8 profile colors to better match different candle colors and zone saturation preferences.
Works on all symbols and timeframes: Can be used across all symbols in Market Watch and on any timeframe.
Flexible button placement: The on/off button can be placed in any of the four chart corners.
How to use Volume Structure
1. Attach the indicator to the chart.
2. Use the corner button to switch the heatmap overlay on or off.
3. Zoom in or out to adjust the visible range. The zones and levels update instantly to the new chart scale.
4. The tool updates automatically with each new candle.
Tip: The indicator uses the candles currently visible on the chart. Zoom in to focus on recent price action and see more detailed local support and resistance zones. Zoom out to see the bigger support and resistance structure across the wider chart.
Limitations
The tool is not supported in the Strategy Tester.