Market Noise MT4
- Indicatori
- Ivan Butko
- Versione: 1.2
- Aggiornato: 29 maggio 2024
- Attivazioni: 10
Market Noise
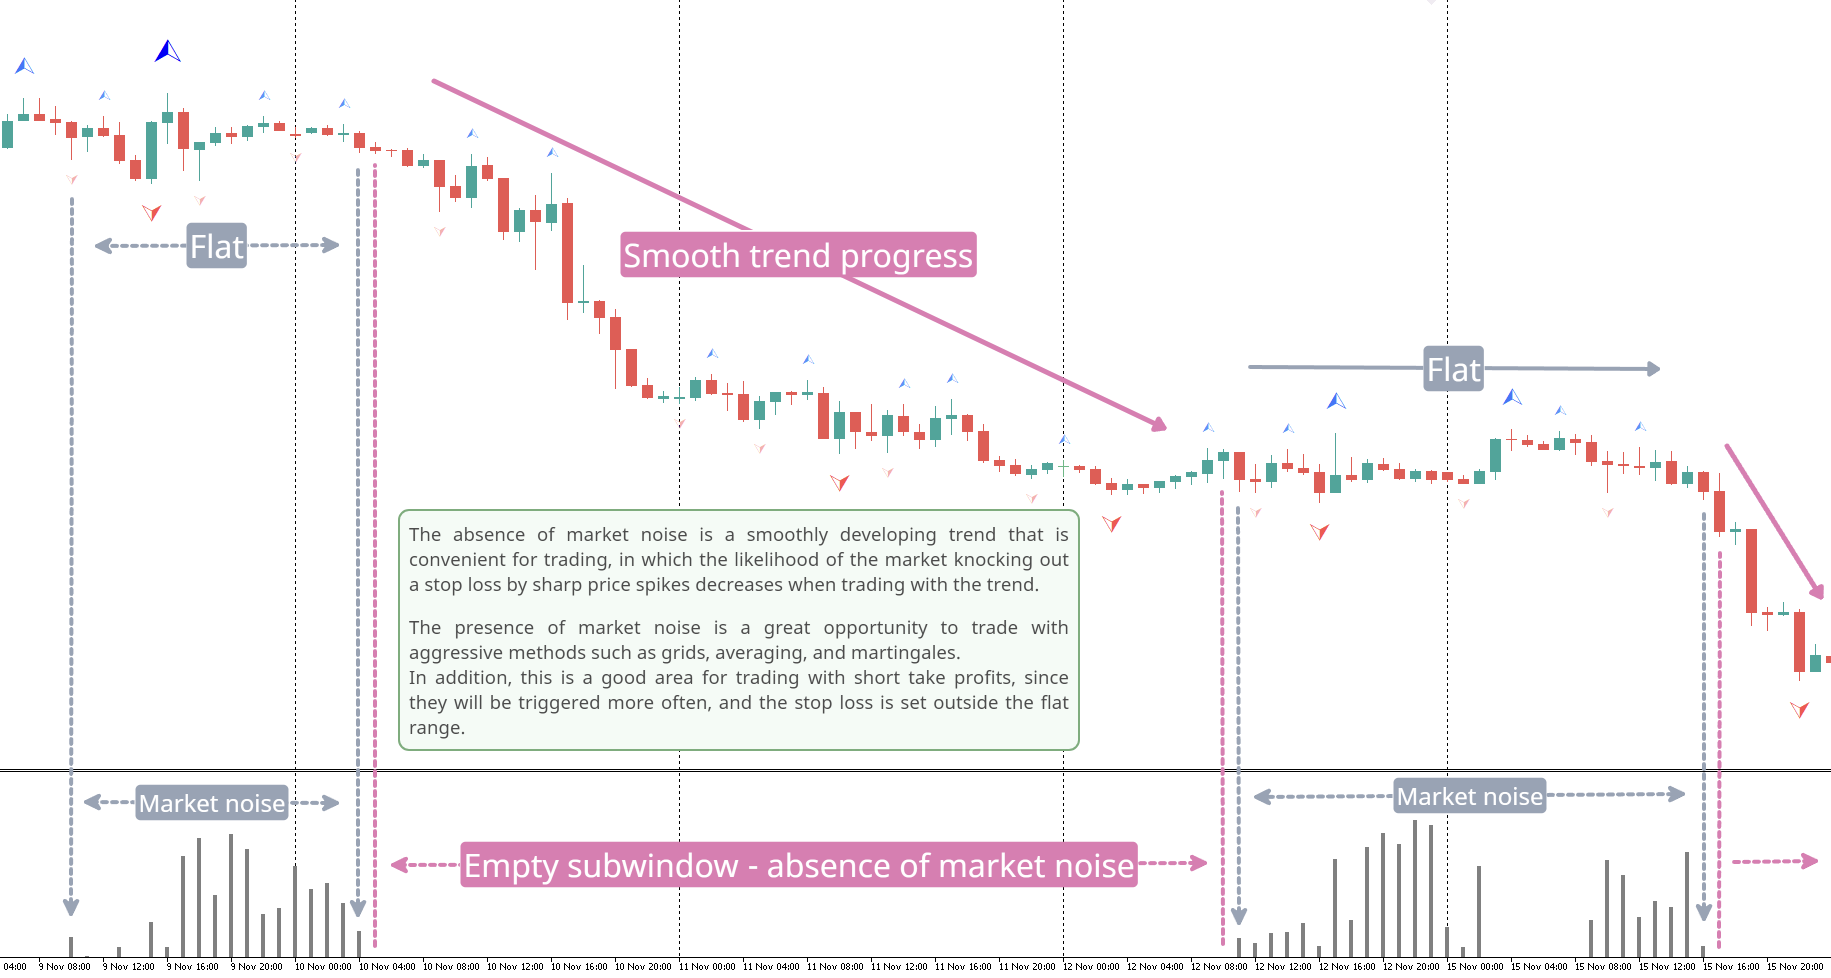
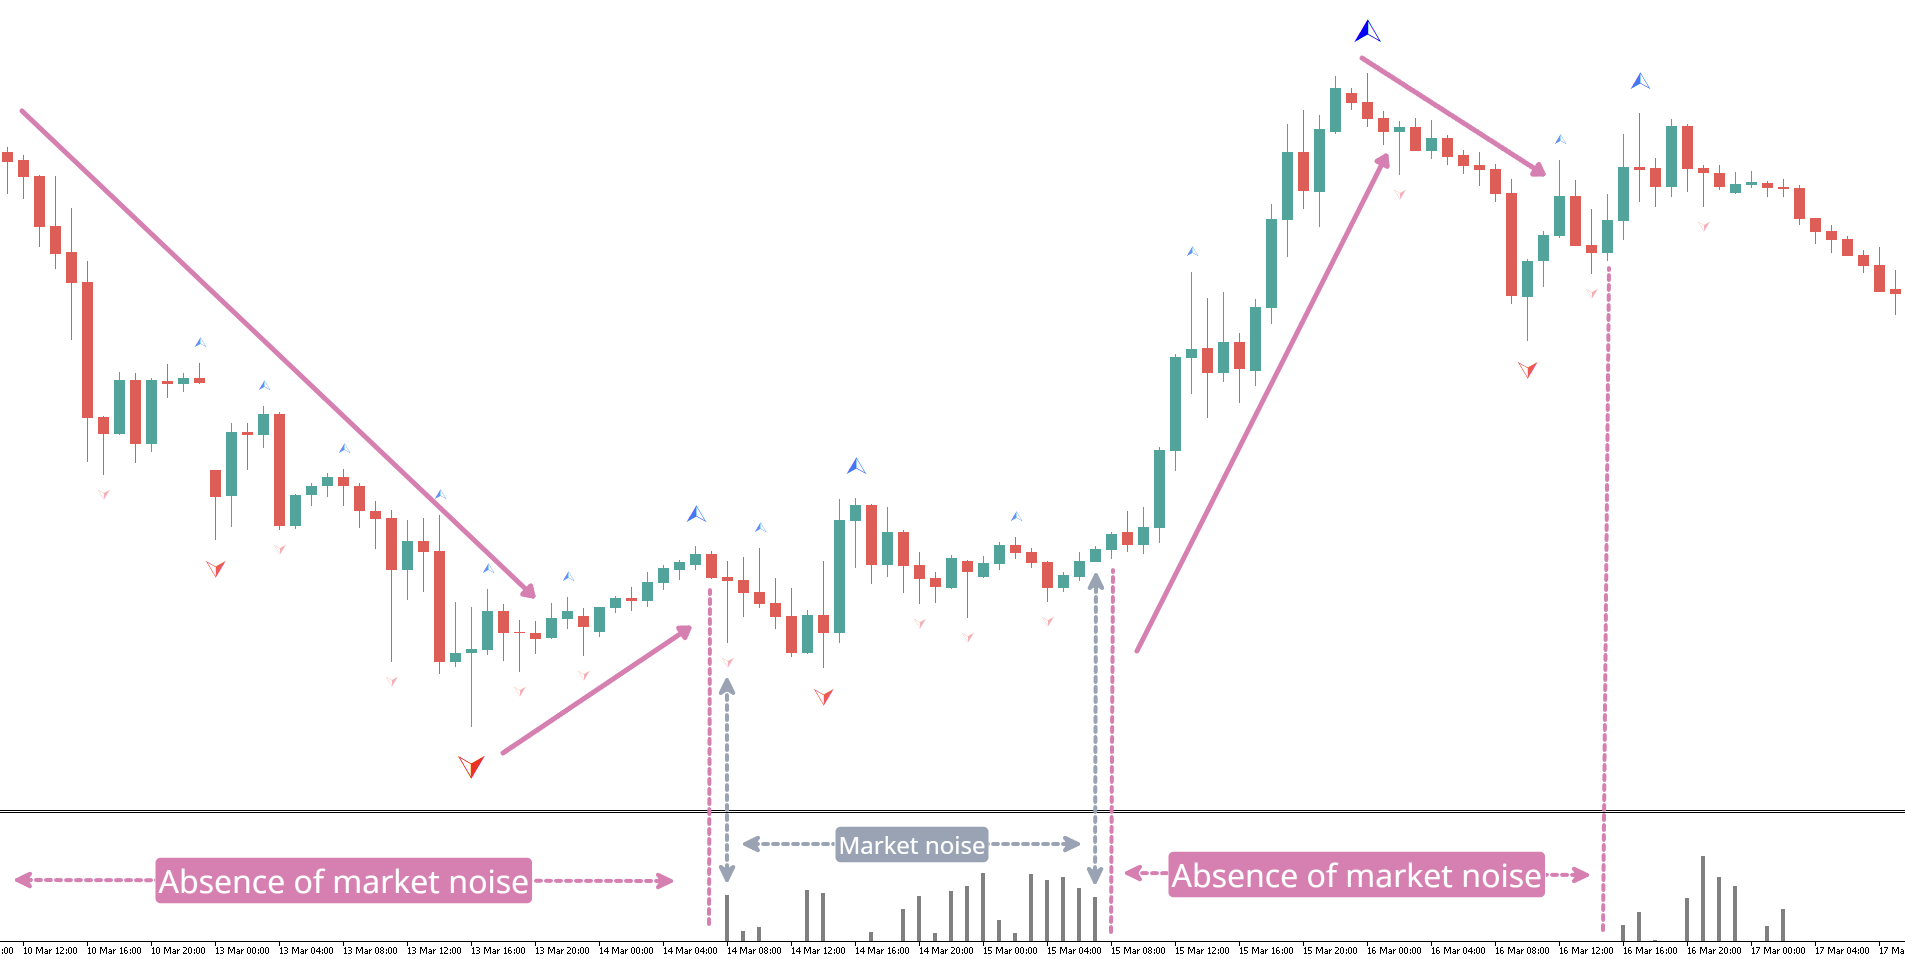
Il rumore del mercato è un indicatore che determina le fasi del mercato su un grafico dei prezzi e distingue anche i movimenti di tendenza chiari e fluidi dai movimenti piatti e rumorosi quando si verifica una fase di accumulazione o distribuzione.
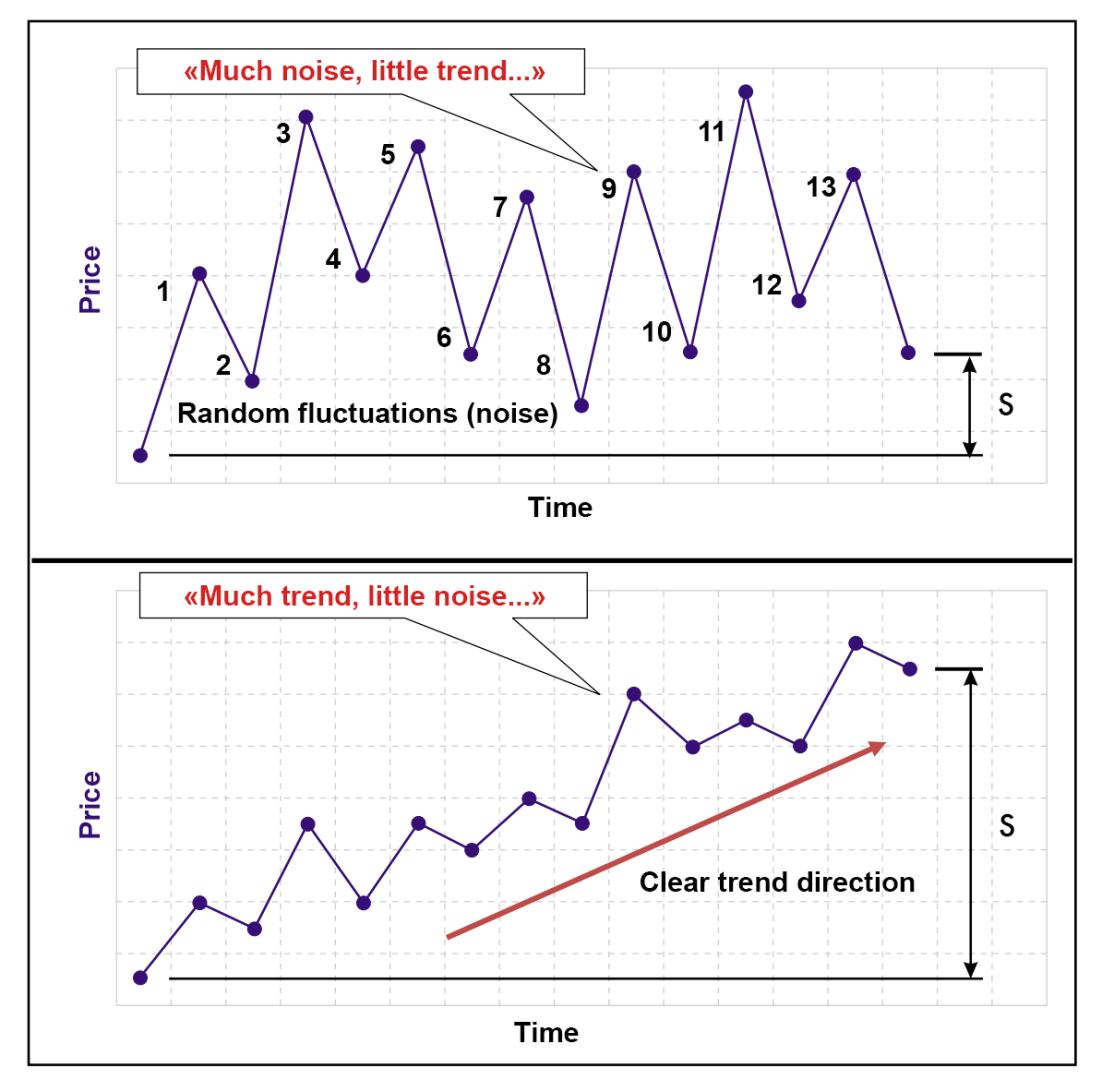
Ogni fase è adatta al proprio tipo di trading: trend per i sistemi trend-following e flat per quelli aggressivi. Quando inizia il rumore del mercato, puoi decidere di uscire dalle operazioni. Allo stesso modo, e viceversa, non appena il rumore finisce, è necessario disattivare i sistemi di trading aggressivi. Qualcuno può negoziare entrambi i tipi di strategie di trading, passando dall'una all'altra. Pertanto, questo indicatore svolge il ruolo di un buon assistente nel campo delle decisioni commerciali. Qualsiasi movimento dei prezzi può essere suddiviso in due componenti: il movimento generale dei prezzi per un periodo di tempo selezionato e il rumore sotto forma di fluttuazioni dei prezzi all'interno di questo periodo. Allo stesso tempo, mercati diversi in periodi di tempo diversi possono dimostrare un’ampia gamma di relazioni reciproche tra le componenti rumore e tendenza (Fig. 1). Maggiore è il livello di rumore nei movimenti dei prezzi, più difficile sarà discernere la direzione e la forza del trend sottostante. Pertanto in questo caso è necessario utilizzare metodi di identificazione del trend più lenti. D'altra parte, nei mercati con bassi livelli di rumore, la tendenza principale viene determinata abbastanza facilmente e sono ragionevoli metodi più rapidi per determinare le tendenze, garantendo un ritardo minimo dei segnali di trading dai cambiamenti nella direzione dei prezzi. Per determinare lo stato del mercato, viene utilizzato un indice di efficienza avanzato (ER), che si basa su un confronto esponenziale tra il movimento totale dei prezzi e la somma dei movimenti del mercato in un determinato periodo. L'indice di efficienza (ER) può variare da 0 a 1. Il valore ER sarà zero quando nel mercato non c'è movimento direzionale, solo rumore. Il valore ER sarà pari a uno quando il mercato si muove in una direzione, in completa assenza di rumore.
Vantaggi
- Definizione di una tendenza chiara per i sistemi di trading di tendenza
- Determinazione piatta per sistemi aggressivi (griglie, media, martingala, sitting out) o sistemi di trading con SL alto e TP basso
- Poche impostazioni: solo il periodo di calcolo in barre
Utilizza l'indicatore Market Noise come aggiunta al tuo sistema di trading
МТ5 - https://www.mql5.com/ru/market/product/107899
Prova anche gli altri miei prodotti sul mercato https://www.mql5.com/ru/users/capitalplus/seller
Ti auguro grandi profitti nel trading!


Respects for the maker of this indicator: It functions as describes. There is a scenario where if I have too many indicators in the window or act fast, suddenly the data feed slows down or the indicator doesn't show in the subwindow. Overall, the indicator displays in each timeframe, filtering out the neutral side ranging market moments, revealing and leaving open space for trend taking opportunities.