Previous Candle High Low with Alerts
- Indicatori
- Rajesh Kumar Nait
- Versione: 1.0
- Attivazioni: 5
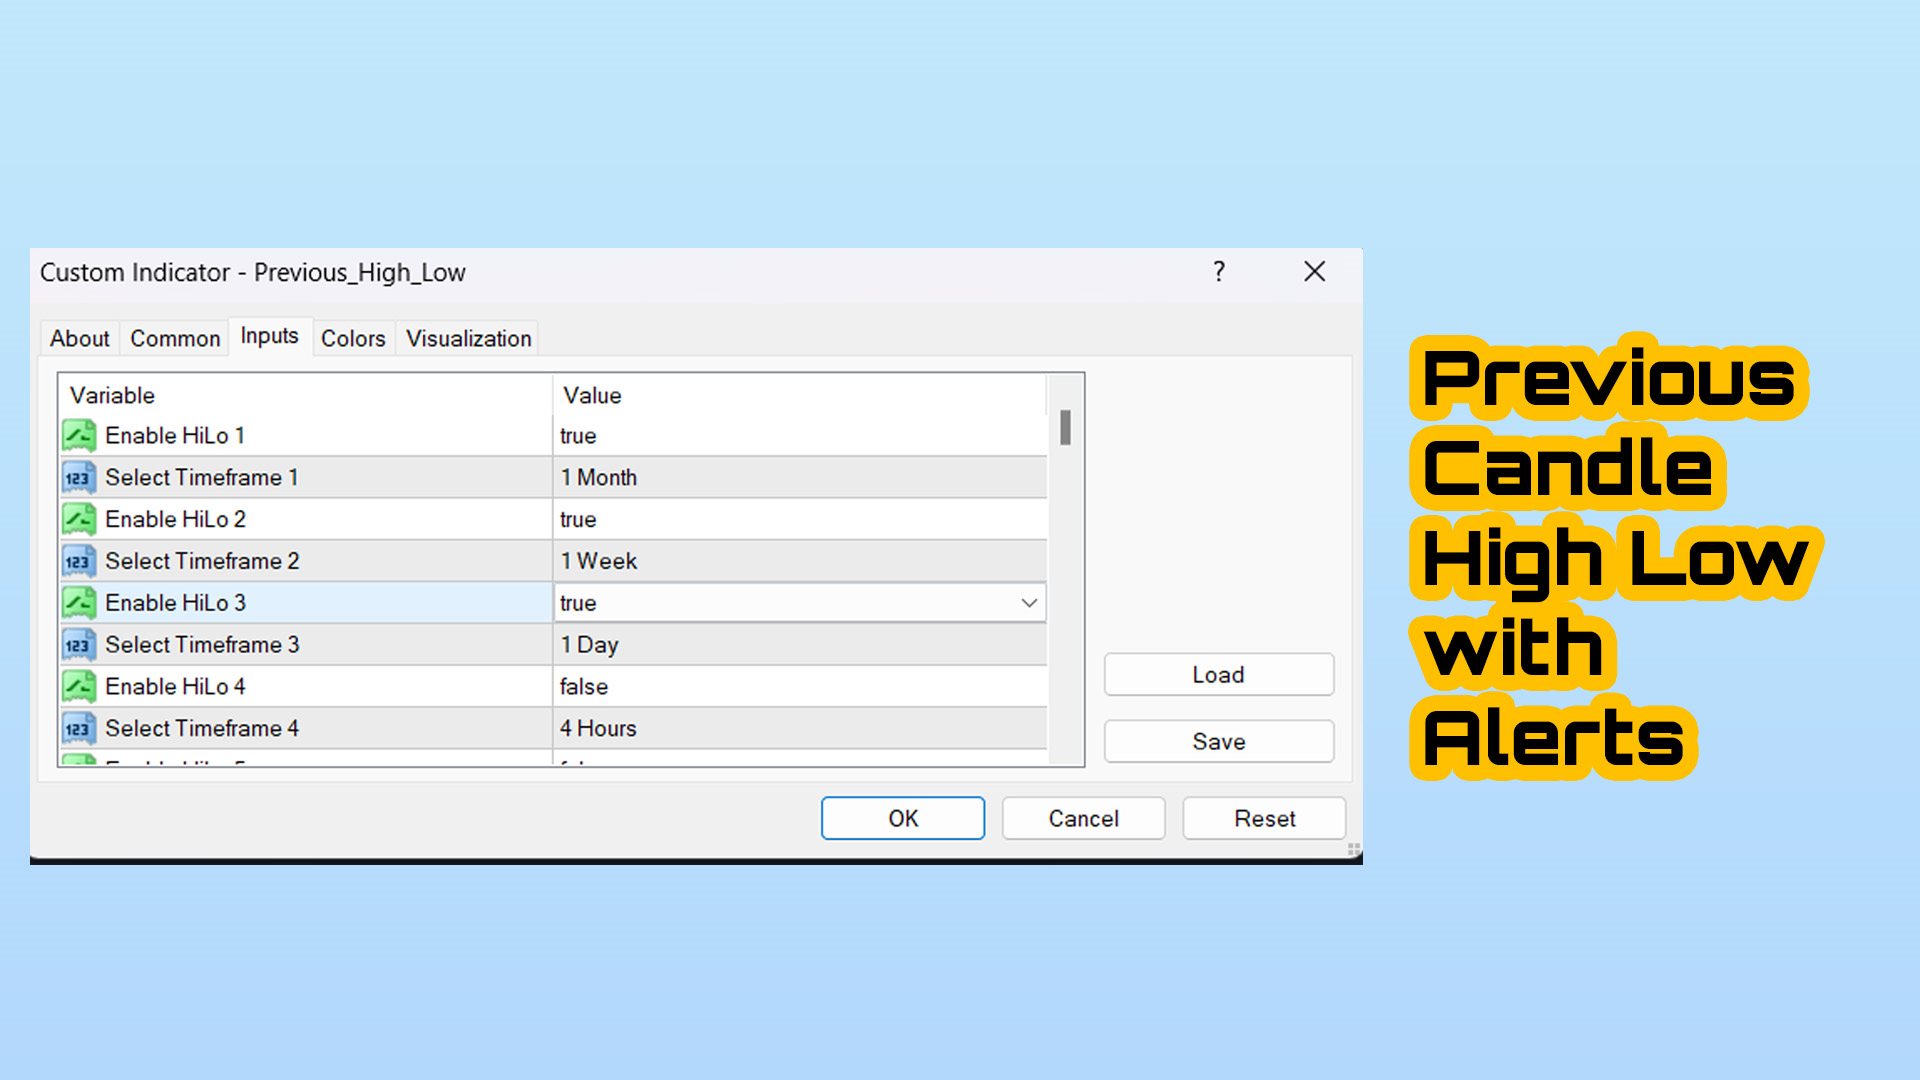
Questo indicatore traccia fino a 6 livelli che possono essere abilitati/disabilitati per rendere il grafico più pulito secondo il requisito del trader
Questi 6 livelli sono in 2 set: Alto e Basso
Per ogni set, è possibile selezionare un periodo di tempo diverso
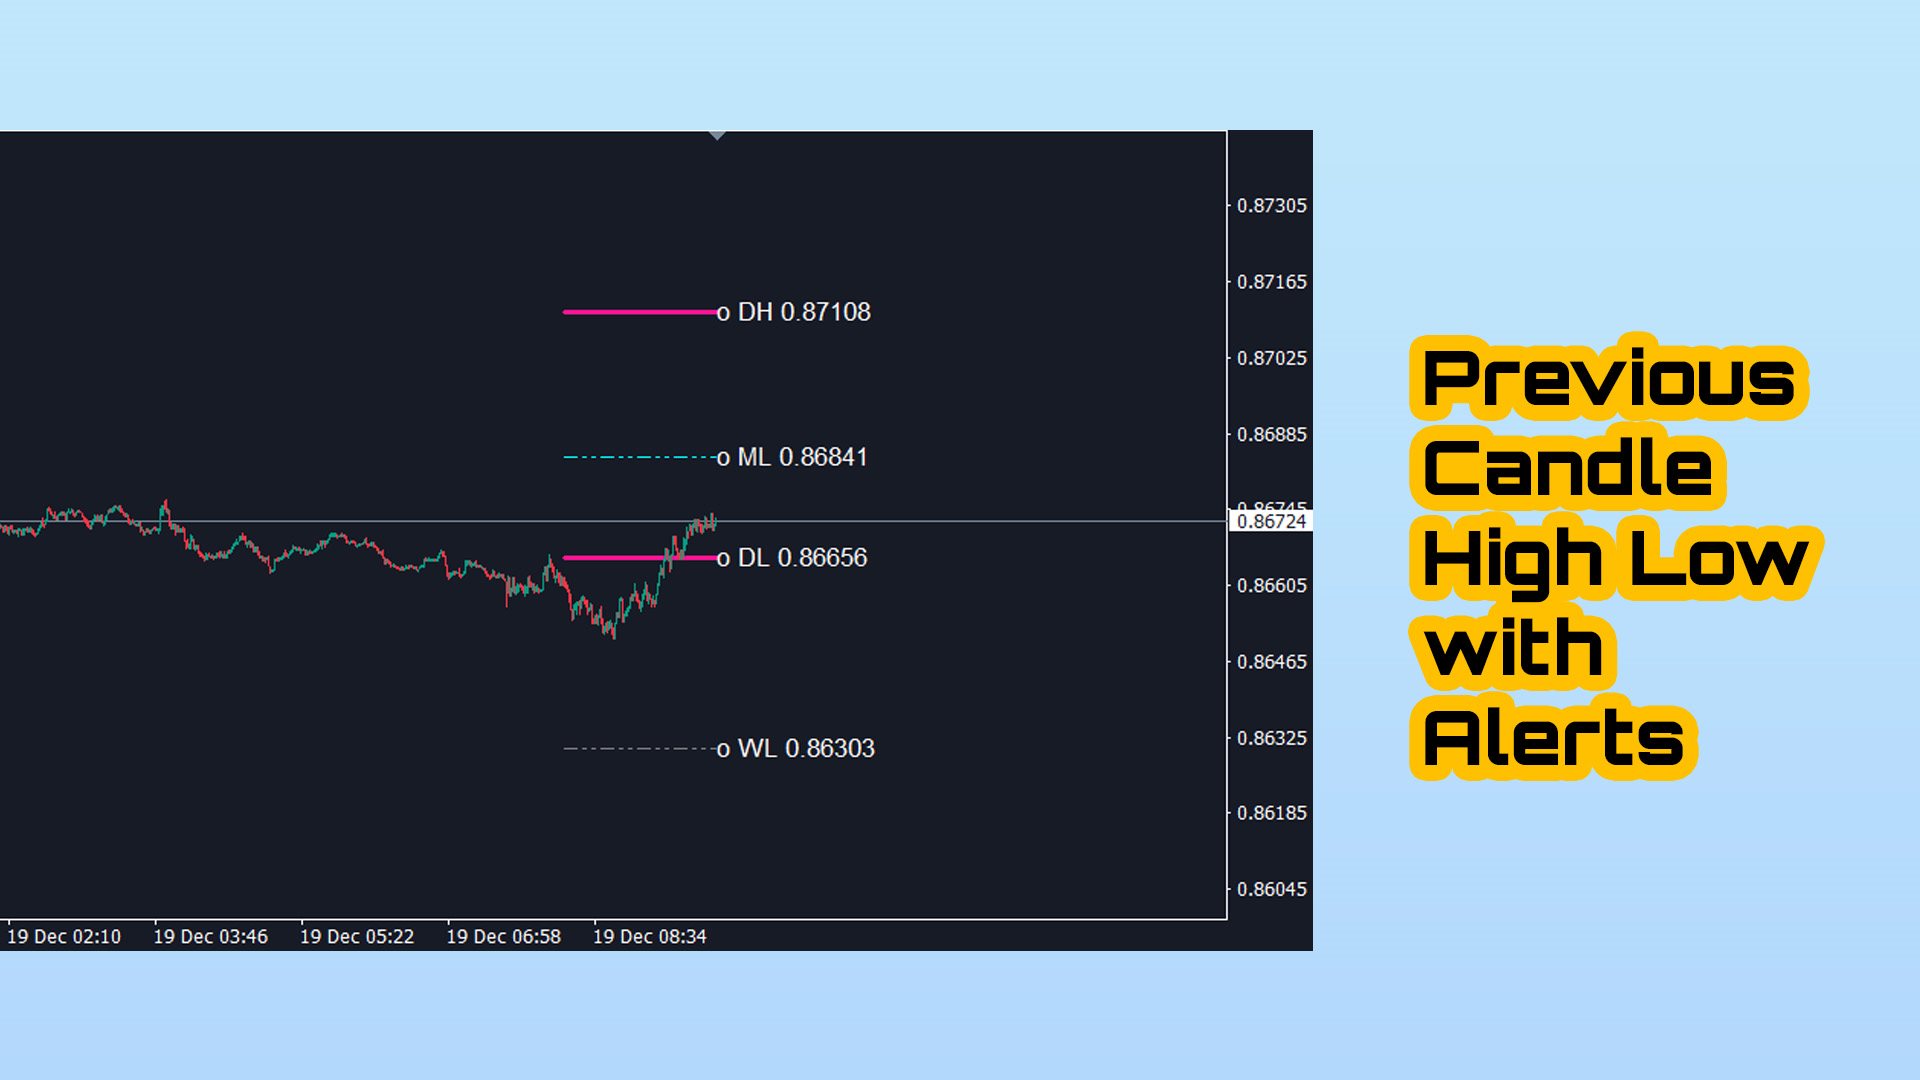
Si basa sulla strategia di inversione di precedenti alti e bassi, poiché si ritiene che il prezzo di solito mostri un rifiuto in un intervallo di tempo più breve come 5 minuti quando il prezzo raggiunge il massimo giornaliero, settimanale o mensile
Caratteristiche :
- Traccia fino a 6 massimi minimi temporali in un unico grafico
- Imposta avvisi su questi livelli, avvisi di posta, push o terminale, riceverai immediatamente avvisi quando il prezzo tocca questi livelli
- Personalizza gli stili dei livelli, inclusi lo stile della linea, la larghezza, il colore, ecc
- Shift: vuoi monitorare o ricercare il 2° giorno o il 3° giorno High Low? È possibile impostare lo spostamento su 2 per l'alto minimo della 2a barra o 3 per l'alto minimo della 3a barra e così via..