Previous Candle High Low with Alerts
- Indicators
- Rajesh Kumar Nait
- Version: 1.0
- Activations: 5
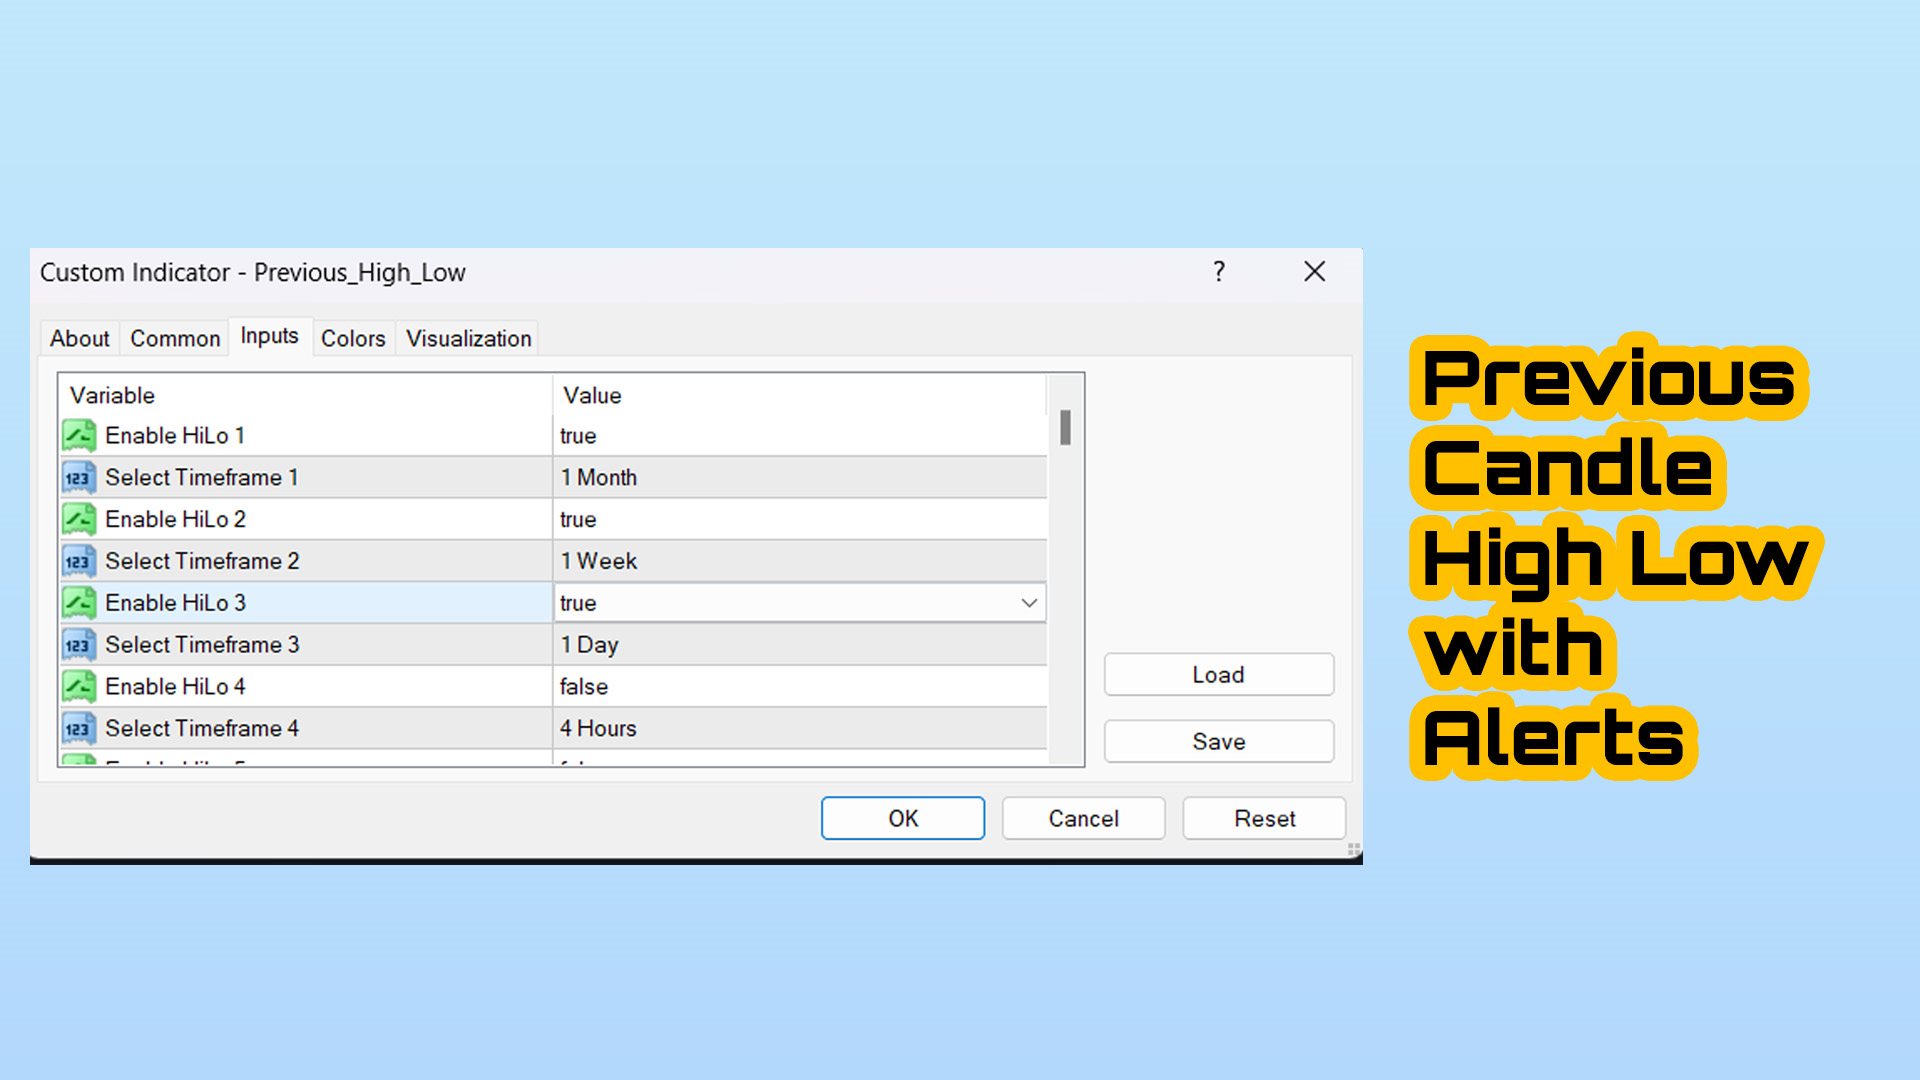
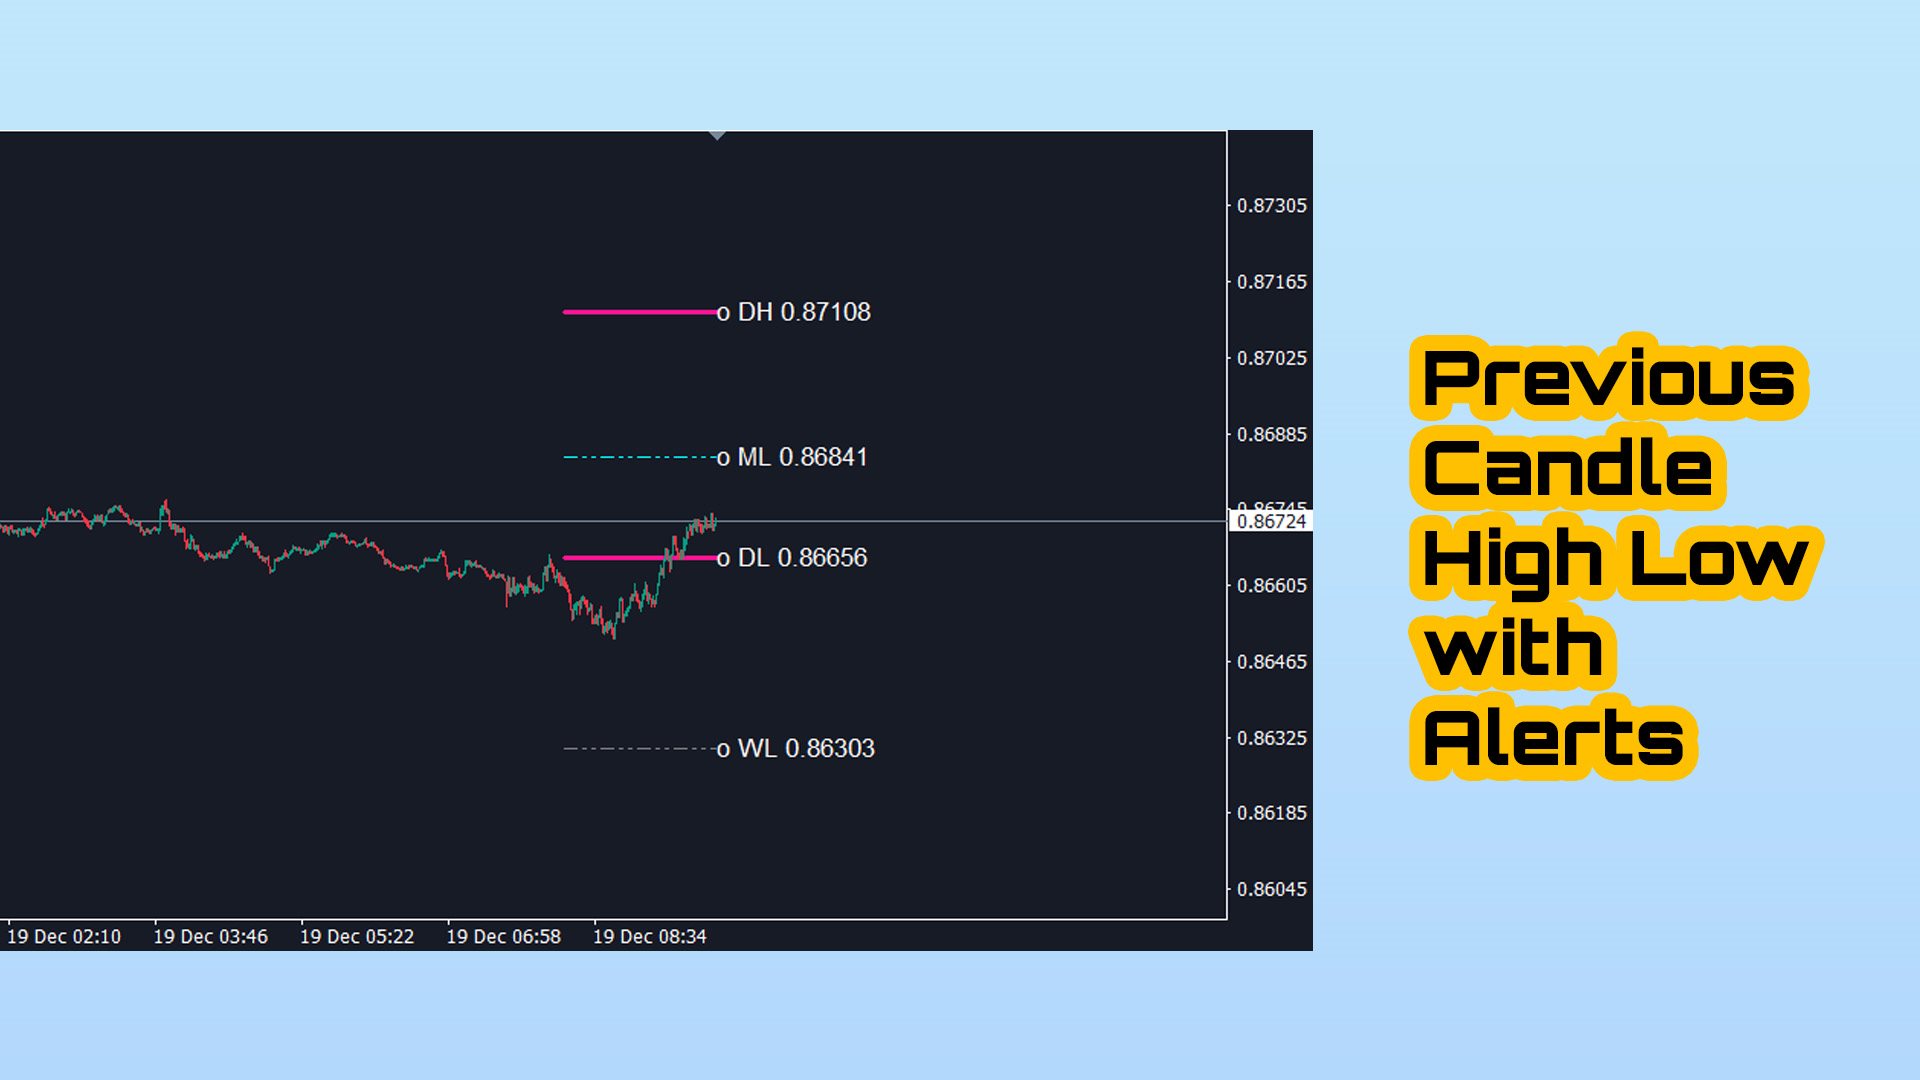
This indicator plots upto 6 levels which can be enable / disable to make chart cleaner as per trader's requirement
You can get alerts on Previous Week Previous Day, Previous Month or high low of any period previous candle available in MT4
These 6 levels are in 2 sets : High and Low
For each sets, different time frame can be selected
It is based on strategy of Previous High Low reversal, as its considered that price usually show rejection in smaller timeframe like 5min when price reach Daily, Weekly or Monthly High Low
Features :
- Track upto 6 Time frame High Lows in single chart
- Set alerts on these levels, Mail, Push or Terminal alerts, You will get instantly alerted when price touches these levels only once to avoid repetitions.
- Customize the styles of levels, including line style, width, color etc
- Shift : Want to track or research on 2nd day or 3rd day's High Low ? You can set shift to 2 for 2nd Bar's High low or 3 for 3rd bar's high low and so on..
Note : Other time frame apart from Daily, Weekly, Monthly are optional for experiments and may overlap text.