• Panoramica
  • Recensioni (2)
  • Commenti
  • Novità

ON Trade Waves Patterns Harmonic Elliot Wolfe

5

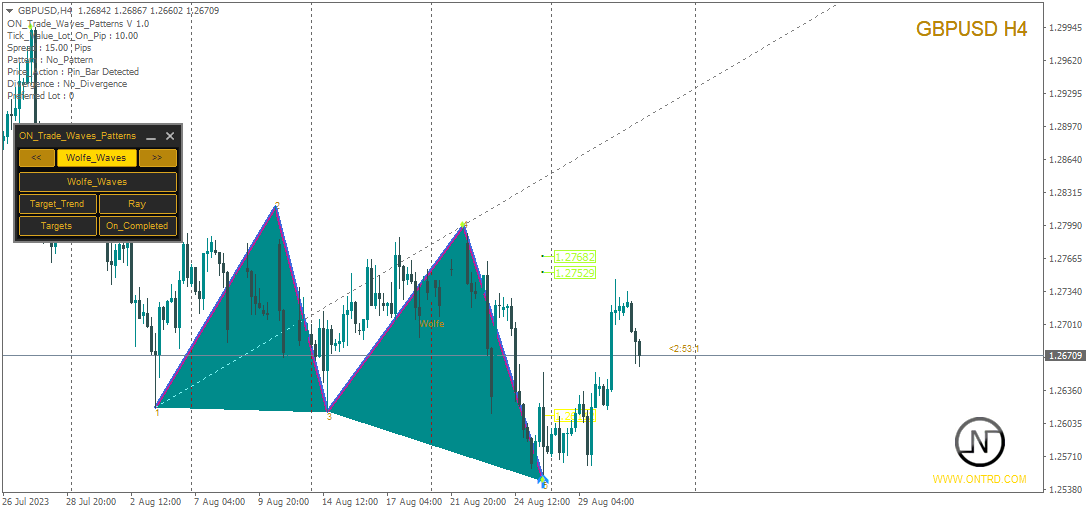
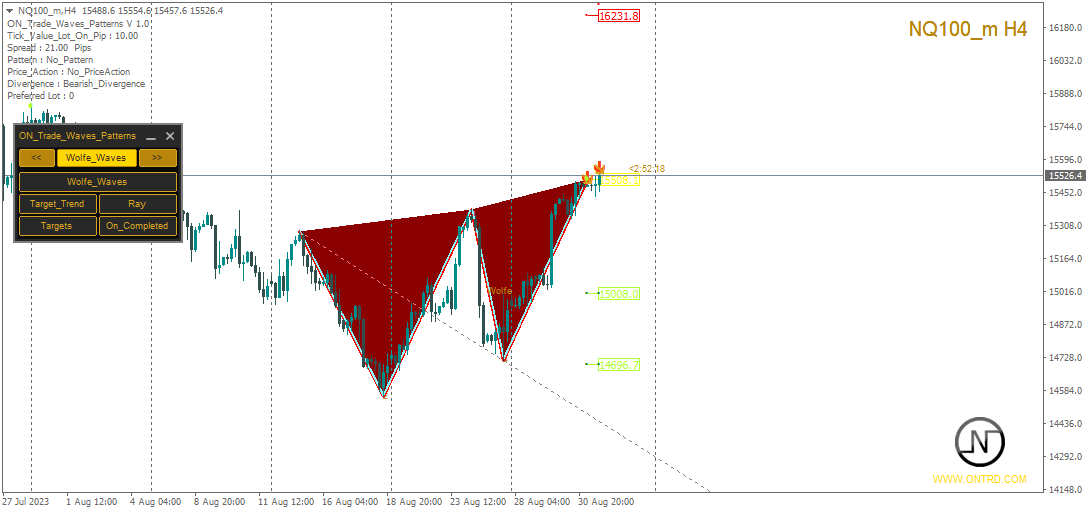
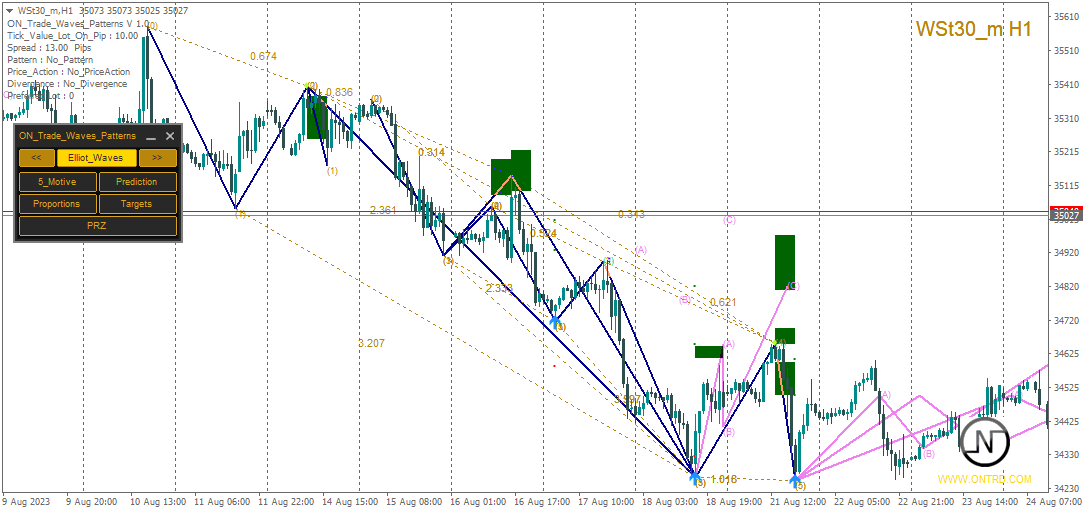
Vi presentiamo ON Trade Waves Patterns Harmonic Elliot Wolfe, un indicatore avanzato progettato per rilevare vari tipi di pattern sul mercato utilizzando metodi sia manuali che automatici. Ecco come funziona:

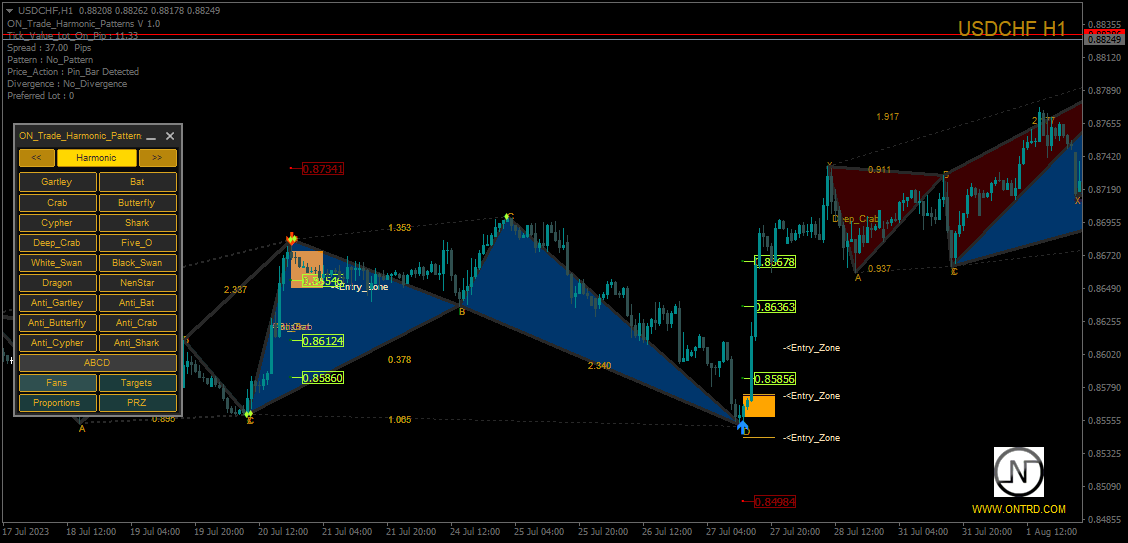
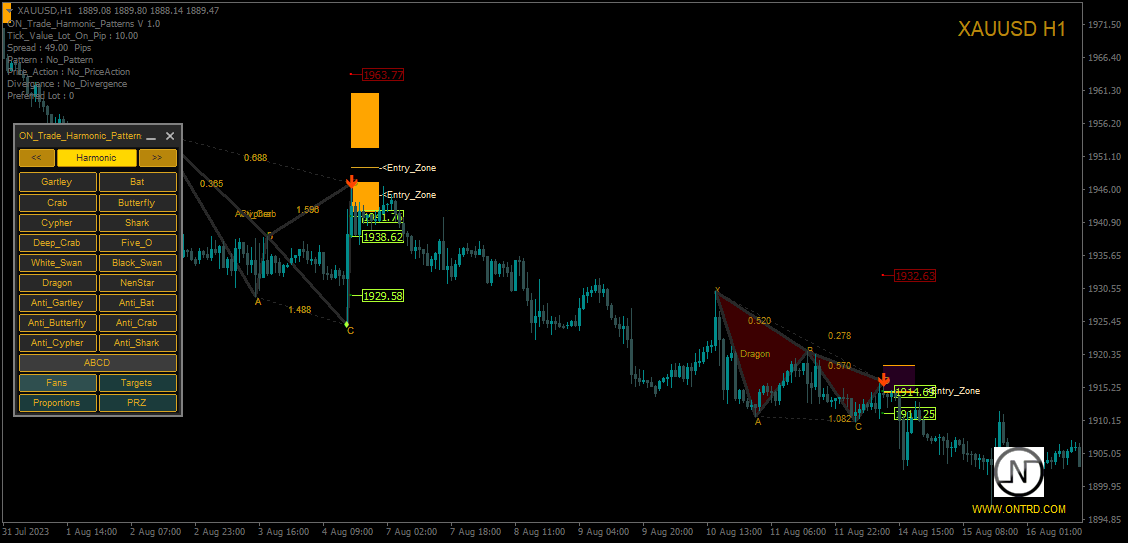
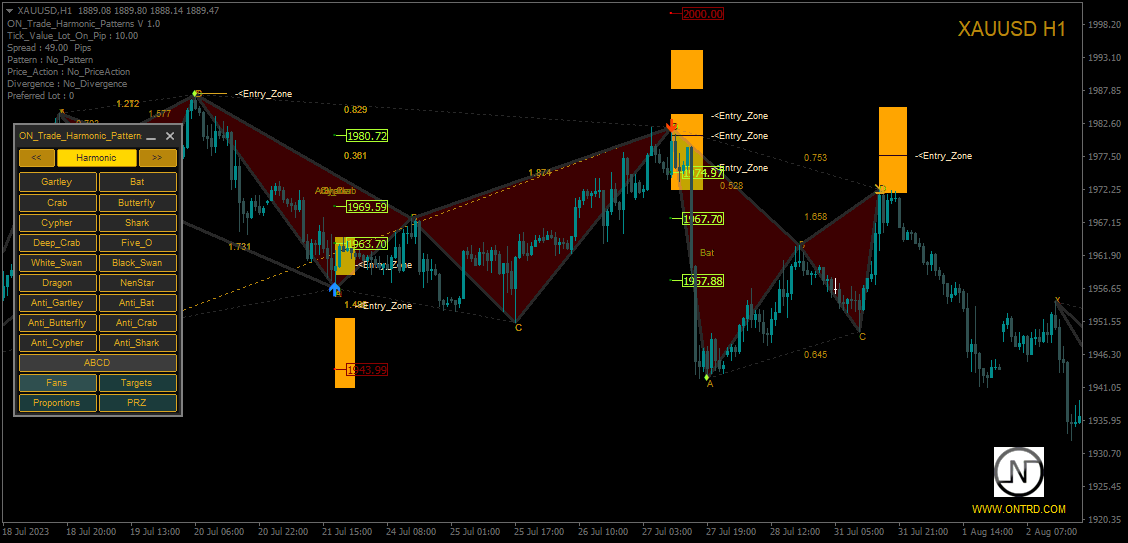
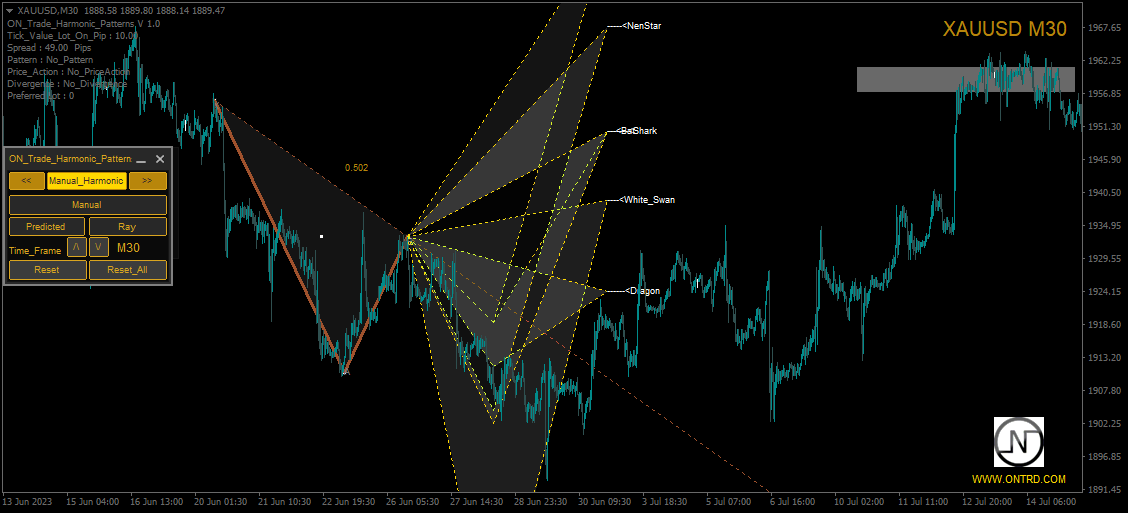
Pattern Armonici: Questo indicatore è in grado di individuare pattern armonici che appaiono sul vostro grafico. Questi pattern sono fondamentali per i trader che praticano la teoria del trading armonico, come descritta nel libro di Scott Carney "Harmonic Trading vol 1 & 2". Che li disegniate manualmente o contiate sulla rilevazione automatica, ON Trade Waves Patterns è a vostra disposizione.

Pannello di Controllo: Abbiamo dotato questo indicatore di un pannello di controllo user-friendly. Esso memorizza le impostazioni del vostro grafico e del timeframe, consentendovi di passare facilmente tra diverse configurazioni. Potete anche minimizzarlo per massimizzare lo spazio sul vostro grafico. Se preferite lavorare con altri strumenti di analisi, un semplice clic sul pulsante di chiusura nasconderà tutti i dati dell'indicatore.

Salvataggio di Template: Quando personalizzate le vostre impostazioni o aggiungete altri indicatori come le Medie Mobili o le Bande di Bollinger, questo indicatore salverà automaticamente il vostro template. Ciò significa che potete facilmente caricare le vostre impostazioni preferite quando ne avete bisogno.

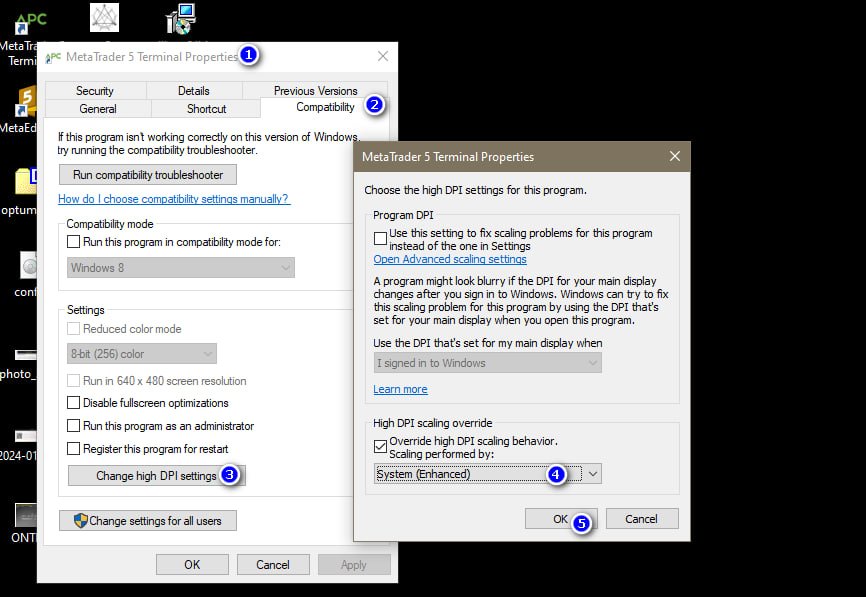
Visualizzazione Ottimizzata: Per gli utenti di Windows 10, consigliamo di regolare le impostazioni DPI per ottenere la migliore esperienza su schermi ad alta definizione (HD). Cliccate con il tasto destro sull'icona di MetaTrader, selezionate "Compatibilità" e scegliete "Modifica impostazioni DPI elevate" e impostatelo su "Sistema (ottimizzato)".

Funzioni Aggiuntive: ON Trade Waves Patterns Harmonic Elliot Wolfe va oltre i pattern armonici. Offre diverse altre funzionalità preziose:

  • Linee di allarme prezzo e tempo per tenervi costantemente informati.
  • Ventagli di Fibonacci per completare i pattern rilevati.
  • Punti pivot, Camarella e raggi di pattern per analisi avanzate.
  • La capacità di caricare oggetti disegnati manualmente da timeframe superiori a timeframe inferiori.
  • Un sistema di allarme e notifica che vi fornisce obiettivi, livelli di stop ed ingressi sotto forma di segnali.
  • Il rilevamento delle divergenze con frecce gialle ed arancioni per ulteriore conferma.
  • Il calcolo automatico della dimensione ideale del lotto per ciascun pattern, aiutandovi a gestire il rischio in modo efficace.
  • Il riconoscimento di pattern di azione dei prezzi come Pinbars, Inside Bars ed Outside Bars.

Integrazione con gli Expert Advisor (EA): Se siete interessati al trading algoritmico, potete utilizzare i buffer di questo indicatore in un EA utilizzando il codice fornito.

ON Trade Waves Patterns Harmonic Elliot Wolfe è il vostro strumento completo per il riconoscimento e l'analisi dei pattern, offrendo una vasta gamma di funzionalità per migliorare la vostra strategia di trading.

Per saperne di più su questo potente indicatore, consultate il nostro manuale utente [inserire il link]. Iniziate oggi stesso a massimizzare il vostro potenziale di trading!


Recensioni 2
Sameer Haque
463
Sameer Haque 2023.09.10 16:06 
 

Highly accurate and very versatile. A great addition to my toolkit.

Prodotti consigliati
Introduction to X3 Chart Pattern Scanner X3 Cherart Pattern Scanner is the non-repainting and non-lagging indicator detecting X3 chart patterns including Harmonic pattern, Elliott Wave pattern, X3 patterns, and Japanese Candlestick patterns. Historical patterns match with signal patterns. Hence, you can readily develop the solid trading strategy in your chart. More importantly, this superb pattern scanner can detect the optimal pattern of its kind. In addition, you can switch on and off individu
250 USD
Elliott Wave Trend was designed for the scientific wave counting. This tool focuses to get rid of the vagueness of the classic Elliott Wave Counting using the guideline from the template and pattern approach. In doing so, firstly Elliott Wave Trend offers the template for your wave counting. Secondly, it offers Wave Structural Score to assist to identify accurate wave formation. It offers both impulse wave Structural Score and corrective wave Structure Score. Structural Score is the rating to sh
200 USD
Introduction to Harmonic Volatility Indicator Harmonic Volatility Indicator is the first technical analysis applying the Fibonacci analysis to the financial volatility. Harmonic volatility indicator is another level of price action trading tool, which combines robust Fibonacci ratios (0.618, 0.382, etc.) with volatility. Originally, Harmonic Volatility Indicator was developed to overcome the limitation and the weakness of Gann’s Angle, also known as Gann’s Fan. We have demonstrated that Harmonic
80 USD
ABCD Harmonic Patterns
Mehmet Ozhan Hastaoglu
Thanks to this indicator, you can easily see the new ABCD harmonic patterns in the chart. If the two price action lengths are equal, the system will give you a signal when it reaches the specified level. You can set the limits as you wish. For example, You can get the signal of the price, which occurs in the Fibonaci 38.2 and 88.6 retracements, and then moves for the same length, at the level you specify. For example, it will alarm you when the price reaches 80% as a percentage. In vertic
119 USD
Introduction Harmonic Patterns are best used to predict potential turning point. Traditionally, Harmonic Pattern was identified manually connecting peaks and troughs points in the chart. Manual harmonic pattern detection is painfully tedious and not suitable for everyone. You are often exposed under subjective pattern identification with manual pattern detection. To avoid these limitations, Harmonic Pattern Plus was designed to automate your harmonic pattern detection process. The functionality
98 USD
Introduction to Smart Renko The main characteristics of Renko Charting concern price movement. To give you some idea on its working principle, Renko chart is constructed by placing a brick over or below when the price make the movement beyond a predefined range, called brick height. Therefore, naturally one can see clear price movement with less noise than other charting type. Renko charting can provide much clearer trend direction and it helps to identify important support and resistance level
80 USD
Gartley Projection D
Oleksandr Medviediev
1 (1)
The indicator identifies the harmonic patterns (XABCD) according to developments of H.M.Gartley ( "Profits in the Stock Market" , 1935г). It projects D-point as a point in the perspective projection (specify ProjectionD_Mode = true in the settings). Does not redraw. When a bar of the working timeframe closes, if the identified pattern point has not moved during Patterns_Fractal_Bars bars, an arrow appears on the chart (in the direction of the expected price movement). From this moment on, the ar
1 000 USD
Auto Levels
Yaroslav Varankin
Auto Level this tool is able to determine the levels of support and resistance. search and display when the price has broken through the level and when it pushed off from it. the indicator can be useful if you use resistance support levels in your trading. or the highs and lows of the price, then it will greatly simplify your work and help you more quickly and more accurately determine the rebound or breakdown of the current trend or tendencies level. blue line bottom uptrend red line on top dow
500 USD
Introduction to Fractal Pattern Scanner Fractal Indicator refers to the technical indicator that makes use of the fractal geometry found in the financial market. Fractal Pattern Scanner is the advanced Fractal Indicator that brings the latest trading technology after the extensive research and development work in the fractal geometry in the financial market. The most important feature in Fractal Pattern Scanner is the ability to measure the turning point probability as well as the trend probabi
180 USD
Gold Phoenix
Yaroslav Varankin
The perfect tool for Scalng in the Forex markets You can trade both from signal to signal and using take profit  The algorithm does not use Zigzag!  No redrawing!  This is a channel instrument that uses a moving average as a filter. Moving Average  There are 2 parameters for the settings Ma Period = 5 period Moving Average  Channel 1.0 distance of channel lines from the chart Price Signal Filter - calculation of signal opening and filter There is a complete set of Alert There is a multi-timefram
400 USD
Reversal Pattern Pro
Boonyapagorn Rodvattanajinda
Reversal Patterns Pro Reversal Patterns Pro is a Price Action (PA) analytical tool that scans the reversal patterns.  - Finds and marks the most dependable Japanese candlestick patterns in real-time. - Supports all time frames (Best for Scalping) - Doesn't repaint making it an exceptional indicator for Expert Advisors. Input parameters : - Support & Resistance Mode ( true or false ) for enabling advanced filtering - Donchian Period - RSI Period - RSI Oversold Level - RSI Overbought Level - 
50 USD
BeST_Gann Swing Oscillator is an MT4 indicator that is based on the corresponding work of Robert Krausz who introduced it in the book “ A.W.D Gann Treasure Discovered ” . The Gann Swing Oscillator is a range-bounding technical indicator that oscillates between +1 and -1 and thus it describes the market swings. Generally when the market is in an upswing, the Gann Swing Oscillator describes it as 2 higher highs with the value of +1 while after an upswing, the downswing is expected. Also the do
35 USD
This indicator detects Inside Bar Narrow Range 4 and Inside Bar Narrow Range 7 two powerful patterns on 28 pairs on all timeframes.  "Inside Bar Narrow Range 4"  is an inside bar with the narrowest range out of the last 4 bars so "Inside Bar Narrow Range 7" an inside bar with the narrowest range  out of the last 7 bars. Hence, IBNR4 and better IBNR7 are an objective criterion for identifying  decreased range and volatility. Once we find an IBNR4 or an IBNR7 pattern, we aim to trade the breakou
179 USD
Monster Harmonic Indicator
Paul Geirnaerdt
4.61 (31)
Monster Harmonics Indicator is a harmonic pattern indicator. It recognizes Gartley, Bat, Crab, Butterfly, Cypher, White Swan, Black Swan, Shark and several other patterns. Projected patterns that are not yet completed are recognized, too. Monster even shows the PRZ (Potential Reversal Zone). Users can add their own user defined patterns to Monster. Besides the current pattern, Monster also shows all patterns in the symbols history. Monster will provide alerts for developing patterns. Introduced
79 USD
The reason why many traders new to using the Fibonacci retracement tool find it hard to effectively use it is because they are having trouble identifying swing points that are significant enough to be considered. Main Features Show Fibonacci number with LL to HH in multitimeframe Show 23.6,38.2,50,61.8,78.6,88.6,100,112.8,127.2,141.4,161.8,200,224,261.8,314,361.8 and 423 of Fibonacci number Easy to use with simple interface. Real time information for the Fibonacci number . Settings Global
99 USD
The indicator scans for Dinapoli thrust pattern in multiple timeframes for a specific market. Key Features Indicator can be used for all markets It can scan for thrust pattern on W1, D1, H4, H1, M30, M15 and M5 timeframes Ability to choose number of bars required above/below displaced moving average to define thrust Able to move display label on chart by single click Parameters Minimum Bars: Least amount of bars to account for Thrust DMA Period: Moving average period DMA Shift: Number or bars re
60 USD
AndInvest Impulse
Bruno Ravardiere De Oliveira Goncalves
Em uma negociação no Mercado Financeiro nada é mais importante que saber o momento certo de entrar em uma negociação. O AndInvest Impulse auxilia traders a capturar o momento exato de abrir uma negociação, para isto ele desenha topos e fundos facilitando a leitura do Price Action e após um breve momento de realização do mercado ele identifica o retorno da ponta compradora ou vendedora de força antecipada e sem repintura. Comprovação de Resultados: https://youtu.be/CA1_ZtZY0vk Funciona em qualque
300 USD
Introduction to Chart Pattern MT Chart Pattern MT is a chart pattern scanner to detect the triangle pattern, falling wedge pattern, rising wedge pattern, channel pattern and so on. Chart Pattern MT uses highly sophisticated chart pattern detection algorithm. However, we have designed it in the easy to use with intuitive user interface. Chart Pattern MT will show all the patterns in your chart in the most efficient format for your trading. You do not have to do tedious manual pattern detection an
180 USD
Candle EA MT4
Mansour Babasafary
5 (1)
This expert is based on patterns The main patterns of this specialist are candlestick patterns Detects trends with candlestick patterns It has a profit limit and a loss limit, so it has a low risk The best time frame to use this expert is 1 hour time frame The best currency pair to use with this expert is the EUR-USD currency pair After buying(or rent) this expert, get "Candle EA GBPUSD" expert for free ! To get more information, send me a message. Attributes: Can be used in the EURUSD cu
249 USD
Trend lines master
The Trading Team Ltd
5 (1)
Launch promotion For a limited time only:  30$ instead of 157$ Summary Create precise trend lines in a second Description This indicator will draw your trend lines automatically with great precision, saving you some precious time. It uses Bill Williams Fractals to identify the key points and draws both inner and outer trend lines. Features Automatically draws precise trend lines
157 USD
PZ 123 Pattern
PZ TRADING SLU
3.75 (4)
The 123 Pattern is one of the most popular, powerful and flexible chart patterns. The pattern is made up of three price points: a bottom, a peak or valley, and a Fibonacci retracement between 38.2% and 71.8%. A pattern is considered valid when the price breaks beyond the last peak or valley, moment at which the indicator plots an arrow, rises an alert, and the trade can be placed. [ Installation Guide | Update Guide | Troubleshooting | FAQ | All Products ] Clear trading signals Customizable c
75 USD
The Raven Binary Options Indicator
Ellan Dirgantara Tholkhah
1 (1)
UPDATE: Works EXTREMELY well for EURJPY! --> more than 66% win rate monthly Guarantee! I want to introduce you the next-gen unique adaptive Binary options Indicator. This will destroy EURUSD & EURJPY The Raven is so sharp and efficient that it will pick the tops and bottoms of ANY type of market. Can also be used as a Forex Scalper. The Raven signal is based on multiple confirmation analysis. Gets confirmation from the most consistent signals known to man; Ichimoku, SMA, Bollinger Bands; and als
350 USD
Candle GAP
Thushara Dissanayake
L'indicatore   Candle GAP   è uno strumento essenziale per i trader che utilizzano   le strategie di Gap Trading   in quanto identifica automaticamente i gap delle candele per ogni giorno della settimana. Un gap si riferisce a una differenza di livello di prezzo tra la chiusura e l'apertura di due giorni consecutivi. Questo indicatore riconosce quattro tipi di modelli di gap: comune, fuga, continuazione ed esaurimento. Incorporando questo indicatore in qualsiasi grafico, i trader possono convali
50 USD
This indicator Super Neuro Trend indicator.Indicator displays trend movement. Indicator helps to buy and sell. Features FiltPer- displays indicator period. deviation - displaus indicator deviation. Trend - displaus indicator trend.( true,false) Rectangle - displaus indicator rectangle. (true,false)  How to understand the status: If the trend color is green, trend is up. I f the trend color is red, trend is down. I f the trend waiting,trend waiting.     /////////////////////////////////////////
75 USD
This indicator is a perfect wave automatic analysis indicator for practical trading! 黄金实战 案例... The standardized definition of the band is no longer a wave of different people, and the art of man-made interference is eliminated, which plays a key role in strict analysis of the approach. Increase the choice of international style mode, (red fall green rise style) The  purchase discount is currently in progress! Using this indicator is equivalent to enhancing the aesthetics of the trading in
188 USD
Inside Bar Indicator MT4
Nedyalka Zhelyazkova
5 (12)
This inside bar indicator MT4  is suitable if you are doing inside bar trading. So what this MT4 inside bar indicator does is identifies inside bars for you as they form on your charts. Inside bar is a famous trading pattern in which the bar carry higher low and lower high compared with the previous bar, also known as mother bar. With, a lesser time frame like the 1 hour chart, daily inside bar chart will sometimes appears to be similar to a triangle pattern. Inputs AlertOn - enable alerts Ema
FREE
This Indicator is use the ZigZag to calculate the Upper and  Lower Bound and the uptrend and the downtrned. Red for downtrend, Green for uptrend and Yellow is for the horizontal trend this horizontal trend also bookmarked the upper limited and the lower limited the the price swings.  Or in simple the Support and the Resistance level. However, You may use the Heikin Ashi to confirm the trend of the buy sell signal above. I cannot guarantee the win rate, Nevertheless, you must study well the timef
1 000 USD
This dashboard shows the latest available  Harmonic Patterns  for selected symbols. Free Indicator : Basic Harmonic Pattern MT5 Version Columns Symbol Trend (Bullish/ Bearish) Pattern Type (Gartley/ Butterfly/ Bat/ Crab) Entry  (Entry Price) SL (Stop Loss Price) TP1 (1st Take Profit Price) TP2  (2nd Take Profit Price) TP3  (3rd Take Profit Price) Current (Current Price) Age (Age of pattern in Bars) Alert Settings (Set an alert if a new pattern is found) You can sort the dashboard by the column
99 USD
IDNR4 and 7 28 Pairs Radar
Francesco Petralla
5 (1)
This indicator detects IDRN4 and IDNR7 two powerful patterns on 28 pairs on new daily bar. IDNR4 is the acronym for "Inside Day Narrow Range 4" where "Inside Day" is a lower high and higher low than the previous bar and "Narrow Range 4" is a bar with the narrowest range out of the last 4 bars so "Narrow Range 7" out of the last 7 bars. Hence, ID/NR4 and better ID/NR7 are an objective criterion for identifying days of decreased range and volatility. Once we find an ID/NR4 or an ID/NR7 pattern, we
179 USD
Pivot Points Multi
Professoft Limited
Pivot Points Indicator Features: Send alerts when a pivot line is hit Displays Daily, Weekly, Monthly Indicators at the same time on the chart Restricting the time during the day when the alerts are sent Adjust the styling settings for the Pivot lines Settings: Show Daily Pivots Show Weekly Pivots Show Monthly Pivots Weekly Pivots Hit Notification Enabled Monthly Pivots Hit Notification Enabled Hit Check Frequency Time Restriction Enabled From Hour To Hour PP Color R1 Color R2 Color R3 Color S1
45 USD
Gli utenti di questo prodotto hanno anche acquistato
Advanced Supply Demand
Bernhard Schweigert
4.93 (304)
CURRENTLY 26% OFF !! Best Solution for any Newbie or Expert Trader! This indicator is a unique, high quality and affordable trading tool because we have incorporated a number of proprietary features and a new formula. With this update, you will be able to show double timeframe zones. You will not only be able to show a higher TF but to show both, the chart TF, PLUS the higher TF: SHOWING NESTED ZONES. All Supply Demand traders will love it. :) Important Information Revealed Maximize the potenti
148 USD
ATTUALMENTE SCONTATO DEL 26% La soluzione migliore per ogni principiante o trader esperto! Questo indicatore è uno strumento di trading unico, di alta qualità e conveniente perché abbiamo incorporato una serie di caratteristiche proprietarie e una nuova formula. Con un solo grafico è possibile leggere la forza delle valute per 28 coppie Forex! Immaginate come migliorerà il vostro trading perché sarete in grado di individuare l'esatto punto di innesco di una nuova tendenza o di un'opportunit
148 USD
Attualmente 20% di sconto! La soluzione migliore per ogni principiante o trader esperto! Questo software per cruscotti funziona su 28 coppie di valute. Si basa su 2 dei nostri indicatori principali (Advanced Currency Strength 28 e Advanced Currency Impulse). Offre un'ottima panoramica dell'intero mercato Forex. Mostra i valori di forza delle valute avanzate, la velocità di movimento delle valute e i segnali per 28 coppie Forex in tutti i (9) timeframe. Immaginate come migliorerà il vostro t
199 USD
TrendMaestro
Stefano Frisetti
5 (1)
nota: questo indicatore e' per METATRADER4, se vuoi la versione per  METATRADER5 questo e' il link:  https://www.mql5.com/it/market/product/108123 TRENDMAESTRO riconosce un nuovo TREND sul nascere, non sbaglia mai. La sicurezza di identificare un nuovo TREND non ha prezzo. DESCRIZIONE TRENDMAESTRO identifica un nuovo TREND sul nascere, questo indicatore prende in esame la volatilita' i volumi ed il momentum per identificare il momento in cui c'e' un'esplosione di uno  opiu' di questi dati
397 USD
FX Power MT4 NG
Daniel Stein
5 (2)
Ricevi il tuo aggiornamento quotidiano sul mercato con dettagli e schermate tramite il nostro Morning Briefing qui su mql5 e su Telegram ! FX Power MT4 NG è la nuova generazione del nostro popolare misuratore di forza delle valute, FX Power. Cosa offre questo misuratore di forza di nuova generazione? Tutto ciò che avete amato dell'FX Power originale IN PIÙ Analisi della forza di ORO/XAU Risultati di calcolo ancora più precisi Periodi di analisi configurabili individualmente Limite di calcolo pe
169 USD
RelicusRoad Pro
Relicus LLC
4.86 (132)
Ora $ 147 (aumentando a $ 499 dopo alcuni aggiornamenti) - account illimitati (PC o MAC) Manuale utente di RelicusRoad + Video di formazione + Accesso al gruppo Discord privato + Stato VIP UN NUOVO MODO DI GUARDARE IL MERCATO RelicusRoad è l'indicatore di trading più potente al mondo per forex, futures, criptovalute, azioni e indici, fornendo ai trader tutte le informazioni e gli strumenti di cui hanno bisogno per rimanere redditizi. Forniamo analisi tecniche e piani di trading per aiuta
147 USD
Cycle Sniper
Elmira Memish
4.41 (34)
NEW YEAR SALE PRICE FOR LIMITED TIME!!! Please contact us after your purchase and we will send you the complimentary indicators to complete the system . Cycle Sniper is not a holy grail but when you use it in a system which is explained in the videos, you will feel the difference. If you are not willing to focus on the charts designed with Cycle Sniper and other free tools we provide, we recommend not buying this indicator. We recommend watching the videos about the indiactor and system befor
199 USD
FX Volume
Daniel Stein
4.59 (34)
Ricevi il tuo aggiornamento quotidiano sul mercato con dettagli e schermate tramite il nostro Morning Briefing qui su mql5 e su Telegram ! FX Volume è il PRIMO e UNICO indicatore di volume che fornisce una visione REALE del sentiment del mercato dal punto di vista del broker. Fornisce informazioni straordinarie su come gli operatori di mercato istituzionali, come i broker, sono posizionati sul mercato Forex, molto più velocemente dei rapporti COT. Vedere queste informazioni direttamente sul vo
249 USD
GOLD Impulse with Alert
Bernhard Schweigert
4.43 (7)
Questo indicatore è una super combinazione dei nostri 2 prodotti Advanced Currency IMPULSE with ALERT  +   Currency Strength Exotics . Funziona per tutti i time frame e mostra graficamente l'impulso di forza o debolezza per le 8 valute principali più un simbolo! Questo indicatore è specializzato nel mostrare l'accelerazione della forza delle valute per qualsiasi simbolo come oro, coppie esotiche, materie prime, indici o futures. Primo nel suo genere, qualsiasi simbolo può essere aggiunto
149 USD
Price Action Entry Alerts
Stephen Sanjeeve Sahayam
5 (2)
Questo indicatore controlla ogni barra per la pressione di acquisto o vendita e identifica 4 tipi di modelli di candele con il volume più alto. Queste candele vengono quindi filtrate utilizzando diversi filtri lineari per mostrare segnali di acquisto o vendita. I segnali funzionano meglio, in combinazione con una direzione temporale più elevata e quando scambiati durante le ore ad alto volume. Tutti i filtri sono personalizzabili e funzionano in modo indipendente. Può visualizzare i segnali di
225 USD
CFF Banks Liquidity
Abdalla Mohamed Kandil
CFF Banks Liquidity     Entry signals without repainting or delays     Error-free opening of trades     Provides signals for any direction sell & Buy Join Our Public Telegram Channel for latest updates and set files.   | Our Telegram Channel How does the CFF Banks Liquidity Works? Our CFF Banks Liquidity trading system based on a very accurate "Trend-Following" Trading Strategy. Here's how to Start using our System 1.      Buy and install the indicator in your terminal. Ask the guide.
313 USD
Scalping and Binary Signal Detector - Indicatore di scalping che fornisce segnali direzionali per l'apertura di posizioni lungo il trend. L'indicatore è un sistema di trading completo che può essere utilizzato per Forex e opzioni binarie. Il sistema di algoritmi consente di riconoscere movimenti intensi di prezzo in più barre consecutive. L'indicatore fornisce diversi tipi di avvisi per le frecce. Funziona su qualsiasi strumento di trading e intervallo di tempo (consigliato M5 o superiore).
159 USD
Enigmera
Ivan Stefanov
5 (1)
ENIGMERA: Il cuore del mercato https://www.enigmera.com Introduzione Questo indicatore e sistema di trading rappresenta un approccio straordinario ai mercati finanziari. ENIGMERA utilizza i cicli frattali per calcolare con precisione i livelli di supporto e resistenza. Mostra l'autentica fase di accumulazione e fornisce direzione e obiettivi.  Un sistema che funziona sia in un trend che in una correzione.  Come funziona? ENIGMERA è composto da tre linee: la linea di supporto/resistenza, la
1 800 USD
Smart Ai Levels  Accumulation & Distribution indicator Smart Ai Levels are Ai controlled indicator which is based on Wyckoff Price cycle theory . It automatically scans the Accumulation & Distribution phases on chart and Ai draws the possible areas before Mark up and Mark down which acts as hot zones and can be traded with confirmation to catch those big price movements . It's a great tool for both Reversal and Breakout Trades suitable to all Trading Styles such as Scalping - Intraday - Swing 
249 USD
CyberZingFx Trend Reversal
Afsal Meerankutty
4.26 (19)
Indicator captures the trend reversals with no-repaint Buy and Sell Arrow signals. CyberZingFx Trend Reversal Indicator - your go-to solution for accurate and reliable trend reversal signals. With its  advanced trading strategy , the indicator offers you Buy and Sell Arrow signals that do not repaint, making it a reliable tool for catching Swing Highs and Swing Lows in any market and any time frame. Indicator works on  any market  and  any time frames . __________________________________________
149 USD
Price Action Sniper
Elmira Memish
3.67 (3)
Price Action Sniper is designed to trade the Price Action on the desired chart time frame. - Trend Reversals. - Trend Continuation. - Brekaouts. - Good tool for Binary Options Price action forms the basis for all technical analysis of a currency pair, commodity or other asset chart. Many short-term traders rely exclusively on price action and the formations and trends extrapolated from it to make trading decisions. Technical analysis as a practice is a derivative of price action since it uses
150 USD
CS ATR FIBO CHANNELS MULTI TIMEFRAME Additional tool to trade with Cycle Sniper Indicator. Cycle Sniper :  https://www.mql5.com/en/market/product/51950 Indicator Draws Channels based on: - Cycle Sniper Price and Moving Averages - ATR Deviations - Fibonacci Retracement and Extensions Features: - Multi TimeFrame - Full alert and Notification options. - Simple Settings - Finds the trend change or extreme reversals. Inputs: - Arrow Mode: ATR Levels or Median Line   If Median Line is selected
140 USD
Gartley Hunter Multi MT4
Siarhei Vashchylka
4.67 (3)
Gartley Hunter Multi - An indicator for searching for harmonic patterns simultaneously on dozens of trading instruments and on all classic timeframes: (m1, m5, m15, m30, H1, H4, D1, Wk, Mn). Manual (Be sure to read before purchasing) | Version for MT5 Advantages 1. Patterns: Gartley, Butterfly, Shark, Crab. Bat, Alternate Bat, Deep Crab, Cypher 2. Simultaneous search for patterns on dozens of trading instruments and on all classic timeframes 3. Search for patterns of all possible sizes. Fr
149 USD
"Supply / Demand Zones" The concepts of supply and demand zones   are undoubtedly two of the most highly discussed attributes of technical analysis. Part of analysing chart of pattern , these terms are used by traders   to refer to price levels i n charts that tend to act as barriers, preventing the price of an asset from getting pushed in a certain direction. At first, the explanation and idea behind identifying these levels seems easy, but as you'll find out, supply and demand zones can co
199 USD
TPA True Price Action indicator reveals the true price action of the market makers through 100% non-repainting signals (except early signals mode) strictly at the close of a candle! TPA shows entries and re-entries, every time the bulls are definitely stronger than the bears and vice versa. Not to confuse with red/green candles. The shift of power gets confirmed at the earliest stage and is ONE exit strategy of several. There are available now two free parts of the TPA User Guide for our custo
168 USD
Volume by Price MT4
Brian Collard
5 (14)
The Volume by Price Indicator for MetaTrader 4 features Volume Profile and Market Profile TPO (Time Price Opportunity). Get valuable insights out of currencies, equities and commodities data. Gain an edge trading financial markets. Volume and TPO histogram bar and line charts. Volume Footprint charts. TPO letter and block marker charts including split structures. Positioning and styling options to suit the user's needs and context. Highlight Volume Profile and Market Profile TPO Point of Contro
259 USD
PZ Divergence Trading
PZ TRADING SLU
5 (3)
Tricky to find and scarce in frequency, divergences are one of the most reliable trading scenarios. This indicator finds and scans for regular and hidden divergences automatically using your favourite oscillator. [ Installation Guide | Update Guide | Troubleshooting | FAQ | All Products ] Easy to trade Finds regular and hidden divergences Supports many well known oscillators Implements trading signals based on breakouts Displays suitable stop-loss and take-profit levels Configurable oscill
249 USD
Best Currency Strength Indicator
Tumelo Patrick Rakotsoane
4.54 (46)
Advanced Currency Strength Indicator The Advanced Divergence Currency Strength Indicator. Not only it breaks down all 28 forex currency pairs and calculates the strength of individual currencies across all timeframes , but, You'll be analyzing the WHOLE forex market in 1 window (In just 1 minute) . This indicator is very powerful because it reveals the true movements of the market.  It is highly recommended to  analyze charts knowing the performance of individual currencies or the countries ec
149 USD
MTF Supply Demand Zones
Georgios Kalomoiropoulos
4.83 (23)
Nuova generazione di zone di domanda e offerta automatizzate. Algoritmo nuovo e innovativo che funziona su qualsiasi grafico. Tutte le zone vengono create dinamicamente in base all'azione dei prezzi del mercato. DUE TIPI DI AVVISI --> 1) QUANDO IL PREZZO RAGGIUNGE UNA ZONA 2) QUANDO SI FORMA UNA NUOVA ZONA Non ottieni un altro indicatore inutile. Ottieni una strategia di trading completa con risultati comprovati.     Nuove caratteristiche:     Avvisi quando il prezzo raggiunge
149 USD
CyberZingFx Volume Plus
Afsal Meerankutty
4.93 (15)
Advanced version of CyberZingFx Volume Plus, the ultimate MT4 indicator for traders seeking highly accurate buy and sell signals. With an additional strategy and price action dot signals that enhances its effectiveness, this indicator offers a superior trading experience for professionals and beginners alike. The CyberZingFx Volume Plus Advanced version combines the power of volume analysis and historical price data with an additional strategy, resulting in even more precise and reliable signals
135 USD
TTM Squeeze indicator for MT4
Renaud Herve Francois Candel
TTM Squeeze Indicator TTM Squeeze is an indicator to time entries based on volatility. TMM Squeeze might well be one of the best and most overlooked indicator. It was created by famous trader John Carter and is also used by many traders like Nathan Bear. Why is the TTM Squeeze indicator important? Because in trading correct timing entries might be more important than picking the right direction.   This is a concept that is not very well understood in the trading community. Most trader think
147 USD
The elite (V3) multi-indicator suite from JoaquinTrading specifically geared towards Forex & binary options, including regulated exchanges such Nadex, Cantor Exchange, and other binary option brokers. The Probability Tool Suite Elite will provide the given win/loss outcome probabilities of up to 10 strike levels, a specific expiration duration, based on a combination of up to 16 indicators, rules, or conditions and derivative behavior (i.e. expiry, touch, touch & retrace).  Using this indicat
149 USD
ATTUALMENTE SCONTATO DEL 26%!! Questo indicatore è una super combinazione di entrambi i nostri indicatori principali ( Advanced Currency Strength 28   &  Advanced Currency IMPULSE with ALERT  ). Mostra i valori di forza della valuta per unità di TICK e segnali di allerta per 28 coppie Forex. È possibile utilizzare 11 diverse unità di Tick. Si tratta di 1, 2, 3, 4, 5, 6, 10, 12, 15, 20 e 30 secondi. La barra dell'unità di tick nella finestra secondaria verrà mostrata e spostata a sinistra quan
148 USD
L'Oscillatore dell'Indice di Precisione (Pi-Osc) di Roger Medcalf di Precision Trading Systems La Versione 2 è stata attentamente rielaborata per essere estremamente veloce nel caricarsi sul tuo grafico e sono state apportate alcune altre migliorie tecniche per migliorare l'esperienza. Il Pi-Osc è stato creato per fornire segnali di sincronizzazione del trading accurati progettati per individuare punti di esaurimento estremi, i punti ai quali i mercati vengono costretti a recarsi solo per e
147.50 USD
PZ Support Resistance
PZ TRADING SLU
3.33 (3)
Tired of plotting support and resistance lines? This is a multi-timeframe indicator that detects and plots supports and resistance lines in the chart with the same precision as a human eye would. As price levels are tested over time and its importance increases, the lines become thicker and darker, making price leves easy to glance and evaluate. [ Installation Guide | Update Guide | Troubleshooting | FAQ | All Products ] Boost your technical analysis Customizable timeframe selection Read pri
149 USD
Altri dall’autore
L'indicatore Quadrato di Gann è uno strumento potente di analisi di mercato basato sull'articolo "Formula Matematica per le Previsioni di Mercato" scritto da W.D. Gann. Questo strumento utilizza concetti matematici e teorie di Gann per effettuare un'analisi precisa del mercato. Utilizza i quadrati di 144, 90, 52 e anche il quadrato di 9. Inoltre, integra il metodo del  per il quadrato di 9 e la sua relazione con canali e modelli stellari di quel quadrato. Manuale Utente e Applicazione: Prima di
133 USD
Shepherd Harmonic Pattern
Abdullah Alrai
4.72 (69)
Questo indicatore rileverà modelli armonici disegnati sul grafico mediante metodi manuali e automatici. Puoi consultare il manuale dell'utente tramite questo link: Aggiungi la tua recensione e contattaci per ottenerlo. C'è una versione gratuita per provare questo prodotto su MT4. Puoi usarlo per rilevare i modelli di Gartley e Nenstar: https://www.mql5.com/en/market/product/30181 Puoi acquistare la versione completa di MT4 da: https://www.mql5.com/en/market/product/15212 Note L'indicatore ha un
133 USD
ON Trade Optuma Astro
Abdullah Alrai
5 (2)
Presentazione dell'Indicatore Astronomico per MT4: Il tuo compagno di trading celeste definitivo Sei pronto a elevare la tua esperienza di trading a livelli celesti? Non cercare oltre, il nostro rivoluzionario Indicatore Astronomico per MT4 è qui. Questo strumento innovativo va oltre gli indicatori di trading tradizionali, sfruttando algoritmi complessi per offrirti intuizioni astronomiche senza pari e calcoli di precisione. Un universo di informazioni a portata di mano: Ammira un pannello compl
161.80 USD
L'indicatore Quadrato di Gann è uno strumento potente di analisi di mercato basato sull'articolo "Formula Matematica per le Previsioni di Mercato" scritto da W.D. Gann. Questo strumento utilizza concetti matematici e teorie di Gann per effettuare un'analisi precisa del mercato. Utilizza i quadrati di 144, 90, 52 e anche il quadrato di 9. Inoltre, integra il metodo del  per il quadrato di 9 e la sua relazione con canali e modelli stellari di quel quadrato. Manuale Utente e Applicazione: Prima di
133 USD
Questo indicatore funziona con la teoria delle onde di Elliott in due modi: Modalità automatica: In questa modalità, l'indicatore rileverà automaticamente le cinque onde motrici sul grafico in conformità alla teoria delle onde di Elliott. Fornirà previsioni e individuerà potenziali zone di inversione. Inoltre, avrà la capacità di generare avvisi e messaggi push per informare i trader sugli sviluppi importanti. Questa funzionalità automatica semplifica il processo di identificazione e analisi dei
88.20 USD
Indicatore del Modello di Candela Marubozu di ON Trade Il modello di candela Marubozu è un modello di candela potente e diretto che può fornire preziose informazioni sul sentiment di mercato e possibili inversioni di tendenza. Si caratterizza per una candela con una ombra molto piccola o inesistente (stoppino) in un'estremità e un corpo lungo che si estende nella direzione della tendenza prevalente. Questo modello rappresenta uno sbilanciamento forte tra acquirenti e venditori, suggerendo che l'
FREE
Scopri un approccio rivoluzionario al trading con l'Indicatore Shepherd Numerology Levels. Questo strumento innovativo combina la saggezza antica della numerologia con le moderne tecniche di trading per aiutarti a identificare livelli chiave di supporto e resistenza sui tuoi grafici. Utilizzando il metodo del quadrato del nove, questo indicatore offre una prospettiva unica sui meccanismi di mercato e ti consente di prendere decisioni di trading più informate. Principali Caratteristiche e Vantagg
88.20 USD
Shepherd Gann Squares Free
Abdullah Alrai
4.86 (37)
Questo indicatore è un metodo di analisi di mercato basato sull'articolo "Formula matematica per previsioni di mercato" scritto da W.D. Gann in base ai metodi del quadrato di nove e del quadrato di 144. Manuale d'uso: Add Your review And contact us to get it Puoi acquistare la versione completa di MT5 da: https://www.mql5.com/en/market/product/28669 Puoi testare su MT4 gratuitamente: https://www.mql5.com/en/market/product/15316 Questo prodotto può disegnare per te un quadrat
FREE
ON Trade Joker Levels
Abdullah Alrai
5 (1)
Indicatore di Supporto e Resistenza Basato sulla Numerologia per MetaTrader Introduzione: Scopri una nuova dimensione nell'analisi tecnica con il nostro Indicatore di Supporto e Resistenza Basato sulla Numerologia per MetaTrader. Questo strumento unico sfrutta la potenza della numerologia per identificare i livelli chiave di supporto e resistenza sui tuoi grafici, fornendoti preziose intuizioni sulle potenziali oscillazioni dei prezzi. Concetti Chiave: La Numerologia nel Trading: La numerologi
FREE
Introducing the Pivot Point Selector Indicator: Your Ultimate Tool for Custom Pivot Levels Are you ready to take your trading to the next level? Say hello to the Pivot Point Selector Indicator, a game-changing tool that puts you in control of your pivot levels. This innovative indicator empowers you to choose three specific points that will determine the pivot level calculations, giving you unparalleled customization and precision in your trading strategy. Key Features and Benefits: Custom Pivo
FREE
This indicator will detect harmonic patterns that are drawn on the chart by manual and automatic methods. You can see user manual from this link: https://www.mql5.com/en/blogs/post/719257 There is a free version (it detect only Gartley and Nenstar Patterns) to try this product. You can buy the full MT4 version from: https://www.mql5.com/en/market/product/104689 Notes When you use this indicator and change the settings, add indicators like Moving Average or Bollinger Bands, this indicator will
FREE
Questo indicatore ha lo scopo di rappresentare visivamente il canale Donchian sul tuo grafico di trading. Il canale Donchian è uno strumento tecnico semplice utilizzato per rappresentare l'intervallo tra il massimo più alto e il minimo più basso in un periodo specificato. Questo indicatore migliora l'analisi visiva dei movimenti dei prezzi, offrendo indicazioni sui potenziali punti di rottura e di continuazione della tendenza. Il canale Donchian può essere applicato sia all'unità di tempo attual
FREE
Presentazione dell'indicatore Maravilla Square: il tuo Assistente per il Trading Predittivo Scopri l'indicatore Maravilla Square, la tua chiave per il trading predittivo. Questo strumento unico offre intuizioni sulle inversioni dei prezzi e presenta una linea di tendenza che può essere regolata tra i punti alti e bassi. Dinamica della Linea di Tendenza: L'indicatore Maravilla Square introduce la linea di tendenza, che puoi adattare tra i punti alti e bassi nel grafico. Questa funzionalità dinami
FREE
L'indicatore di pattern di candele giapponesi Hikkake è uno strumento specializzato progettato per identificare e rilevare i Pattern di Azione dei Prezzi Hikkake che si stanno formando su un grafico. Questi pattern si basano sul concetto di una falsa rottura da una barra interna, che spesso porta a potenziali opportunità di trading. La principale funzione dell'indicatore è analizzare le ultime cinque candele sul grafico e determinare se esse presentano le caratteristiche del pattern Hikkake. Qua
30 USD
This indicator offers a comprehensive and efficient solution for traders seeking optimal entries in scalping strategies. Leveraging moving averages and stochastic indicators, it employs a systematic approach to identify favorable trade opportunities. The indicator goes beyond mere analysis, actively drawing clear and actionable entry points on your chart, denoted by arrows. Moreover, it provides the convenience of alerts to ensure you never miss these potential setups. Key Features and Benefits:
FREE
Presentazione dell'Indicatore Calcolatore del Prezzo del Grammo d'Oro Sei interessato a tenere sempre sotto controllo il prezzo dell'oro nella tua valuta locale? Non cercare oltre, l'Indicatore Calcolatore del Prezzo del Grammo d'Oro ti offre uno strumento innovativo che ti consente di calcolare in tempo reale il prezzo al grammo dell'oro nella tua valuta locale preferita. Con questo indicatore, puoi sfruttare le informazioni finanziarie per prendere decisioni informate. Caratteristiche Principa
FREE
ON Trade Pivots is A technical indicator that Draws all Pivot levels depending on time frame that defined in settings. Notes It will be good tool for all traders who use pivot levels in their trades. Let me inform you that this indicator draw this level as buffers not as objects then you can connect it easily to EA. This indicator allow you to find pivots levels for any time frame not only daily you are free to choose time frame from settings. Parameters Use_System_Visuals - Enable /Disable
FREE
"Questo indicatore è uno strumento semplice per la rilevazione delle tendenze. Puoi usarlo insieme alla tua strategia per ottenere buoni ingressi, come nella modalità di scalping. Disegnerà un canale intorno al prezzo, che si espanderà man mano che il tempo aumenta. In periodi personalizzati, tornerà al punto di partenza dell'espansione in base a un algoritmo che tiene conto del tempo e del prezzo insieme. Puoi acquistare al limite inferiore del canale dopo che sono visibili segni di inversione.
133 USD
Rsi Channel
Abdullah Alrai
5 (1)
This indicator displays the channel of Relative Strength Index. When you see that the price touches the red line and retreats from it many times, then you will know that the general trend is down. When it retreats from the blue line many times, that means that the general trend is up. This lines express the RSI values attributed to the price values on the main chart. You can add this indicator to your strategy, it will help you. This indicator will work best on 5 minutes and higher time frames.
38.20 USD
Strumento di Canale di Regressione". Utilizzando questo strumento, i trader possono ottenere un controllo eccezionale sul canale di regressione del proprio grafico, consentendo loro di prendere decisioni di trading più informate. Lo Strumento di Canale di Regressione è uno strumento potente nella cassetta degli attrezzi di un trader. È progettato per fornire preziose informazioni sulle tendenze dei prezzi e sui potenziali livelli di supporto e resistenza. Lo strumento è particolarmente efficace
1 000 USD
Presentiamo il nostro potente indicatore Forex progettato per migliorare la tua strategia di trading e fornirti informazioni precise sulle tendenze di mercato. Questo strumento innovativo utilizza un algoritmo personalizzato sofisticato che analizza minuziosamente le misurazioni delle candele, apportando regolazioni per ottenere una precisione ottimale. Il risultato? Un insieme di frecce accuratamente tracciate sul tuo grafico, che indicano punti di ingresso strategici. La genialità dietro a que
38.20 USD
Shepherd Gann Squares
Abdullah Alrai
4.9 (10)
Questo indicatore è un metodo di analisi di mercato basato sull'articolo "Formula matematica per previsioni di mercato" scritto da W.D. Gann in base ai metodi del quadrato di nove e del quadrato di 144. Manuale d'uso: Add Your review And contact us to get it Puoi acquistare la versione completa di MT5 da: https://www.mql5.com/en/market/product/28669 Puoi testare su MT4 gratuitamente: https://www.mql5.com/en/market/product/15320?source=Site +Profile+Seller#!tab=reviews Ques
133 USD
Questo indicatore è progettato per rilevare e visualizzare le onde diamantate di Gann, un modello specifico derivato dalla teoria di Gann. Fornisce ai trader una panoramica sulle potenziali inversioni di mercato tracciando punti (P) basati sui punti ABC del modello. Inoltre, l'indicatore traccia linee verticali dai punti previsti (P) per aiutare i trader a identificare più facilmente i punti potenziali di inversione. Funzionalità dell'indicatore: Use_System_Visuals: Questo parametro consente di
61.80 USD
"Questo indicatore rileva gli ingressi basati sulla teoria del modello Bystra e fornisce i valori di ingresso per inserire ordini limitati con livelli di destinazione e di stop. Ciò consente di calcolare la percentuale di rischio. Note: Questo indicatore dispone di buffer che ne consentono l'utilizzo negli Advisor Esperti (EA). È importante praticare una buona gestione del denaro durante il lavoro con questo prodotto. Quando cambi il tuo timeframe, L'indicatore salverà il template utilizzato nel
88.20 USD
L'indicatore "Fibo Star" è stato progettato per tracciare i fan di Fibonacci sotto forma di stelle sul tuo grafico. Questi fan di Fibonacci sono uno strumento potente per analizzare le variazioni dei prezzi e possono fornire intuizioni sui potenziali livelli di supporto e resistenza. Questo indicatore è dotato di un pannello di controllo user-friendly che mira a semplificare il processo di disegno e configurazione dei fan, risparmiando così tempo ed sforzi. Istruzioni per l'uso: Questo indicator
66 USD
L'indicatore "Forza delle Valute" è uno strumento potente progettato per fornire ai trader informazioni sulla forza relativa delle diverse valute sul mercato forex. Calcolando e rappresentando la forza di ciascuna valuta in base al proprio intervallo di tempo specificato, questo indicatore offre ai trader l'opportunità di identificare possibili occasioni di trading, in particolare quando sono osservate divergenze significative o incroci. Caratteristiche principali dell'indicatore: 1. Calcolo del
133 USD
Questo indicatore rileverà i pattern armonici disegnati sul grafico tramite metodi manuali e automatici. Aggiungi la tua recensione, per favore. Note: Questo indicatore ha un pannello di controllo e salverà ogni impostazione (grafico e timeframe). Puoi ridurlo per avere più spazio sul grafico e puoi premere il pulsante di chiusura per nascondere tutti i dati dell'indicatore sul grafico se preferisci lavorare con altri strumenti di analisi. Quando utilizzi questo indicatore e modifichi le imposta
88.20 USD
Indicatore Tecnico per la Rilevazione di Forti Pattern di Azione del Prezzo: Pin Bar, Inside Bar e Outside Bar Introduzione: Nel campo dell'analisi tecnica, i pattern di azione del prezzo fungono da indicatori vitali dei potenziali movimenti di mercato. Abbiamo sviluppato un sofisticato indicatore tecnico che semplifica l'individuazione di robusti pattern di azione del prezzo sui grafici. Il nostro indicatore è specializzato nella rilevazione di tre pattern essenziali: il Pin Bar, l'Inside Bar
38.20 USD
Unlock Hidden Insights with the Numerokh Indicator: Your Numerology-Based Support and Resistance Tool Introducing the Numerokh indicator, a revolutionary tool that brings the mystical world of numerology into the realm of trading. Imagine having the power to identify key support and resistance levels on your charts using the age-old wisdom of numerology. This indicator takes trading to a new dimension, offering you a unique way to analyze price movements and make informed trading decisions. Key
38.20 USD
Presentazione dell'Indicatore ON Trade Numerology Mirror: Rivelazione di Modelli di Inversione Nascosti attraverso la Numerologia Esplora una nuova dimensione nell'analisi tecnica con l'Indicatore ON Trade Numerology Mirror. Questo innovativo strumento sfrutta la saggezza antica della numerologia per identificare livelli chiave di inversione nei tuoi grafici. Riorganizzando i numeri in posizioni invertite, questo indicatore rivela modelli nascosti che hanno il potenziale per indicare inversioni
88.20 USD
Filtro:
a_sane3
522
a_sane3 2023.09.22 13:16 
 

L'utente non ha lasciato alcun commento sulla valutazione.

Sameer Haque
463
Sameer Haque 2023.09.10 16:06 
 

Highly accurate and very versatile. A great addition to my toolkit.

Rispondi alla recensione
Versione 1.1 2023.10.21
- improvements