• Overview
  • Reviews (2)
  • Comments
  • What's new

ON Trade Waves Patterns Harmonic Elliot Wolfe

5

Introducing ON Trade Waves Patterns Harmonic Elliot Wolfe, an advanced indicator designed to detect various market patterns using both manual and automated methods. Here's how it works:

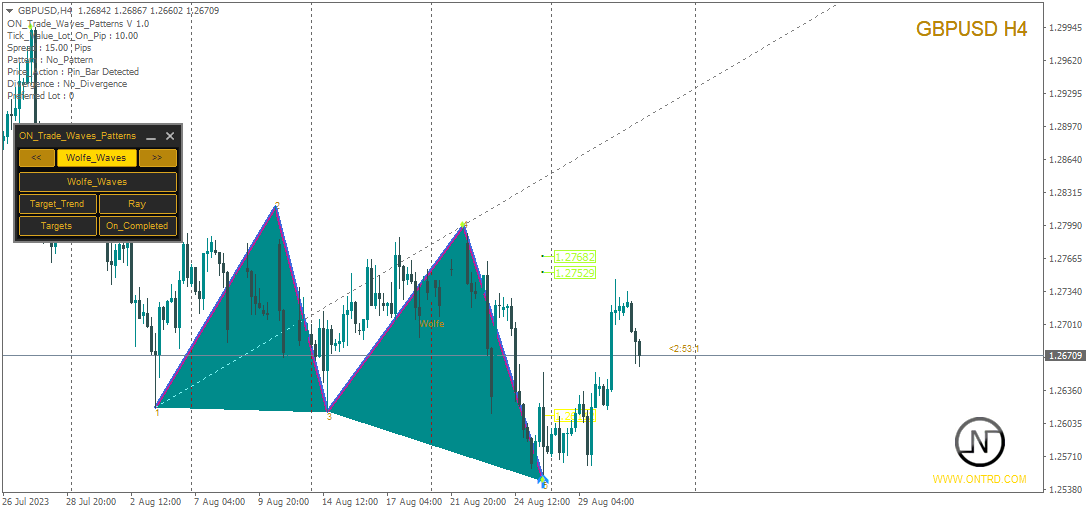
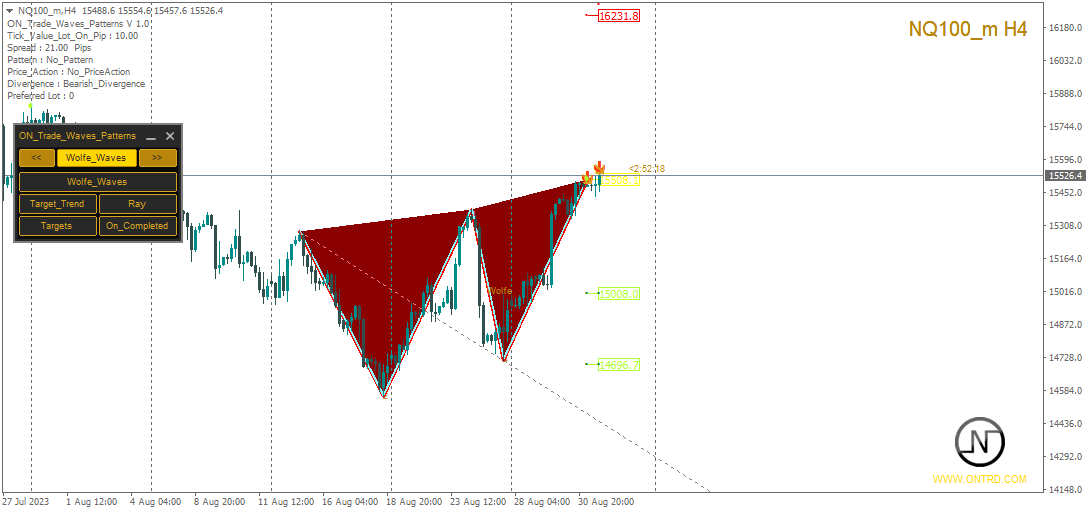
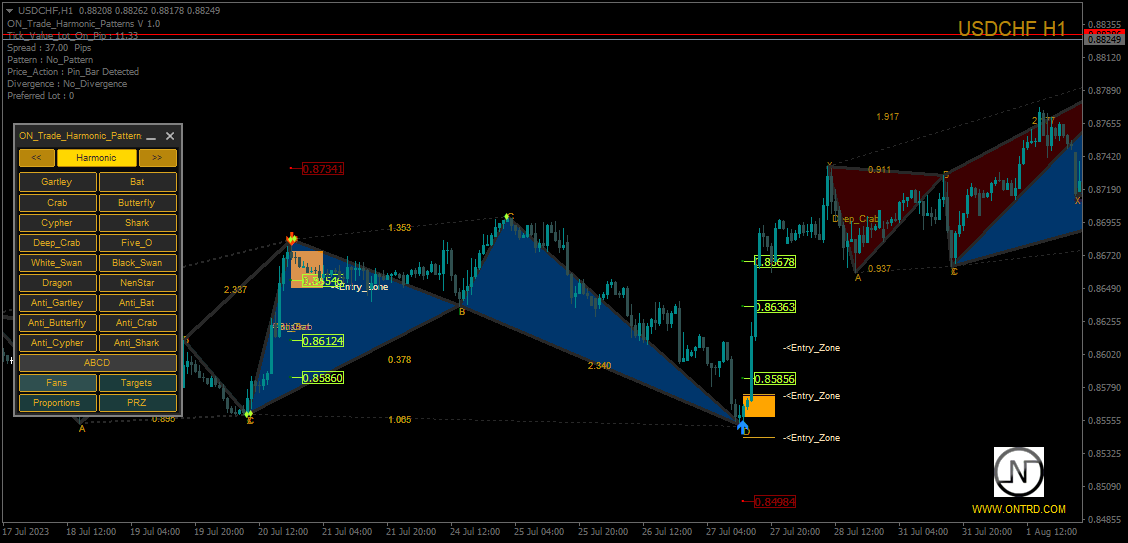
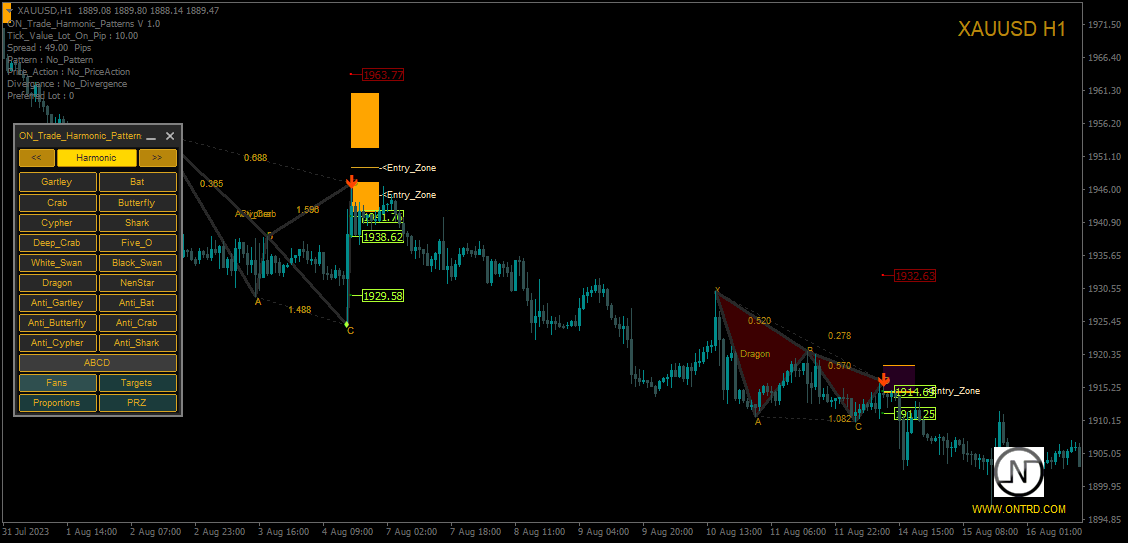
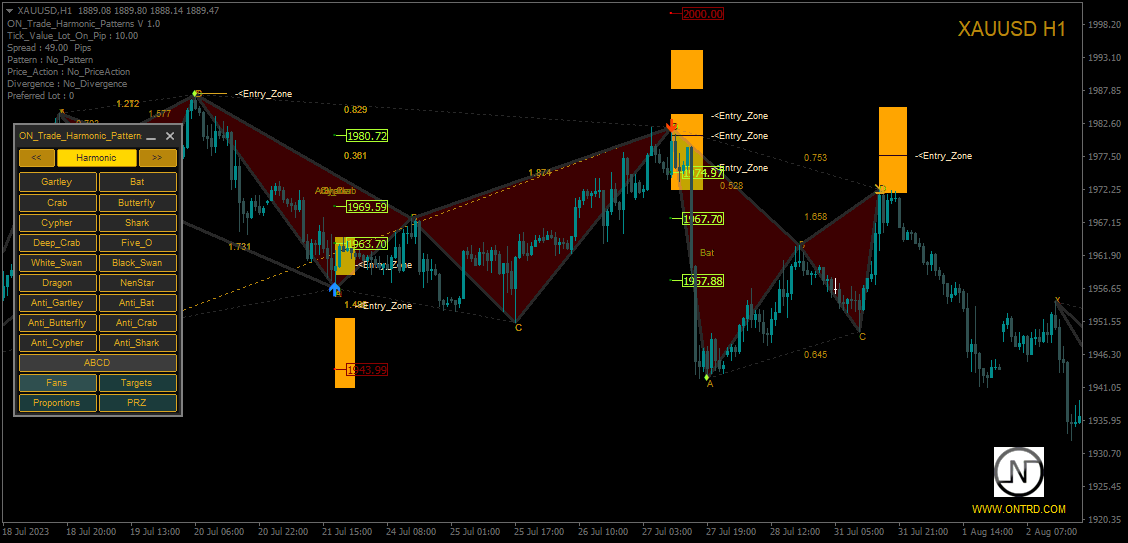
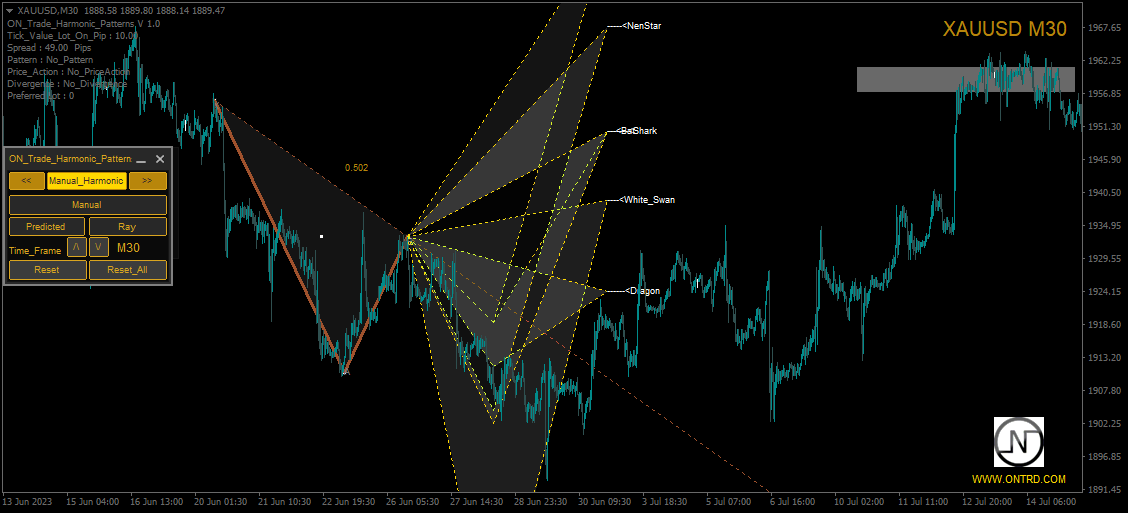
Harmonic Patterns: This indicator can identify harmonic patterns that appear on your chart. These patterns are essential for traders practicing harmonic trading theory, as popularized by Scott Carney's book "Harmonic Trading vol 1&2." Whether you draw them manually or rely on automated detection, ON Trade Waves Patterns has you covered.

Control Panel: We've equipped this indicator with a user-friendly control panel. It saves your chart and timeframe settings, allowing you to switch between different configurations effortlessly. You can even minimize it to maximize your chart space. If you prefer working with other analysis tools, a simple click of the close button hides all indicator data.

Template Saving: When you customize your settings or add other indicators like Moving Averages or Bollinger Bands, this indicator automatically saves your template. This means you can easily load your preferred settings whenever you need them.

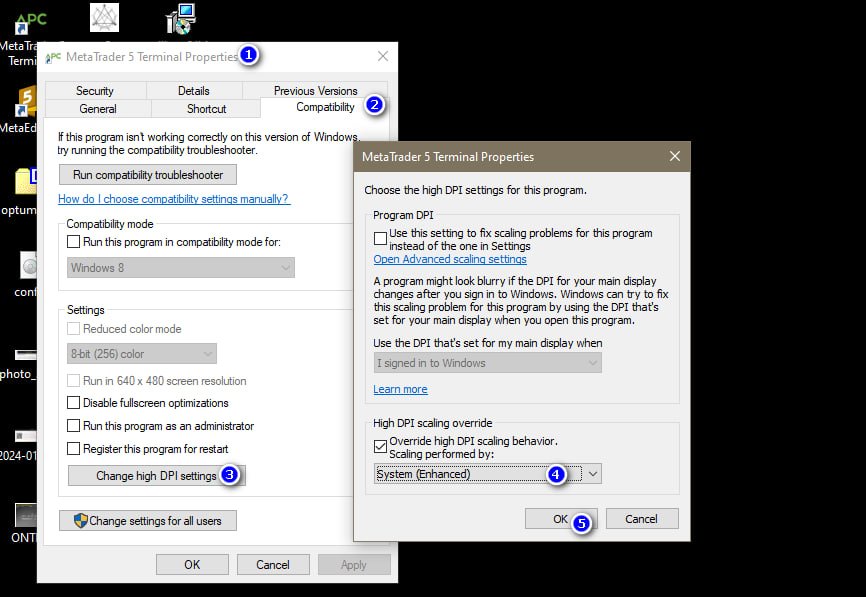
Optimized Display: For Windows 10 users, we recommend adjusting your DPI settings for the best screen experience on HD devices. Right-click on the MetaTrader icon, select Compatibility, then choose "Change High DPI Settings" and set it to "System (Enhanced)."

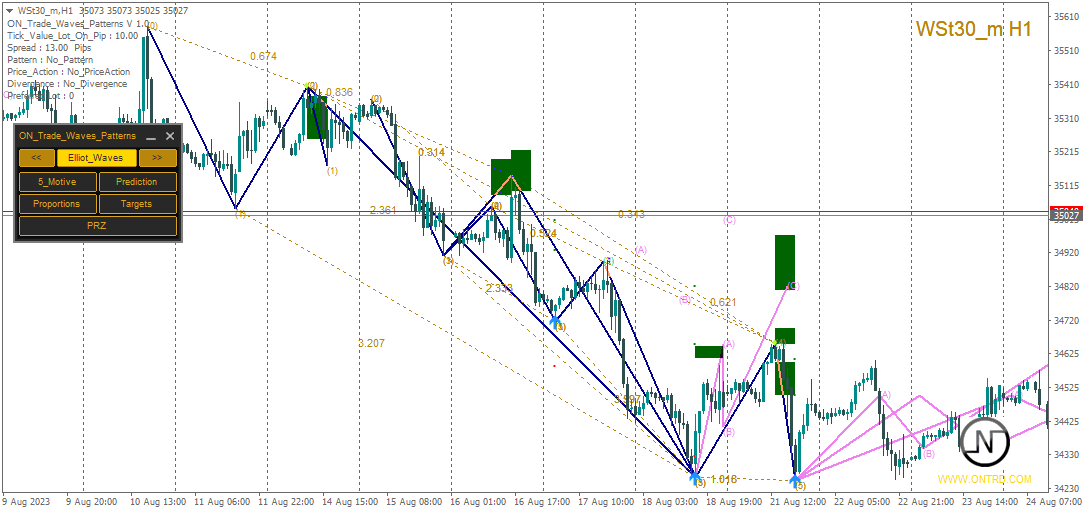
Additional Features: ON Trade Waves Patterns Harmonic Elliot Wolfe goes beyond harmonic patterns. It offers several other valuable features:

  • Price and time alert lines to keep you informed.
  • Fibonacci fans to complement your detected patterns.
  • Pivots, Camarella, and Patterns Ray for advanced analysis.
  • The ability to load manually drawn objects from higher timeframes into lower timeframes.
  • An alert and notification system that provides targets, stop levels, and entry points as signals.
  • Divergence detection with yellow and orange arrows for added confirmation.
  • Automatic lot size calculation for each pattern, helping you manage risk effectively.
  • Recognition of price action patterns like Pinbars, Inside Bars, and Outside Bars.

Integration with Expert Advisors (EAs): If you're into algorithmic trading, you can use this indicator's buffers in an EA by applying the provided code.

ON Trade Waves Patterns Harmonic Elliot Wolfe is your comprehensive tool for pattern recognition and analysis, offering a wide array of features to enhance your trading strategy.

Discover more about this powerful indicator by checking out our user manual [insert link]. Start maximizing your trading potential today!


Reviews 2
Sameer Haque
463
Sameer Haque 2023.09.10 16:06 
 

Highly accurate and very versatile. A great addition to my toolkit.

Recommended products
Introduction to X3 Chart Pattern Scanner X3 Cherart Pattern Scanner is the non-repainting and non-lagging indicator detecting X3 chart patterns including Harmonic pattern, Elliott Wave pattern, X3 patterns, and Japanese Candlestick patterns. Historical patterns match with signal patterns. Hence, you can readily develop the solid trading strategy in your chart. More importantly, this superb pattern scanner can detect the optimal pattern of its kind. In addition, you can switch on and off individu
250 USD
Elliott Wave Trend was designed for the scientific wave counting. This tool focuses to get rid of the vagueness of the classic Elliott Wave Counting using the guideline from the template and pattern approach. In doing so, firstly Elliott Wave Trend offers the template for your wave counting. Secondly, it offers Wave Structural Score to assist to identify accurate wave formation. It offers both impulse wave Structural Score and corrective wave Structure Score. Structural Score is the rating to sh
200 USD
Introduction to Harmonic Volatility Indicator Harmonic Volatility Indicator is the first technical analysis applying the Fibonacci analysis to the financial volatility. Harmonic volatility indicator is another level of price action trading tool, which combines robust Fibonacci ratios (0.618, 0.382, etc.) with volatility. Originally, Harmonic Volatility Indicator was developed to overcome the limitation and the weakness of Gann’s Angle, also known as Gann’s Fan. We have demonstrated that Harmonic
80 USD
ABCD Harmonic Patterns
Mehmet Ozhan Hastaoglu
Thanks to this indicator, you can easily see the new ABCD harmonic patterns in the chart. If the two price action lengths are equal, the system will give you a signal when it reaches the specified level. You can set the limits as you wish. For example, You can get the signal of the price, which occurs in the Fibonaci 38.2 and 88.6 retracements, and then moves for the same length, at the level you specify. For example, it will alarm you when the price reaches 80% as a percentage. In vertic
119 USD
Introduction Harmonic Patterns are best used to predict potential turning point. Traditionally, Harmonic Pattern was identified manually connecting peaks and troughs points in the chart. Manual harmonic pattern detection is painfully tedious and not suitable for everyone. You are often exposed under subjective pattern identification with manual pattern detection. To avoid these limitations, Harmonic Pattern Plus was designed to automate your harmonic pattern detection process. The functionality
98 USD
Introduction to Smart Renko The main characteristics of Renko Charting concern price movement. To give you some idea on its working principle, Renko chart is constructed by placing a brick over or below when the price make the movement beyond a predefined range, called brick height. Therefore, naturally one can see clear price movement with less noise than other charting type. Renko charting can provide much clearer trend direction and it helps to identify important support and resistance level
80 USD
Gartley Projection D
Oleksandr Medviediev
1 (1)
The indicator identifies the harmonic patterns (XABCD) according to developments of H.M.Gartley ( "Profits in the Stock Market" , 1935г). It projects D-point as a point in the perspective projection (specify ProjectionD_Mode = true in the settings). Does not redraw. When a bar of the working timeframe closes, if the identified pattern point has not moved during Patterns_Fractal_Bars bars, an arrow appears on the chart (in the direction of the expected price movement). From this moment on, the ar
1 000 USD
Auto Levels
Yaroslav Varankin
Auto Level this tool is able to determine the levels of support and resistance. search and display when the price has broken through the level and when it pushed off from it. the indicator can be useful if you use resistance support levels in your trading. or the highs and lows of the price, then it will greatly simplify your work and help you more quickly and more accurately determine the rebound or breakdown of the current trend or tendencies level. blue line bottom uptrend red line on top dow
500 USD
Introduction to Fractal Pattern Scanner Fractal Indicator refers to the technical indicator that makes use of the fractal geometry found in the financial market. Fractal Pattern Scanner is the advanced Fractal Indicator that brings the latest trading technology after the extensive research and development work in the fractal geometry in the financial market. The most important feature in Fractal Pattern Scanner is the ability to measure the turning point probability as well as the trend probabi
180 USD
Gold Phoenix
Yaroslav Varankin
The perfect tool for Scalng in the Forex markets You can trade both from signal to signal and using take profit  The algorithm does not use Zigzag!  No redrawing!  This is a channel instrument that uses a moving average as a filter. Moving Average  There are 2 parameters for the settings Ma Period = 5 period Moving Average  Channel 1.0 distance of channel lines from the chart Price Signal Filter - calculation of signal opening and filter There is a complete set of Alert There is a multi-timefram
400 USD
Reversal Pattern Pro
Boonyapagorn Rodvattanajinda
Reversal Patterns Pro Reversal Patterns Pro is a Price Action (PA) analytical tool that scans the reversal patterns.  - Finds and marks the most dependable Japanese candlestick patterns in real-time. - Supports all time frames (Best for Scalping) - Doesn't repaint making it an exceptional indicator for Expert Advisors. Input parameters : - Support & Resistance Mode ( true or false ) for enabling advanced filtering - Donchian Period - RSI Period - RSI Oversold Level - RSI Overbought Level - 
50 USD
BeST_Gann Swing Oscillator is an MT4 indicator that is based on the corresponding work of Robert Krausz who introduced it in the book “ A.W.D Gann Treasure Discovered ” . The Gann Swing Oscillator is a range-bounding technical indicator that oscillates between +1 and -1 and thus it describes the market swings. Generally when the market is in an upswing, the Gann Swing Oscillator describes it as 2 higher highs with the value of +1 while after an upswing, the downswing is expected. Also the do
35 USD
This indicator detects Inside Bar Narrow Range 4 and Inside Bar Narrow Range 7 two powerful patterns on 28 pairs on all timeframes.  "Inside Bar Narrow Range 4"  is an inside bar with the narrowest range out of the last 4 bars so "Inside Bar Narrow Range 7" an inside bar with the narrowest range  out of the last 7 bars. Hence, IBNR4 and better IBNR7 are an objective criterion for identifying  decreased range and volatility. Once we find an IBNR4 or an IBNR7 pattern, we aim to trade the breakou
179 USD
Monster Harmonic Indicator
Paul Geirnaerdt
4.61 (31)
Monster Harmonics Indicator is a harmonic pattern indicator. It recognizes Gartley, Bat, Crab, Butterfly, Cypher, White Swan, Black Swan, Shark and several other patterns. Projected patterns that are not yet completed are recognized, too. Monster even shows the PRZ (Potential Reversal Zone). Users can add their own user defined patterns to Monster. Besides the current pattern, Monster also shows all patterns in the symbols history. Monster will provide alerts for developing patterns. Introduced
79 USD
The reason why many traders new to using the Fibonacci retracement tool find it hard to effectively use it is because they are having trouble identifying swing points that are significant enough to be considered. Main Features Show Fibonacci number with LL to HH in multitimeframe Show 23.6,38.2,50,61.8,78.6,88.6,100,112.8,127.2,141.4,161.8,200,224,261.8,314,361.8 and 423 of Fibonacci number Easy to use with simple interface. Real time information for the Fibonacci number . Settings Global
99 USD
The indicator scans for Dinapoli thrust pattern in multiple timeframes for a specific market. Key Features Indicator can be used for all markets It can scan for thrust pattern on W1, D1, H4, H1, M30, M15 and M5 timeframes Ability to choose number of bars required above/below displaced moving average to define thrust Able to move display label on chart by single click Parameters Minimum Bars: Least amount of bars to account for Thrust DMA Period: Moving average period DMA Shift: Number or bars re
60 USD
AndInvest Impulse
Bruno Ravardiere De Oliveira Goncalves
Em uma negociação no Mercado Financeiro nada é mais importante que saber o momento certo de entrar em uma negociação. O AndInvest Impulse auxilia traders a capturar o momento exato de abrir uma negociação, para isto ele desenha topos e fundos facilitando a leitura do Price Action e após um breve momento de realização do mercado ele identifica o retorno da ponta compradora ou vendedora de força antecipada e sem repintura. Comprovação de Resultados: https://youtu.be/CA1_ZtZY0vk Funciona em qualque
300 USD
Introduction to Chart Pattern MT Chart Pattern MT is a chart pattern scanner to detect the triangle pattern, falling wedge pattern, rising wedge pattern, channel pattern and so on. Chart Pattern MT uses highly sophisticated chart pattern detection algorithm. However, we have designed it in the easy to use with intuitive user interface. Chart Pattern MT will show all the patterns in your chart in the most efficient format for your trading. You do not have to do tedious manual pattern detection an
180 USD
Candle EA MT4
Mansour Babasafary
5 (1)
This expert is based on patterns The main patterns of this specialist are candlestick patterns Detects trends with candlestick patterns It has a profit limit and a loss limit, so it has a low risk The best time frame to use this expert is M30 time frame The best currency pairs to use with this expert is the EURUSD, GBPUSD, AUDUSD, USDCAD currency pair Attributes: Can be used in the EURUSD, GBPUSD, AUDUSD, USDCAD  currency pair Can be used in M30, H1, H4 time frames Has profit limit and lo
249 USD
Trend lines master
The Trading Team Ltd
5 (1)
Launch promotion For a limited time only:  30$ instead of 157$ Summary Create precise trend lines in a second Description This indicator will draw your trend lines automatically with great precision, saving you some precious time. It uses Bill Williams Fractals to identify the key points and draws both inner and outer trend lines. Features Automatically draws precise trend lines
157 USD
PZ 123 Pattern
PZ TRADING SLU
3.75 (4)
The 123 Pattern is one of the most popular, powerful and flexible chart patterns. The pattern is made up of three price points: a bottom, a peak or valley, and a Fibonacci retracement between 38.2% and 71.8%. A pattern is considered valid when the price breaks beyond the last peak or valley, moment at which the indicator plots an arrow, rises an alert, and the trade can be placed. [ Installation Guide | Update Guide | Troubleshooting | FAQ | All Products ] Clear trading signals Customizable c
75 USD
The Raven Binary Options Indicator
Ellan Dirgantara Tholkhah
1 (1)
UPDATE: Works EXTREMELY well for EURJPY! --> more than 66% win rate monthly Guarantee! I want to introduce you the next-gen unique adaptive Binary options Indicator. This will destroy EURUSD & EURJPY The Raven is so sharp and efficient that it will pick the tops and bottoms of ANY type of market. Can also be used as a Forex Scalper. The Raven signal is based on multiple confirmation analysis. Gets confirmation from the most consistent signals known to man; Ichimoku, SMA, Bollinger Bands; and als
350 USD
Candle GAP
Thushara Dissanayake
The Candle GAP indicator is an essential tool for traders utilizing Gap Trading Strategies as it automatically identifies candle gaps for each day of the week. A gap refers to a price level difference between the close and open of two consecutive days. This indicator recognizes four types of gap patterns: Common, Breakaway, Continuation, and Exhaustion. By incorporating this indicator into any chart, traders can validate their signals and enhance their trading decisions. One of the key features
50 USD
This indicator Super Neuro Trend indicator.Indicator displays trend movement. Indicator helps to buy and sell. Features FiltPer- displays indicator period. deviation - displaus indicator deviation. Trend - displaus indicator trend.( true,false) Rectangle - displaus indicator rectangle. (true,false)  How to understand the status: If the trend color is green, trend is up. I f the trend color is red, trend is down. I f the trend waiting,trend waiting.     /////////////////////////////////////////
75 USD
This indicator is a perfect wave automatic analysis indicator for practical trading! 黄金实战 案例... The standardized definition of the band is no longer a wave of different people, and the art of man-made interference is eliminated, which plays a key role in strict analysis of the approach. Increase the choice of international style mode, (red fall green rise style) The  purchase discount is currently in progress! Using this indicator is equivalent to enhancing the aesthetics of the trading in
188 USD
Inside Bar Indicator MT4
Nedyalka Zhelyazkova
5 (12)
This inside bar indicator MT4  is suitable if you are doing inside bar trading. So what this MT4 inside bar indicator does is identifies inside bars for you as they form on your charts. Inside bar is a famous trading pattern in which the bar carry higher low and lower high compared with the previous bar, also known as mother bar. With, a lesser time frame like the 1 hour chart, daily inside bar chart will sometimes appears to be similar to a triangle pattern. Inputs AlertOn - enable alerts Ema
FREE
This Indicator is use the ZigZag to calculate the Upper and  Lower Bound and the uptrend and the downtrned. Red for downtrend, Green for uptrend and Yellow is for the horizontal trend this horizontal trend also bookmarked the upper limited and the lower limited the the price swings.  Or in simple the Support and the Resistance level. However, You may use the Heikin Ashi to confirm the trend of the buy sell signal above. I cannot guarantee the win rate, Nevertheless, you must study well the timef
1 000 USD
This dashboard shows the latest available  Harmonic Patterns  for selected symbols. Free Indicator : Basic Harmonic Pattern MT5 Version Columns Symbol Trend (Bullish/ Bearish) Pattern Type (Gartley/ Butterfly/ Bat/ Crab) Entry  (Entry Price) SL (Stop Loss Price) TP1 (1st Take Profit Price) TP2  (2nd Take Profit Price) TP3  (3rd Take Profit Price) Current (Current Price) Age (Age of pattern in Bars) Alert Settings (Set an alert if a new pattern is found) You can sort the dashboard by the column
99 USD
IDNR4 and 7 28 Pairs Radar
Francesco Petralla
5 (1)
This indicator detects IDRN4 and IDNR7 two powerful patterns on 28 pairs on new daily bar. IDNR4 is the acronym for "Inside Day Narrow Range 4" where "Inside Day" is a lower high and higher low than the previous bar and "Narrow Range 4" is a bar with the narrowest range out of the last 4 bars so "Narrow Range 7" out of the last 7 bars. Hence, ID/NR4 and better ID/NR7 are an objective criterion for identifying days of decreased range and volatility. Once we find an ID/NR4 or an ID/NR7 pattern, we
179 USD
Pivot Points Multi
Professoft Limited
Pivot Points Indicator Features: Send alerts when a pivot line is hit Displays Daily, Weekly, Monthly Indicators at the same time on the chart Restricting the time during the day when the alerts are sent Adjust the styling settings for the Pivot lines Settings: Show Daily Pivots Show Weekly Pivots Show Monthly Pivots Weekly Pivots Hit Notification Enabled Monthly Pivots Hit Notification Enabled Hit Check Frequency Time Restriction Enabled From Hour To Hour PP Color R1 Color R2 Color R3 Color S1
45 USD
Buyers of this product also purchase
Advanced Supply Demand
Bernhard Schweigert
4.91 (304)
CURRENTLY 26% OFF !! Best Solution for any Newbie or Expert Trader! This indicator is a unique, high quality and affordable trading tool because we have incorporated a number of proprietary features and a new formula. With this update, you will be able to show double timeframe zones. You will not only be able to show a higher TF but to show both, the chart TF, PLUS the higher TF: SHOWING NESTED ZONES. All Supply Demand traders will love it. :) Important Information Revealed Maximize the potenti
148 USD
CURRENTLY 26% OFF Best Solution for any Newbie or Expert Trader! This Indicator is a unique, high quality and affordable trading tool because we have incorporated a number of proprietary features and a new formula. With only ONE chart you can read Currency Strength for 28 Forex pairs! Imagine how your trading will improve because you are able to pinpoint the exact trigger point of a new trend or scalping opportunity? User manual: click here That's the first one, the original! Don't buy a worthle
148 USD
TrendMaestro
Stefano Frisetti
5 (1)
note: this indicator is for METATRADER4, if you want the version for METATRADER5 this is the link: TRENDMAESTRO recognizes a new TREND in the bud, he never makes mistakes. The certainty of identifying a new TREND is priceless. DESCRIPTION TRENDMAESTRO identifies a new TREND in the bud, this indicator examines the volatility, volumes and momentum to identify the moment in which there is an explosion of one or more of these data and therefore the moment in which prices have strong probability of f
397 USD
Currently 20% OFF ! Best Solution for any Newbie or Expert Trader! This dashboard software is working on 28 currency pairs plus one. It is based on 2 of our main indicators (Advanced Currency Strength 28 and Advanced Currency Impulse). It gives a great overview of the entire Forex market plus Gold or 1 indices. It shows Advanced Currency Strength values, currency speed of movement and signals for 28 Forex pairs in all (9) timeframes. Imagine how your trading will improve when you can watch the e
199 USD
FX Power MT4 NG
Daniel Stein
5 (2)
Trading GOLD, and currencies, with the dog walk strategy  - super smart Trading GOLD, and currencies, with the breakout strategy  - super easy Get your daily market update with details and screenshots via our Morning Briefing  here on mql5  and  on Telegram ! FX Power MT4 NG  is the next generation of our long-time very popular currency strength meter, FX Power.  And what does this next-generation strength meter offer? Everything you have loved about the original FX Power  PLUS GOLD/XAU str
169 USD
RelicusRoad Pro
Relicus LLC
4.84 (134)
How many times have you bought a trading indicator with great back-tests, live account performance proof with fantastic numbers and stats all over the place but after using it, you end up blowing your account? You shouldn't trust a signal by itself, you need to know why it appeared in the first place, and that's what RelicusRoad Pro does best! NOW $147 (increasing to $499 after a few updates) - UNLIMITED ACCOUNTS (PCs or MACs) **  User Manual + Strategies + Training Videos + Private Group with
147 USD
Cycle Sniper
Elmira Memish
4.41 (34)
NEW YEAR SALE PRICE FOR LIMITED TIME!!! Please contact us after your purchase and we will send you the complimentary indicators to complete the system . Cycle Sniper is not a holy grail but when you use it in a system which is explained in the videos, you will feel the difference. If you are not willing to focus on the charts designed with Cycle Sniper and other free tools we provide, we recommend not buying this indicator. We recommend watching the videos about the indiactor and system befor
199 USD
FX Volume
Daniel Stein
4.59 (34)
Get your daily market update with details and screenshots via our Morning Briefing  here on mql5  and  on Telegram ! FX Volume is the FIRST and ONLY volume indicator that provides a REAL insight into the market sentiment from a broker's point of view. It provides awesome insights into how institutional market participants, like brokers, are positioned in the Forex market, much faster than COT reports. Seeing this information directly on your chart is the real game-changer and breakthrough solu
249 USD
GOLD Impulse with Alert
Bernhard Schweigert
4.43 (7)
This indicator is a super combination of our 2 products  Advanced Currency IMPULSE with ALERT  and  Currency Strength Exotics . It works for all time frames and shows graphically impulse of strength or weakness for the 8 main currencies plus one Symbol! This Indicator is specialized to show currency strength acceleration for any symbols like Gold, Exotic Pairs, Commodities, Indexes or Futures. Is first of its kind, any symbol can be added to the 9th line to show  true currency strength accelerat
149 USD
MTF Supply Demand Zones
Georgios Kalomoiropoulos
4.83 (23)
Next Generation Of Automated Supply And Demand Zones. New and Innovative Algorithm that Works At Any Chart. All Zones Are Being Created Dynamically According To Price Action Of The Market. BIG PROMO OFFER --> Pay 1 and get 5 copies of "MTF SUPPLY DEMAND ZONES" indicator Activations will go from 5 to 25  (valid till the end of October) If you get the MTF Supply Demand Zones you can join the " Trade Like Me " Video Series. It contains 14 Live Sessions where  i am placing trades on Forex, Sto
149 USD
CFF Banks Liquidity
Abdalla Mohamed Kandil
CFF Banks Liquidity     Entry signals without repainting or delays     Error-free opening of trades     Provides signals for any direction sell & Buy Join Our Public Telegram Channel for latest updates and set files.   | Our Telegram Channel How does the CFF Banks Liquidity Works? Our CFF Banks Liquidity trading system based on a very accurate "Trend-Following" Trading Strategy. Here's how to Start using our System 1.      Buy and install the indicator in your terminal. Ask the guide.
313 USD
TPA True Price Action indicator reveals the true price action of the market makers through 100% non-repainting signals (except early signals mode) strictly at the close of a candle! TPA shows entries and re-entries, every time the bulls are definitely stronger than the bears and vice versa. Not to confuse with red/green candles. The shift of power gets confirmed at the earliest stage and is ONE exit strategy of several. There are available now two free parts of the TPA User Guide for our custo
168 USD
Scalping and Binary Signal Detector - Scalping indicator that gives directional signals for opening positions along the trend. The indicator is a complete trading system that can be used for Forex and binary options. The system of algorithms allows you to recognize intense price movements in several consecutive bars. The indicator provides several types of alerts for arrows. Works on any trading instruments and time frames (M5 or Higher recommended). How to use for trading The appearanc
159 USD
Price Action Entry Alerts
Stephen Sanjeeve Sahayam
5 (2)
This indicator screens every bar for buying or selling pressure and identifies 4 types of candle patterns with the highest volume. These candles are then filtered using several linear filters to show Buy or Sell signals. Signals work best, in conjunction with higher time frame direction and when traded during high volume hours. All filters are customizable and work independently. Can view signals of a single direction with the click of a button. This indicator also comes loaded with the most im
225 USD
Enigmera
Ivan Stefanov
5 (1)
ENIGMERA: The core of the market (Whatever you may require please message me) Introduction This indicator and trading system is a remarkable approach to the financial markets . ENIGMERA uses the fractal cycles to accurately calculate support and resistance levels. It shows the authentic accumulation phase and gives direction and targets.  A system that works whether we are in a trend or a correction.   How does it operate? ENIGMERA comprises of three lines: the support/resistance line, the ta
1 800 USD
Smart Ai Levels  Accumulation & Distribution indicator Smart Ai Levels are Ai controlled indicator which is based on Wyckoff Price cycle theory . It automatically scans the Accumulation & Distribution phases on chart and Ai draws the possible areas before Mark up and Mark down which acts as hot zones and can be traded with confirmation to catch those big price movements . It's a great tool for both Reversal and Breakout Trades suitable to all Trading Styles such as Scalping - Intraday - Swing 
249 USD
CS ATR FIBO CHANNELS MULTI TIMEFRAME Additional tool to trade with Cycle Sniper Indicator. Cycle Sniper :  https://www.mql5.com/en/market/product/51950 Indicator Draws Channels based on: - Cycle Sniper Price and Moving Averages - ATR Deviations - Fibonacci Retracement and Extensions Features: - Multi TimeFrame - Full alert and Notification options. - Simple Settings - Finds the trend change or extreme reversals. Inputs: - Arrow Mode: ATR Levels or Median Line   If Median Line is selected
140 USD
Gartley Hunter Multi MT4
Siarhei Vashchylka
4.67 (3)
Gartley Hunter Multi - An indicator for searching for harmonic patterns simultaneously on dozens of trading instruments and on all classic timeframes: (m1, m5, m15, m30, H1, H4, D1, Wk, Mn). Manual (Be sure to read before purchasing) | Version for MT5 Advantages 1. Patterns: Gartley, Butterfly, Shark, Crab. Bat, Alternate Bat, Deep Crab, Cypher 2. Simultaneous search for patterns on dozens of trading instruments and on all classic timeframes 3. Search for patterns of all possible sizes. Fr
149 USD
"Supply / Demand Zones" The concepts of supply and demand zones   are undoubtedly two of the most highly discussed attributes of technical analysis. Part of analysing chart of pattern , these terms are used by traders   to refer to price levels i n charts that tend to act as barriers, preventing the price of an asset from getting pushed in a certain direction. At first, the explanation and idea behind identifying these levels seems easy, but as you'll find out, supply and demand zones can co
199 USD
NNFX Strength System
Benjamin Joshua Nash
3 (1)
A complete NNFX algorithm in one indicator. NEW: Inbuilt backtester shows historical trade stats on the chart to show which pairs are most profitable. Don't be fooled. It's not enough to simply match a strong and weak currency to trade successfully with a strength meter, you need to know the intimate details of the relationship between two currencies. This is exactly what we've done with NNFX Strength, giving you all the information you need to make solid trading decisions. Years in the makin
150 USD
PTS Precision Index Oscillator V2
PrecisionTradingSystems
5 (1)
The Precision Index Oscillator (Pi-Osc) by Roger Medcalf of Precision Trading Systems First of all, if you have any questions please contact me via my website which you can find by searching the above title. Version 2 has been carefully recoded to be super fast to load up on your chart and some other technical improvements have been incorporated to enhance experience. Pi-Osc was created to provide accurate trade timing signals designed to find extreme   exhaustion points, the points that markets
147.50 USD
Volume by Price MT4
Brian Collard
5 (14)
The Volume by Price Indicator for MetaTrader 4 features Volume Profile and Market Profile TPO (Time Price Opportunity). Get valuable insights out of currencies, equities and commodities data. Gain an edge trading financial markets. Volume and TPO histogram bar and line charts. Volume Footprint charts. TPO letter and block marker charts including split structures. Positioning and styling options to suit the user's needs and context. Highlight Volume Profile and Market Profile TPO Point of Contro
259 USD
PZ Divergence Trading
PZ TRADING SLU
5 (3)
Tricky to find and scarce in frequency, divergences are one of the most reliable trading scenarios. This indicator finds and scans for regular and hidden divergences automatically using your favourite oscillator. [ Installation Guide | Update Guide | Troubleshooting | FAQ | All Products ] Easy to trade Finds regular and hidden divergences Supports many well known oscillators Implements trading signals based on breakouts Displays suitable stop-loss and take-profit levels Configurable oscill
249 USD
CyberZingFx Volume Plus
Afsal Meerankutty
4.93 (15)
Advanced version of CyberZingFx Volume Plus, the ultimate MT4 indicator for traders seeking highly accurate buy and sell signals. With an additional strategy and price action dot signals that enhances its effectiveness, this indicator offers a superior trading experience for professionals and beginners alike. The CyberZingFx Volume Plus Advanced version combines the power of volume analysis and historical price data with an additional strategy, resulting in even more precise and reliable signals
135 USD
Full STO
Roman Smoroda
Full STO indicator (includes all versions of three STO indicators: Premium, Gold, Silver) - STABLE TRADE OPTION is designed for automatic binary options trading.  READ CAREFULLY!!!!! IMPORTANT In one terminal create two templates with different expirations, a template for 18:01, 18:02 with expirations from 1 to 15 minutes and a template for 22:00 with expirations from 10 to 20 minutes. Winrate: 71% over the past 5 years Money management: 0.3% from the deposit This version of the indic
500 USD
TTM Squeeze indicator for MT4
Renaud Herve Francois Candel
TTM Squeeze Indicator TTM Squeeze is an indicator to time entries based on volatility. TMM Squeeze might well be one of the best and most overlooked indicator. It was created by famous trader John Carter and is also used by many traders like Nathan Bear. Why is the TTM Squeeze indicator important? Because in trading correct timing entries might be more important than picking the right direction.   This is a concept that is not very well understood in the trading community. Most trader think
147 USD
ECM Channel MT4
Paulo Rocha
3 (1)
ECM Elite Channel is a volatility-based indicator, developed with a specific time algorithm, which consists of finding possible corrections in the market. This indicator shows two outer lines, an inner line (retracement line) and an arrow sign, where the channel theory is to help identify overbought and oversold conditions in the market. The market price will generally fall between the boundaries of the channel. If prices touch or move outside the channel, it's a trading opportunity. The
250 USD
Hello Dear Trader, Today Im Telling You About The "Golden Scalp System V1 " Metatrader4 Golden Scalp System Scalper with EMA   This is a  Scalper strategy   based on ( Exponential moving average) EMA . Time frame: H1 Pair: EUR/USD, GBP/USD,AUD/USD XAU/USD Platform Mt4   Indicators for Scalper with Ema: 300  EMA (Exponential Moving Average) ; 500 EMA (Expontial Moving Average); Stochastic   (5,3,3)   Long Entry 1) 300  EMA   > 500  EMA . 2) Find significant levels of support. 3) Wait for
500 USD
Best Currency Strength Indicator
Tumelo Patrick Rakotsoane
4.54 (46)
Advanced Currency Strength Indicator The Advanced Divergence Currency Strength Indicator. Not only it breaks down all 28 forex currency pairs and calculates the strength of individual currencies across all timeframes , but, You'll be analyzing the WHOLE forex market in 1 window (In just 1 minute) . This indicator is very powerful because it reveals the true movements of the market.  It is highly recommended to  analyze charts knowing the performance of individual currencies or the countries ec
149 USD
PZ Support Resistance
PZ TRADING SLU
3.33 (3)
Tired of plotting support and resistance lines? This is a multi-timeframe indicator that detects and plots supports and resistance lines in the chart with the same precision as a human eye would. As price levels are tested over time and its importance increases, the lines become thicker and darker, making price leves easy to glance and evaluate. [ Installation Guide | Update Guide | Troubleshooting | FAQ | All Products ] Boost your technical analysis Customizable timeframe selection Read pri
149 USD
More from author
Download user manual from : https://ontrd.com/viewtopic.php?t=79&sid=b2da32a0245207ba0fe1740198f496c7 MT5 Version : https://www.mql5.com/en/market/product/30284 Gann Squares Indicator: Analyzing Markets with Geometric Patterns The Gann Squares indicator is a powerful tool for market analysis that draws upon the mathematical concepts introduced by W.D. Gann in his article on "Mathematical Formula for Market Predictions." This indicator incorporates Gann's techniques involving square numbers such
133 USD
Shepherd Harmonic Pattern
Abdullah Alrai
4.68 (59)
This indicator will detect harmonic patterns that are drawn on the chart by manual and automatic methods. You can see user manual from this link: Notes Indicator has control panel and it will save every (chart & timeframe) settings. You can minimize it to have more space on chart and you can press close button to hide all indicator data on chart if you prefer to work with other analysis tools  When you use this indicator and change the settings, add indicators like Moving Average or Bollinger
133 USD
ON Trade Optuma Astro
Abdullah Alrai
5 (2)
This is an astronomy indicator for the MT4 platform like optuma program that performs a variety of functions. It uses complex algorithms to perform its own calculations, which are so accurate. The indicator has a panel that provides astronomical information such as planets' geo/heliocentric cords, distance of sun/earth, magnitude, elongation, constellation, ecliptic cords, equatorial cords, and horizontal cords depending on  the vertical line that generated by the indicator depend on the time va
161.80 USD
Gann Squares Indicator: Analyzing Markets with Geometric Patterns The Gann Squares indicator is a powerful tool for market analysis that draws upon the mathematical concepts introduced by W.D. Gann in his article on "Mathematical Formula for Market Predictions." This indicator incorporates Gann's techniques involving square numbers such as 144, 90, and 52, as well as the Square of 9. Additionally, it incorporates  method for utilizing the Square of 9 in conjunction with channels and the star pa
133 USD
This indicator has been designed to integrate with the Elliott Wave theory, providing two distinct methods of operation: Automatic Work: In this mode, the indicator operates autonomously by detecting all five motive waves on the chart according to Elliott Wave theory. It offers predictions and identifies potential reversal zones. Additionally, it has the capability to generate alerts and push messages to notify traders of significant developments. This automated functionality streamlines the pr
88.20 USD
ON Trade Marubozu Candle Pattern Indicator The Marubozu candle pattern is a powerful and straightforward candlestick pattern that can provide valuable insights into market sentiment and potential trend reversals. It is characterized by a candle with a very small or non-existent shadow (wick) at one end and a long body extending in the direction of the prevailing trend. This pattern represents a strong imbalance between buyers and sellers, suggesting that the momentum in the market is heavily one
FREE
Introducing Shepherd Numerology Levels Indicator: Unlock the Hidden Patterns of Price Movement Discover a revolutionary approach to trading with the Shepherd Numerology Levels Indicator. This innovative tool combines the ancient wisdom of numerology with cutting-edge trading techniques to help you identify key support and resistance levels on your charts. By harnessing the power of the Square of Nine method, this indicator offers a unique perspective on market dynamics, allowing you to make mor
88.20 USD
Shepherd Gann Squares Free
Abdullah Alrai
4.86 (37)
Download user manual from : https://ontrd.com/viewtopic.php?t=79&sid=b2da32a0245207ba0fe1740198f496c7 Have full version from : https://www.mql5.com/en/market/product/104073 MT5 Version : https://www.mql5.com/en/market/product/30284 This indicator is a market analysis method based on the "Mathematical formula for market predictions" article written by W.D. Gann depending on square of 144 90 and 52 . And square of 9 With method by Dr.hamada salam about square of 9 and its relations with channel
FREE
This indicator serves the purpose of visually representing the Donchian channel on your trading chart. The Donchian channel is a straightforward technical tool used to depict the range between the highest high and the lowest low over a specified period. This indicator enhances the visual analysis of price movements, offering insights into potential breakout and trend continuation points. The Donchian channel can be applied to both the current time frame and a higher time frame, should you choose
FREE
This indicator will detect harmonic patterns that are drawn on the chart by manual and automatic methods. You can see user manual from this link: https://www.mql5.com/en/blogs/post/719257 There is a free version (it detect only Gartley and Nenstar Patterns) to try this product. You can buy the full MT4 version from: https://www.mql5.com/en/market/product/104689 Notes When you use this indicator and change the settings, add indicators like Moving Average or Bollinger Bands, this indicator will
FREE
ON Trade Joker Levels
Abdullah Alrai
5 (1)
Numerology-Based Support and Resistance Indicator for MetaTrader Introduction: Unlock a new dimension in technical analysis with our Numerology-Based Support and Resistance Indicator for MetaTrader. This unique tool leverages the power of numerology to identify key support and resistance levels on your charts, providing you with valuable insights into potential price movements. Key Concepts: Numerology in Trading: Numerology is the mystical study of numbers and their significance in our lives. A
FREE
Introducing the Pivot Point Selector Indicator: Your Ultimate Tool for Custom Pivot Levels Are you ready to take your trading to the next level? Say hello to the Pivot Point Selector Indicator, a game-changing tool that puts you in control of your pivot levels. This innovative indicator empowers you to choose three specific points that will determine the pivot level calculations, giving you unparalleled customization and precision in your trading strategy. Key Features and Benefits: Custom Pivo
FREE
Introducing the Maravilla Square Indicator: Your Predictive Trading Assistant Discover the Maravilla Square Indicator, your key to predictive trading. This unique tool offers insights into price reversals, featuring a trend line that can be adjusted between high and low points. Trend Line Dynamics: The Maravilla Square Indicator introduces the trend line, which you can adapt to high and low points on the chart. This dynamic feature creates a direct link between the indicator and price movements,
FREE
The Hikkake Japanese candle pattern is a specialized indicator designed to identify and detect Hikkake Price Action Patterns that are being formed on a chart. These patterns are based on the concept of a false inside bar break out, which often leads to potential trading opportunities. The indicator's main function is to analyze the last five candles on the chart and determine whether they exhibit the characteristics of the Hikkake pattern. When this pattern is confirmed, the indicator will draw
30 USD
This indicator offers a comprehensive and efficient solution for traders seeking optimal entries in scalping strategies. Leveraging moving averages and stochastic indicators, it employs a systematic approach to identify favorable trade opportunities. The indicator goes beyond mere analysis, actively drawing clear and actionable entry points on your chart, denoted by arrows. Moreover, it provides the convenience of alerts to ensure you never miss these potential setups. Key Features and Benefits:
FREE
Introducing the Gold Gram Price Calculator Indicator Are you interested in keeping a close eye on the price of gold in your local currency? Look no further than the Gold Gram Price Calculator Indicator, an innovative tool that empowers you with the ability to calculate the real-time price of gold per gram in your preferred local currency. With this indicator, you can harness the power of financial insights to make informed decisions. Key Features: Localized Gold Price: The Gold Gram Price Calcul
FREE
ON Trade Pivots is A technical indicator that Draws all Pivot levels depending on time frame that defined in settings. Notes It will be good tool for all traders who use pivot levels in their trades. Let me inform you that this indicator draw this level as buffers not as objects then you can connect it easily to EA. This indicator allow you to find pivots levels for any time frame not only daily you are free to choose time frame from settings. Parameters Use_System_Visuals - Enable /Disable
FREE
"This indicator is a simple trend detection tool. You can use it with your strategy to achieve good entries, such as in scalping mode. It will draw a channel around the price, which will expand as time increases. In custom periods, it will revert to the starting point of the expansion based on an algorithm that considers time and price together. You can buy at the lower boundary of the channel after signs of reversal become apparent. And you can sell from the upper boundary of the channel after
133 USD
Rsi Channel
Abdullah Alrai
5 (1)
This indicator displays the channel of Relative Strength Index. When you see that the price touches the red line and retreats from it many times, then you will know that the general trend is down. When it retreats from the blue line many times, that means that the general trend is up. This lines express the RSI values attributed to the price values on the main chart. You can add this indicator to your strategy, it will help you. This indicator will work best on 5 minutes and higher time frames.
38.20 USD
This indicator offers a robust market analysis method centered around the concept of the 'Regression Channel Tool'. By harnessing this tool, traders can gain exceptional control over their chart's regression channel, enabling them to make more informed trading decisions. The Regression Channel Tool is a powerful instrument in a trader's toolkit. It's designed to provide valuable insights into price trends and potential support and resistance levels. The tool is especially effective for visualizi
1 000 USD
Introducing our powerful Forex indicator designed to enhance your trading strategy and provide you with precise insights into the market trends. This cutting-edge tool employs a sophisticated custom algorithm that meticulously analyzes candle measurements, making adjustments for optimal accuracy. The result? A set of arrows expertly plotted on your chart, indicating strategic entry points. The genius behind this indicator lies in its ability to harness the power of candlestick patterns and comb
38.20 USD
Shepherd Gann Squares
Abdullah Alrai
4.9 (10)
Download user manual from : https://ontrd.com/viewtopic.php?t=79&sid=b2da32a0245207ba0fe1740198f496c7 MT5 Version : https://www.mql5.com/en/market/product/30284 This indicator is a market analysis method based on the "Mathematical formula for market predictions" article written by W.D. Gann depending on square of 144 90 and 52 . And square of 9 With method by Dr.hamada salam about square of 9 and its relations with channel and star of that square User Manual: Add Your review And contact us
133 USD
The indicator is designed to detect and visualize diamond Gann waves, a specific pattern derived from Gann theory. It provides traders with insights into potential market reversals by drawing points (P) based on the ABC points of the pattern. Additionally, the indicator draws vertical lines from the predicted points (P) to help traders identify potential reversal points more easily. Indicator Features: Use_System_Visuals: This parameter enables or disables the usage of the system's visual theme
61.80 USD
Indicator Description: The Bystra pattern indicator is designed to help traders identify trading opportunities using the Bystra pattern theory. The indicator provides entry values for placing limit orders, along with target and stop levels. This helps traders calculate their risk percentage, which is an essential aspect of proper money management in trading. Indicator Features: Use System Visuals: This option enables or disables the visual theme of the indicator, allowing users to customize its
88.20 USD
The "Fibo Star" indicator is designed to visualize Fibonacci Fans in a star-like pattern on your trading chart. These Fibonacci fans are a powerful tool for analyzing price movements and can offer insights into potential support and resistance levels. This indicator comes equipped with a user-friendly control panel, aiming to simplify the process of drawing and configuring the fans, thus saving you time and effort. Usage Instructions: This indicator is meant for manual usage. To effectively util
66 USD
The "Currency Strength Indicator" is a powerful tool designed to provide traders with insights into the relative strength of various currencies in the forex market. By calculating and plotting the strength of each currency based on its corresponding time frame, this indicator offers traders the opportunity to identify potential trading opportunities, especially when there are significant divergences or crossovers observed. Key Features of the Indicator: 1. Currency Strength Calculation: The ind
133 USD
Harmonic Patterns Indicator: Enhancing Harmonic Trading Analysis The Harmonic Patterns Indicator is a powerful tool designed to identify harmonic patterns on your trading chart using both manual and automatic detection methods. Main Features and Functions: Manual and Automatic Detection: This indicator empowers you to identify harmonic patterns through both manual and automatic methods. Whether you draw the patterns yourself or let the indicator do it for you, it's a versatile tool to enhance y
88.20 USD
Technical Indicator for Detecting Strong Price Action Patterns: Pin Bar, Inside Bar, and Outside Bar Introduction: In the realm of technical analysis, price action patterns serve as vital indicators of potential market movements. We've developed a sophisticated technical indicator that streamlines the identification of robust price action patterns on charts. Our indicator specializes in detecting three essential patterns: Pin Bar, Inside Bar, and Outside Bar. Key Patterns Detected: Pin Bar: The
38.20 USD
Unlock Hidden Insights with the Numerokh Indicator: Your Numerology-Based Support and Resistance Tool Introducing the Numerokh indicator, a revolutionary tool that brings the mystical world of numerology into the realm of trading. Imagine having the power to identify key support and resistance levels on your charts using the age-old wisdom of numerology. This indicator takes trading to a new dimension, offering you a unique way to analyze price movements and make informed trading decisions. Key
38.20 USD
Introducing the ON Trade Numerology Mirror Indicator: Unveiling Reversal Patterns through Numerology Unlock a new dimension in technical analysis with the ON Trade Numerology Mirror Indicator. This innovative tool leverages the ancient wisdom of numerology to identify key price reversal levels on your charts. By rearranging numbers in reversed positions, this indicator reveals hidden patterns that have the potential to signal significant price reversals, giving you a unique edge in your trading
88.20 USD
Filter:
a_sane3
522
a_sane3 2023.09.22 13:16 
 

User didn't leave any comment to the rating

Sameer Haque
463
Sameer Haque 2023.09.10 16:06 
 

Highly accurate and very versatile. A great addition to my toolkit.

Reply to review
Version 1.1 2023.10.21
- improvements