Guarda i video tutorial del Market su YouTube
Come acquistare un Robot di Trading o un indicatore
Esegui il tuo EA
hosting virtuale
hosting virtuale
Prova un indicatore/robot di trading prima di acquistarlo
Vuoi guadagnare nel Market?
Come presentare un prodotto per venderlo con successo
Indicatori tecnici a pagamento per MetaTrader 5 - 3

This indicator builds upon the previously posted Nadaraya-Watson Estimator. Here we have created an envelope indicator based on kernel smoothing with integrated alerts from crosses between the price and envelope extremities. Unlike the Nadaraya-Watson Estimator, this indicator follows a contrarian methodology. Please note that the indicator is subject to repainting. The triangle labels are designed so that the indicator remains useful in real-time applications.
Settings
Window Size: Dete

BUY INDICATOR AND GET EA FOR FREE AS A BONUS + SOME OTHER GIFTS! ITALO LEVELS INDICATOR is the best levels indicator ever created, and why is that? Using high volume zones on the market and Fibonacci the Indicator works on all time-frames and assets, indicator built after 7 years of experience on forex and many other markets. You know many levels indicators around the internet are not complete, does not help, and it's difficult to trade, but the Italo Levels Indicator is different , the Ital

As it name implies, this is an exaustion oscillator. However, you may wonder: what differs you from others oscillators like RSI, Stochastic, CCI etc? The difference is that ours is more powerful and accurate ! Your oscillator filters the nois e made by other oscillators, and shows you only the exact moment to enter the trade. Of course, using it alone, like any other indicator, has its risks. Ideally, reconcile it with technical analysis and/or others indicators. If you buy i t you ge t up to 1

Support And Resistance Screener è in un indicatore di livello per MetaTrader che fornisce più strumenti all'interno di un indicatore. Gli strumenti disponibili sono: 1. Screener della struttura del mercato. 2. Zona di ritiro rialzista. 3. Zona di ritiro ribassista. 4. Punti pivot giornalieri 5. Punti pivot settimanali 6. Punti pivot mensili 7. Forte supporto e resistenza basati sul modello e sul volume armonici. 8. Zone a livello di banca. OFFERTA A TEMPO LIMITATO: il supporto HV e l'indicatore

Percentile of Historical Volatility and Correlation Coefficient shows if the asset is cheap or expensive based on the volatility. It is used to determine a good entry point. It has two indicators built in: Historical Volatility is ranked percentile wise and its correlation to price action which gives an indication of the direction of a possible future move. Together the both indicators can give good entries and direction. Historical Volatility is a statistical measure of the dispersion of retu

Volality Index scalper indicator Meant for Volality pairs such as Volality 10, 25, 50, 75 and 100 The indicator works on all timeframes from the 1 minute to the monthly timeframe the indicator is non repaint the indicator has 3 entry settings 1 color change on zero cross 2 color change on slope change 3 color change on signal line cross Orange line is your sell signal Blue line is your buy signal.

Dark Absolute Trend is an Indicator for intraday trading. This Indicator is based on Trend Following strategy but use also candlestick patterns and Volatility. We can enter in good price with this Indicator, in order to follow the main trend on the current instrument. It is advised to use low spread ECN brokers. This Indicator does Not repaint and N ot lag . Recommended timeframes are M5, M15 and H1. Recommended working pairs: All. I nstallation and Update Guide - Troubleshooting

Royal Scalping Indicator is an advanced price adaptive indicator designed to generate high-quality trading signals. Built-in multi-timeframe and multi-currency capabilities make it even more powerful to have configurations based on different symbols and timeframes. This indicator is perfect for scalp trades as well as swing trades. Royal Scalping is not just an indicator, but a trading strategy itself. Features Price Adaptive Trend Detector Algorithm Multi-Timeframe and Multi-Currency Trend Low

The Trend Forecaster indicator utilizes a unique proprietary algorithm to determine entry points for a breakout trading strategy. The indicator identifies price clusters, analyzes price movement near levels, and provides a signal when the price breaks through a level. The Trend Forecaster indicator is suitable for all financial assets, including currencies (Forex), metals, stocks, indices, and cryptocurrencies. You can also adjust the indicator to work on any time frames, although it is recommen

ICT, SMC, Smart Money Concept, Support and Resistance, Trend Analysis, Price Action, Market Structure, Order Blocks, Breaker Blocks, Momentum Shift, Strong Imbalance, HH/LL/HL/LH, Fair Value Gap, FVG, Premium & Discount Zones, Fibonacci Retracement, OTE, Buyside Liquidity, Sellside Liquidity, Liquidity Voids, Market Sessions, NDOG, NWOG,Silver Bullet,ict template
Nel mercato finanziario, un'analisi di mercato accurata è cruciale per gli investitori. Per aiutare gli investitori a comprendere m

Introducing the Order Block Indicator , the pinnacle of trading technology. Order blocks, the large cluster of buy or sell orders placed by institutional traders, significantly influence market direction. They form at critical price levels and can act as robust support and resistance zones. Our cutting-edge indicator allows you to harness the full potential of these influential market dynamics, providing a never-before-seen level of precision and customization. Here's why this tool stands apart:

It is a MetaTrader 5 integrated drawing tool inspired on the "Pointofix" software. You can paint, make annotations and drawings on the chart in real time. It works in multiple timeframes, that is, the drawings can be visualized in different timeframes. The drawings are also saved in files and can be restored even on MetaTrader restarting.
Simple and Pratical
Chart Pen is designed as simple, beautiful and innovative way to create and manage all your chart analysis. There is no existing drawi

This is an advanced multi-timeframe version of the popular Hull Moving Average (HMA) Features Two lines of the Hull indicator of different timeframes on the same chart. The HMA line of the higher timeframe defines the trend, and the HMA line of the current timeframe defines the short-term price movements. A graphical panel with HMA indicator data from all timeframes at the same time . If the HMA switched its direction on any timeframe, the panel displays a question or exclamation mark with a tex

The Forex Master Pattern is an alternative form of technical analysis that provides a framework which will help you to find and follow the hidden price pattern that reveals the true intentions of financial markets. This algorithm here does a good job detecting the Phase 1 of the Forex Master Pattern cycle, which is the contraction point (or Value).
On Phase 2 we get higher timeframe activation (also called Expansion), which is where price oscillates above and below the average price defined

I've combined two trading strategies, the Order Block Strategy and the FVG Trading Strategy, by utilizing a combination of the FVG indicators and Order Blocks. The results have been surprisingly effective.
This is a two-in-one solution that makes it easy for traders to identify critical trading zones. I've optimized the settings so that all you need to do is install and trade; it's not overly complex to explain further. No need for any usage instructions regarding the trading method. You shou

Color Levels - удобный инструмент для тех, кто использует технический анализ с использованием таких инструментов, как Трендовая линия и Прямоугольник. Имеется возможность настройки двух пустых прямоугольников, трех закрашенных и двух трендовых линий. Настройки индикатора крайне просты и делятся на пронумерованные блоки: С цифрами 1 и 2 вначале - настройки пустых прямоугольников (рамок); С цифрами 3, 4 и 5 - настройки закрашенных прямоугольников; С цифрами 6 и 7 - настройки трендовых линий. Объ

Breakthrough Solution For Trend Trading And Filtering With All Important Features Built Inside One Tool! Trend PRO's smart algorithm detects the trend, filters out market noise and gives entry signals with exit levels. The new features with enhanced rules for statistical calculation improved the overall performance of this indicator.
Important Information Revealed Maximize the potential of Trend Pro, please visit www.mql5.com/en/blogs/post/713938
The Powerful Expert Advisor Version
Automa

40% off. Original price: $50 (Ends in May 15th) Advanced Bollinger Bands Scanner is a multi symbol multi timeframe Bollinger bands dashboard that monitors and analyzes the Bollinger Bands indicator from one chart. This panel scans the Bollinger bands indicator in up to 28 configurable instruments and 9 timeframes for price overbought/oversold, price consolidation (Bollinger bands squeeze), and consolidation breakout (squeeze break) with a deep scan feature to scan all market watch symbols (up

The iPump indicator is a versatile indicator that combines the advantages of three categories of indicators. simultaneous trend detection on several Timeframes defining zones of resistance and support determination of overbought and oversold zones Indicator functions: Defining a trend This function will be necessary for all traders who want to objectively assess the current market direction and avoid subjectivity. It will be clear and intuitive. Determination of support and resistance levels U

Royal Wave is a Trend-Power oscillator which has been programmed to locate and signal low-risk entry and exit zones. Its core algorithm statistically analyzes the market and generates trading signals for overbought, oversold and low volatile areas. By using a well-designed alerting system, this indicator makes it easier to make proper decisions regarding where to enter and where to exit trades. Features Trend-Power Algorithm Low risk Entry Zones and Exit Zones Predictions for Overbought and Over

This is a trend follwing indicator, where you can find signals, when there's a crossover between the lines. When current price is above the lines, you are on a long term situation and when price is below the lines, you are on a short one. Period of calculations can be edited. So, with this, if you add other indicators to filter bad signals, you can have a good profitable strategy.
The Donchian Channel Indicator helps to identyfy the market trend and the breakouts of the channel. Breaking above means the momentum of the market is highly bullish. Breaking below means the momentum of the market is highly bearish.
SETTINGS: PERIOD - default value 20. The number of last candles beeing taken into account when generating the line. OFFSET - default value 0. The percentage number that makes the channel bigger or smaller. LINE_COLOR - default color is set Blue. Here you can set w

A flexible 2-Line MACD indicator The default MACD indicator inside MT4, limits you to using the MACD with a fast-EMA, slow-EMA. This MACD indicator allows you to set your own MA-Method choices for these 2 components, separately! You can select from SMA, EMA, SMMA, LWMA, ADAPTIVE MA, FRACTAL MA, DEMA, TEMA, VARIABLE INDEX DYNAMIC MA, and can even use a separate method for each 2 fast-slow. The signal line has options from SMA-EMA-SMMA-LWMA. On-chart colored candles, with drawing condition types i

An indicator to show the current U.S. Dollar Index ( USDX , DXY , DX ). It is a weighted geometric mean of the dollar's value relative to the following select currencies: Euro (EUR), 57.6% weight. Japanese yen (JPY) 13.6% weight. Pound sterling (GBP), 11.9% weight. Canadian dollar (CAD), 9.1% weight. Swedish krona (SEK), 4.2% weight. Swiss franc (CHF) 3.6% weight.
You can request me to customize a similar indicator with weighted and currency pairs you desire. Just call me on MQL5, thank

KT Coppock Curve is a modified version of the original Coppock curve published in Barron's Magazine by Edwin Coppock in 1962. The Coppock curve is a price momentum indicator used to identify the market's more prominent up and down movements.
Features
It comes with up & down arrows signifying the zero line crossovers in both directions. It uses a simplified color scheme to represent the Coppock curve in a better way. It comes with all kinds of Metatrader alerts.
Applications It can provide

Analisi dei livelli di prezzo, statistiche avanzate, calcolo TakeProfit e 3 tipi di notifiche. Benefici: Non ridisegnare i risultati Segnale rigorosamente alla chiusura della candela Algoritmo di filtraggio dei falsi guasti Va bene con qualsiasi strategia di tendenza. Funziona su tutti gli strumenti e le serie temporali Manuale e istruzioni -> QUI / Risoluzione dei problemi -> QUI / Versione MT4 -> QUI Come fare trading con l'indicatore Fare trading con AW Breakout Catcher in soli tre

Тем, кто изучил книги Билла Вильямса "Новые измерения в биржевой торговле" и "Торговый Хаос (второе издание)" и пробовал торговать по этим методикам, становится ясно, что стандартного набора индикаторов недостаточно для полноценной работы. Индикатор Trading Chaos Map рисует "карту рынка", позволяя вам видеть графики так же, как автор трилогии. В параметрах предусмотрены опции включения и отключения каждого сигнала. Вы можете использовать ту или иную методику, либо использовать их вместе. Может

ADX indicator is used to determine the trend and its strength. The direction of the price is shown by the +DI and -DI values, and the ADX value shows the strength of the trend. If +DI is above -DI, then the market is in an uptrend, if on the contrary, it is a downtrend. If ADX is below 20, then there is no definite direction. As soon as the indicator breaks this level, a medium-strength trend begins. Values above 40 indicate a strong trend (a downtrend or an uptrend).
Multicurrency and multit

ChartSync Pro MT5 is an indicator, designed for the MetaTrader 5 trading terminals. It enables the trader to perform better multi-timeframe technical analysis, by synchronizing symbols and objects into virtually unlimited charts. Built by traders for traders! Telegram Premium Support - Dd you purchase the Chart Sync indicator and need a bit of help? Send us a screenshot with your purchase and your Telegram ID so we can add you to our premium support Telegram group.
The indicator has vario

The Missing Edge You Need To Catch Breakouts Like A Pro. Follow a step-by-step system that detects the most powerful breakouts!
Discover market patterns that generate massive rewards based on a proven and tested strategy.
Unlock Your Serious Edge
Important information here www.mql5.com/en/blogs/post/723208
The Reliable Expert Advisor Version
Automate Breakout EDGE signals using "EA Breakout EDGE" Click Here Have access to the game changing strategy that will take your trading to the n

50% off. Original price: $60 (Ends in May 15th) Support and Resistance zones indicator for MT5 is a multi-timeframe panel and alert that finds support and resistance zones and pivot points for all timeframes of MetaTrader 5 and gives alert when price has interaction with them. Download demo version (works on GBPUSD, EURJPY and NZDUSD symbols) Read the full description of scanner parameters in the blog page . Many unique features in one indicator: Integrating support and resistance zones and p

A head and shoulders pattern is a chart formation that resembles a baseline with three peaks, the outside two are close in height and the middle is highest. It predicts a bullish-to-bearish trend reversal and is believed to be one of the most reliable trend reversal patterns. It is one of several top patterns that signal, with varying degrees of accuracy, that a trend is nearing its end. [ Installation Guide | Update Guide | Troubleshooting | FAQ | All Products ] Clear trading signals Customiza

If you want to find good trading opportunities, then you must trade near the Trend Line. This allows you to have a tighter stop loss on your trades — which improves your risk to reward . But that’s not all… Because if you combine Trend Line with Support and Resistance, that’s where you find the best trading opportunities. Now you might wonder: “So when do I enter a trade?” Well, you can use reversal candlestick patterns (like the Hammer, Bullish Engulfing, etc.) as your e

Critical Zones è stato creato appositamente per i trader manuali alla ricerca di entrate nel mercato più accurate. Questo indicatore utilizza algoritmi avanzati per individuare le aree di interesse, calcolando i supporti e le resistenze più rilevanti sul grafico, nonché i loro breakout e retest. Questo indicatore può essere configurato per inviare avvisi e notifiche quando vengono rilevate opportunità di acquisto/vendita potenzialmente redditizie, consentendo ai trader di rimanere in cima all

- 50% off - Telegram group : https://t.me/+5RIceImV_OJmNDA0 MT4 version : https://www.mql5.com/en/market/product/84526?source=Unknown%3Ahttps%3A%2F%2Fwww.mql5.com%2Fen%2Fmarket%2Fmy
Master Pullback is a complete system that gives unique trading opportunities and a clear indication of the market: trend, signals as well as stop loss and take profit levels. This system has been designed to be as simple as possible and detects extreme overbought and oversold zones, support and resistance levels, a
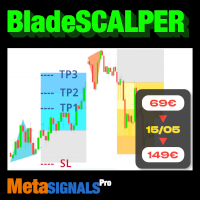
Ricevere un segnale della prossima mossa di inversione | Ottimizzare le statistiche del tasso di guadagno | Ottenere le zone che il prezzo testerà | Indicatore non tracciante e non ritardato - ideale per il trading manuale e automatizzato - adatto a tutti gli asset e a tutte le unità temporali 69$ per il lancio poi torna a >> 149 $ Dopo l'acquisto, contattatemi su questo canale per le impostazioni personalizzate. Versione MT4 : clicca qui | Ottenere il nostro metodo co

Boom and Crash Spike Detector v1.0 Boom and Crash spike detector prints Down non repaint Arrow for catching crash spikes and Up non repaint arrow for catching boom spikes. It is suitable for 1M time frame for majorly crash500 and Boom 500. When the Red arrow prints in a red zone moving averages, it indicates high probability of crash spikes downwards, likewise, blue arrow printing in a blue zone of moving average, it indicates high probability of boom spikes. Its pretty straight forward since

Fractal Advanced - displays Fractal and Alligator indicators on the price chart. Has wide options for settings and customization. It is also equipped with alerts and a hotkey system. Manual (Be sure to read before purchasing) | Version for MT4 Advantages
1. The indicator does not fill the entire chart with fractals, but allows you to display only relevant signals. 2. The number of fractals is adjusted by scrolling the mouse while holding down the Shift key. 3. Instantly show/hide the Alligator

** All Symbols x All Time frames scan just by pressing scanner button ** ***Contact me after the purchase to send you instructions and add you in "Swing scanner group" for sharing or seeing experiences with other users. Introduction: Swing Scanner is the indicator designed to detect swings in the direction of the trend and possible reversal swings. The indicator studies several price and time vectors to track the aggregate trend direction and detects situations in which the market is o

FXC iRSI-DivergencE MT5 Indicator
This is an advanced RSI indicator that finds trend-turn divergences on the current symbol. The indicator detects divergence between the RSI and the price movements as a strong trend-turn pattern.
Main features: Advanced divergence settings
Price based on Close, Open or High/Low prices Give Buy/Sell open signals PUSH notifications
E-mail sending Pop-up alert Customizeable Information panel Input parameters: RSI Period: The Period size of the RSI indicator.
R

Boom and Crash Gold miner v2 Trading indicator based on market momentum works on m1 for boom and crash 1000 and M5 time frame for normal trading pairs wait for blue arrow to appear plus change of candle stick color and candlesticks must be above the 2 modified moving averages then you can buy the market. wait for orange arrow to appear plus change of candle stick color and candlesticks must be below the 2 modified moving averages then you can sell the market.

The indicator displays volume clusters or volume profiles to choose from. For trading symbols which contain the tape of deals, the indicator can perform calculations based on the tape of deals.
Input variables
StepPoint - cluster step in points, if the value is zero, the step is assigned automatically. HistoryTicks - size of tick history (for VolumeType in the mode TimeAndSales). AssociatedTimeframe - binding the indicator to the specified timeframe of the chart, if the value is equal to

The Inversion Fair Value Gaps (IFVG) indicator is based on the inversion FVG concept by ICT and provides support and resistance zones based on mitigated Fair Value Gaps (FVGs). Image 1
USAGE Once mitigation of an FVG occurs, we detect the zone as an "Inverted FVG". This would now be looked upon for potential support or resistance.
Mitigation occurs when the price closes above or below the FVG area in the opposite direction of its bias. (Image 2)
Inverted Bullish FVGs Turn into P
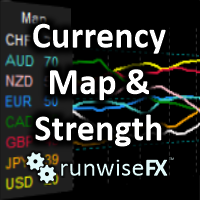
The first currency based indicator to draw a distinction between map and strength. The map shows the currencies in terms of oversold/overbought levels and gives the direction of travel. The currency strength calculates and shows the strength of that move. Alerts are included for changes in currency direction on the map (confirmed over two bars) and also when the strength reached the appropriate level. The currency map is useful for finding currency pairs to trade and in which direction. Look fo

Introduction to Sideways Market Analyzer Notable period of Low volatility and non-trending movements in the financial market is considered as Sideways Market. Sooner or later, the low volatility will increase and the price will pick up a trend after Sideways Market. In terms of trading point of view, Sideways Market can serve as the very good entry timing for traders. Sideways Market is also quite often the representation of accumulation of large orders from big investors. Therefore, knowing the

Supply or demand zones refer to price areas where a significant amount of supply or demand had previously entered the market, causing prices to either fall or rise. If the price returns to the demand or supply zone, it is likely to bounce off due to the large number of orders previously placed within the zone. These orders will be defended in these areas.
The Fair Value Gap (FVG) is a concept used to identify imbalances in the equilibrium of buying and selling. Fair Value Gaps are formed in a

Trade Assistant MetaTrader System — a multi-timeframe system that is based on three standard indicators: Stochastic oscillator , RSI (Relative Strength Index), and CCI (Commodity Channel Index). It displays current trend directions for M1, M5, M15, M30, H1, H4, D1, W1, and MN1 timeframes. When you follow such an indicator you have a clear picture of the trends across all important timeframes. It doesn't matter which timeframe you attach this indicator to.
Input parameters CheckCandl

BeST_Darvas Boxes is a Metatrader Indicator based on the trading method developed in the 50’s by the Hungarian Nicolas Darvas . BeST_Darvas Boxes indicator draws the Top and the Bottom of every Darvas Box that can be confirmed on the current Chart draws Buy and Sell Arrows for every confirmed Upwards or Downwards Breakout of the above levels draws always only after the bar closing and so is non-repainting or backpainting it can be used as a standalone trading system/method
Inputs
Basic Sett

Hai davvero un buon indicatore... ma vorresti che avesse avvisi? Trovi estenuante guardare da vicino un indicatore per vedere se ti ha dato un segnale? ... Allora, questo indicatore potrebbe fare al caso tuo!
Universal Alerts analizza uno degli indicatori del tuo grafico e fornisce avvisi quando danno un segnale, in base ai tuoi parametri. Dopo aver configurato questo indicatore, verrà visualizzata un'icona ogni volta che si verifica un segnale di acquisto/vendita e qualsiasi segnale successiv
This indicator scanning thorough the history and drawing horizontal rays on all bars untested lows and highs. Fresh supply/demand zones and support/resistance levels will be marked down. It allows to be sure that certain levels is fresh and has not been tested yet. Usually after strong departure price is not retesting base immediately and leaving unfilled orders. There is no inputs, so indicator is ready to go.

Ace Supply Demand Zone Indicator The concept of supply demand relies on the quantity mismatching between buying and selling volumes in the financial market. Supply and demand zone can provide the good entry and exit. A zone is easier to trade than a line. The supply demand zone can provide the detailed trading plan and the risk management. Its ability to predict market direction is high. There are two distinctive points about Ace Supply Demand Zone Indicator. Ace Supply Demand Zone indicator was

** All Symbols x All Timeframes scan just by pressing scanner button ** ***Contact me after purchase to send you instructions and add you in "RSI scanner group" for sharing or seeing experiences with other users. Introduction RSI divergence is a main technique used to determine trend reversing when it’s time to sell or buy because prices are likely to drop or pick in the charts. The RSI Divergence indicator can help you locate the top and bottom of the market. This indicator finds Regular diver

The DR IDR Range Indicator PRO plots ADR, ODR and RDR ranges for a given amount of days in the past. A key feature that appears is that it calculates the success rate of the ranges for the shown days. This indicator is perfect for backtest since it shows ranges for all of the calculated days, not just the most recent sessions. In the PRO version you can now: use fully customizable advanced statistics to base your trades on get an edge via calculating statistics on up to 3 different day period
The Breakout Indicator That Has Been Proven & Tested! Breakout Analyzer uses an advanced algorithm based on high probability price patterns. Each trade is analyzed on the statistics panel to help you evaluate the best breakout setups.
Bonus Strategy 1
Breakout Analyzer with Volume Critical Watch Video: (Click Here)
Bonus Strategy 2
Breakout Analyzer with Strength Meter
Watch Video: (Click Here)
Features Universal compatibility to different trading systems Analyzes statistics of breako

The indicator draws supply and demand zones. The zone timeframe can be set independently of the chart timeframe. For instance, it is possible to set M5 zones on an H4 chart. The importance of zones can be adjusted using the zone strength parameter. Demand zones are displayed if at least one candle in the range of the zone is entirely above the zone. Similarly, supply zones are displayed if at least one candle within the zone is entirely below the zone.

Questo cruscotto scopre e visualizza le zone di domanda e offerta sul grafico, sia in modalità scalping che a lungo termine, a seconda della vostra strategia di trading per i simboli selezionati. Inoltre, la modalità scanner del cruscotto vi aiuta a controllare tutti i simboli desiderati in un colpo d'occhio e a non perdere nessuna posizione adatta / versione MT4
Indicatore gratuito: Basic Supply Demand
Caratteristiche Consente di visualizzare le opportunità di trading su pi
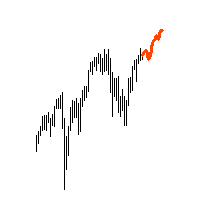
"AV Forecast MT5" is a preview or forecast indicator for MetaTrader 5, which draws forecast future price changes on the chart based on historical data. To do this, it primarily uses the everyday rhythm and the seasonality of the year. For timeframes below H1 closer dates can be selected. The lines for calculation can be made visible.
Settings:
- Draw line for x candles: draw x candles in the future
- Show all lines: yes/no
- Look back years or mixed (> H1 same): one year back or less b

Description Helps you detect the structure of the market, using different types of Smart Money concepts. This should help you to upgrade your trading strategy in every way. Smart Money Features: Color candle to signal the type of structure Shows CHOCH and BOS Equal Lows and Highs Order Blocks Internal and Swings Weak and strongs high and lows Fair Value Gaps High and Lows in daily weekly and monthly timeframes Premium and discount Zones KEY LINKS: How to Install – Frequent Questions - All

SMCpro MT5 Original Price $440 --- Currently Price 40% OFF ( for unlimited use ) Hello World! Introducing.. SMCpro tool and Indicator for MetaTrader 5 , a cutting-edge feature designed to revolutionize your trading experience. With innovative ICT Smart Money Concept, you gain unparalleled insight into market dynamics, empowering you to make informed trading decisions like never before. Built on the foundation of advanced algorithms and real-time data analysis, SMCpro tool and Indicat

What is the Volume Weighted Average Price (VWAP)? The volume weighted average price (VWAP) is a trading benchmark used by traders that gives the average price an instrument has traded at throughout the day, based on both volume and price. It is important because it provides traders with insight into both the trend and value of the instrument.
What is the Difference between VWAP and AVWAP? While VWAP is having as starting point the beggining of the day,week,month etc. in the AVWAP you can p

Un pattern grafico a triangolo simmetrico rappresenta un periodo di contrazione e consolidamento prima che il prezzo sia costretto a superare il rialzo o il crollo. Una rottura dalla linea di tendenza inferiore segna l'inizio di una nuova tendenza ribassista, mentre una rottura dalla linea di tendenza superiore indica l'inizio di una nuova tendenza rialzista.
Versione MT4 disponibile qui: https://www.mql5.com/en/market/product/68709/
Questo indicatore identifica questi modelli e ti avvisa q

The indicator shows divergence between the slope of lines connecting price and MACD histogram peaks or troughs. A bullish divergence (actually a convergence) occurs when the lines connecting MACD troughs and the lines connecting the corresponding troughs on the price chart have opposite slopes and are converging. A bearish divergence occurs when the lines connecting MACD peaks and the lines connecting corresponding price peaks have opposite slopes and are diverging. In such a case, the indicato

The indicator is a trading system for short-term trading.
Scalper Assistant helps to determine the direction of the transaction, and also shows the entry and exit points.
The indicator draws two lines (possible points for opening positions).
At the moment of the breakdown of the upper line up (and when all trading conditions are met), an up arrow appears (a buy signal), as well as 2 goals.
At the moment of the breakdown of the lower line down (and when all trading conditions are met), a do

Questo indicatore è progettato per rendere le revisioni di molti grafici su scale temporali diverse più rapide e più facili da eseguire. Tieni traccia di tempo e prezzo su più grafici Cambia simbolo su un grafico e anche tutti gli altri grafici dello stesso simbolo verranno modificati. Facile da usare, veloce da padroneggiare L'indicatore consente di identificare il prezzo e l'ora in cui si trova il puntatore del mouse sul grafico corrente, su tutti gli altri grafici aperti sullo stesso simbolo.

The Bheurekso Pattern Indicator for MT5 helps traders automatically identify candlestick pattern that formed on the chart base on some japanese candle pattern and other indicator to improve accurate. This indicator scans all candles, recognizes and then displays any candle patterns formed on the chart. The candle displayed can be Bullish or Bearish Engulfing, Bullish or Bearish Harami, and so on. There are some free version now but almost that is repaint and lack off alert function. With this ve

This indicator is designed to detect high probability reversal patterns: Double Tops/Bottoms with fake breakouts . Double top and bottom patterns are chart patterns that occur when the trading instrument moves in a similar pattern to the letter "W" (double bottom) or "M" (double top). The patterns usually occur at the end of a trend and are used to signal trend reversals very early. What this indicator detects: This indicator detects a special form of Double Tops and Bottoms, so called Double To

Professional Histogram MT5 ( PH ) is a highly efficient and reliable tool for determining the direction and strength of the trend. PH is easy to use and configure both for beginners and experienced traders. Unlike most indicators, Professional Histogram finds longer trends and gives fewer false signals. When a buy or a sell signal appears, an alert is triggered allowing you to open a position in a timely manner and avoid sitting at your PC all the time. Professional Histogram for the MetaTrad

Versione MT4 | Indicatore Valable ZigZag | FAQ La teoria delle onde di Elliott è un'interpretazione dei processi dei mercati finanziari che si basa sul modello visivo delle onde sui grafici dei prezzi. Secondo questa teoria, possiamo sapere esattamente quale tendenza sta prevalendo sul mercato, ascendente o discendente . L'indicatore Valable ZigZag mostra la struttura a onde del mercato e indica la direzione del trend principale al momento sul timeframe corrente. Per comodità,

Divergence indicator 10 different indicators. Finding and displaying classic and hidden divergences.
Indicators in which divergences are searched: MACD MACD Histogram; RSI; Stochastic; CCI; momentum; OBV; VWmacd; Chaikin Money Flow; Money Flow Index. This is a replica of the indicator from the tradingview resource, adapted for the MT5 terminal.
MT4 version available here: https://www.mql5.com/en/market/product/87846
Settings: Bars in history for analysis - number of bars for analysis

L'esaurimento dell'intervallo si verifica quando il prezzo raggiunge o supera l'intervallo previsto per il periodo corrente. A questi livelli, il prezzo inizia a perdere slancio rispetto all'inizio del periodo, quindi è un buon punto per assicurarsi di non assumere nuove posizioni. Questo indicatore ti mostrerà dove è probabile che ciò accada sul tuo grafico, mostrando i livelli per periodi giornalieri, settimanali e mensili. Quando vedi che il prezzo supera questi livelli di esaurimento, ti sta
MetaTrader Market - i robot di trading e gli indicatori tecnici per trader sono disponibili nel tuo terminale di trading.
Il sistema di pagamento MQL5.community è disponibile per tutti gli utenti registrati sul sito MQL5.com che effettuano transazioni su MetaTrader Services. Puoi depositare e prelevare denaro usando WebMoney, PayPal o una carta di credito.
Ti stai perdendo delle opportunità di trading:
- App di trading gratuite
- Oltre 8.000 segnali per il copy trading
- Notizie economiche per esplorare i mercati finanziari
Registrazione
Accedi
Se non hai un account, registrati
Consenti l'uso dei cookie per accedere al sito MQL5.com.
Abilita le impostazioni necessarie nel browser, altrimenti non sarà possibile accedere.