 MetaTrader 5
 Experts
 Indicatori
 librerie
 Utilità
 Widget
 Regole
Guarda i video tutorial del Market su YouTube
Come acquistare un Robot di Trading o un indicatore
Esegui il tuo EA
hosting virtuale
hosting virtuale
Prova un indicatore/robot di trading prima di acquistarlo
Vuoi guadagnare nel Market?
Come presentare un prodotto per venderlo con successo
Expert Advisors e Indicatori per MetaTrader 4 - 136
 I robot di trading eseguono le operazioni di mercato automaticamente, mentre gli indicatori permettono di analizzare al meglio le quotazioni e prevedere il comportamento dei prezzi. Con queste applicazioni, sarai in grado di eseguire operazioni in MetaTrader 4 in modo più consapevole, cogliendo più opportunità.
It is based on Multiple EMA indicators. The idea is that how to display multiple Exponential Moving Averages on the chart easily without placing them one by one. It has also BLUE-RED trend lips to define UPTREND and DOWNTREND whichas BLUE is UPTREND and RED is DOWNTREND.You can change the colors by going to Indicator properties --- colors. There are 2 external setting. They are Period and Shift. When you change them (period and or shift ) then all will automatically adjust. For any currency pair

The CSM System is currently fully automated with all the special features and functions, controlled and regularly monitored. Its evolution, parameters and the individual algorithms are professionally evaluated and optimized by experienced development group of programmers who are developing new updated versions of system. Unlike the other systems, we focused to create the system where the backtesting successful results matching the real life situation. Our core lies in identification of these bi

The idea of the indicator is based on the ZigZag indicator using a new equation with the addition of volume.
Inputs InpDepth — Depth. InpDeviation — Deviation. InpBackstep — Backstep. Enable_Alert — audio and text notifications on a trend change. Send_Notifications — push notifications to mobile devices. E-mail alert — email notifications. Make sure to configure email parameters in the terminal settings.
Features The indicator does not repaint. The indicator does not recalculate. The indicator

The BuySellArrows is a seemingly simple and persistent indicator. All traders had come across indicators that contain numerous input parameters that will change Buy and Sell position when you change those parameters value. Many traders asked what parameter's value will be more accurate. So, I decided to make an universal indicator without any input parameters. In this case you will have very stable indicators without any worries that you put some wrong numbers. This indicator will show Buy (colo

Ants Lite ATR allows you to enter and manage your trades based on the market volatility, giving you safer entries and better exits. Based on the work by Daryl Guppy.
Features Ability to define the bar the Long and Short calculation starts from. Can be used to generate both entry or exit signals. Customizable ATR period and multiplier. GMMA is a tried and tested indicator with a long pedigree. Volatility based entry and exit signal rather than time based.
How To Use Simply drag the indicator fr
DYJTRENDWAVE features an advanced algorithm that detects new trends and current trend continuations for use as an entry strategy. DYJTRENDWAVE's volatility is based on the power of buyers and sellers, it grabs total body size of candles and identifies the battle between buyers and sellers as a percentage of the total volume, like Sellers: (-)100% and Buyers: (+)100%. This information can be used for any entry and exit strategy. For bullish/Long Pin bar it is below the price line, for bearish/Sho
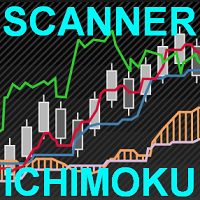
This scanner is a tool used to support trading with the Ichimoku method. Its basic features are: 10 trading setups implemented in accordance with the Ichimoku technique, the possibility of simultaneous scanning, all financial instruments available on the platform, the possibility of simultaneous scanning, in all timeframes available on the platform, two trading modes available: Manual and AutoTrading, the ability to open in Manual mode from the level of the chart, the ability to determine the si
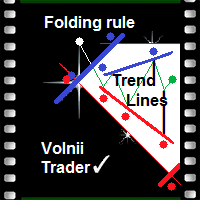
Folding rule of 4 trend lines The indicator has been created based on the "Folding rule" trading strategy. It shows four pairs of inclined resistance and support lines. These lines are plotted based on the nearest High and Low of the ZigZag technical indicator with four given input parameters. The indicator draws dots above and below the price extremums that have been used for plotting the trend lines. The indicator of trend lines facilitates the plotting of trend lines, channels and technical p

This indicator is different from the conventional indicator by an additional set of parameters. The ADX line changes color depending on the location of the +DI and -DI lines relative to each other.
Indicator Inputs Period — indicator calculation period; Method — select the averaging method: simple, exponential, smoothed, linear-weighted; Apply to — select the applied price: Close, Open; High; Low; Median; Typical; Average Weighted; By default, the directional lines are colored in the following

Endeavor EA does not use indicators. It trades the strategy based on trading by hours and the breakout of support and resistance levels. Logic of the EA: it trades during the active phases of the Asian, European and American sessions and allows you to capture almost all the daily trend. It analyzes the history and places pending orders to follow the market direction in case of a breakout. The EA provides the options to close orders by profit or by time. When the price moves in the favorable dire

The market is constantly fluctuating and almost always gives a roll-back of 5-20 points. If you look closely at the chart, you can see that the price never goes up or down without rollbacks. Thus, these small fluctuations can be earned if you collect a profit on each roll-back of 10 points. This EA was written a long time ago and today I want to share it with нou. When testing, the robot showed excellent results and in two months, the deposit was increased almost 10 times. I constantly took prof

NN8D Points is one of the indicators included into NN8D ( N ikolsky's N esting D oll) trading system. NN8D Points is an indicator containing multiple tools for analyzing Forex market: candle analysis and area system. Rather than simply averaging by Open, Close, High and Low prices, NN8D Points performs a complex analysis of the current and previous bars by various parameters: bar color; bar body size; bar wicks; bar core (average value between Open and Close, as well as between Lows and Highs);

Supporta is a trading indicator that automatically identifies support and resistance levels and their strengths from price movements and draws them on price charts. The instrument supports both the MetaTrader 4 and MetaTrader 5 terminals and can be used on any financial instrument and any timeframe. The MetaTrader 5 version is available on the market as Supporta MT5 . For full documentation and quick start, please refer to the official guidebook which is available for download in the comments se

This indicator displays Bollinger Bands signals for multiple symbols and multiple time frames. The signals are created as a simple ratios which represent the distance between the current price and the moving average measured in standard deviations. This way we create a very versatile and easy to use indicator which helps us to identify not only the strongest trends but also the most overbought and oversold conditions.
Features Accurate signals in real time for multiple time frames and multiple

The Expert Advisor algorithm determines on daily charts those candlestick patterns, which set the intraday trading direction. The trading EA determines how long the price is moving in overbought/oversold zones and starts working in the direction of the expected trend movement. Each position is accompanied with a tight stop loss and take profit. Only one active position can be open in the market. The EA was developed and tested using 99% quality quotes. The Expert Advisor has a built-in news filt
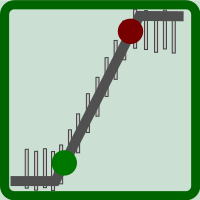
This indicator serves to depict the beginning of the trend (these are the green and red points of the graph). It is called simple because there are very few setup parameters, but it is essentially a set of rules - it is used a combination of WATR and a set of MAs. By combining their readings, it determines the direction of the trend.
How to use When there are green points on Main line of indicator, the trend direction is UP and you can BUY. When there are red points on Main line of indicator, t

NN8D Volume is one of the indicators included to NN8D trading system ( N ikolsky's N esting D oll). NN8D Volume displays a trend direction sorting out the market noise and keeping trades even during main trend corrections. Buy checklist: Bulls on the current bar and preferably on the previous one. NN8D Volume line should go up moving away from Bulls points, showing a bullish trend and increase in volatility. Current bar - Buy (an open price is below a close one). Sell checklist: Bears on the cur
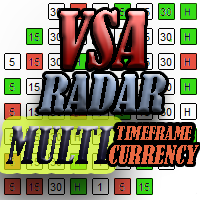
The panel works as a filter, finding patterns based on the Volume Spread Analysis technique. Search is carried out for selected trading instruments and all available timeframes. It is possible to add and remove instruments. Clicking the signal button allows you to quickly move to the chart with the identified pattern and timeframe. It can also search in history (by previous bars) with the buttons "<<" and ">>". The panel can be scrolled using the "UP" and "DOWN" keys.
Input parameters Basic Set
ForexAurum Fibonacci indicator is a useful tool for traders who are using Fibonacci combined with the ZigZag indicators. It uses the real-time calculation of the levels for all the timeframes and displays the results for you. In addition, you can setup RSI, ADX and Stochastic indicators to confirm entries.
How to use it Just drag and drop the indicator on an 1 minute chart of any symbol. Then you can switch to a higher timeframe at anytime after the initialization.
Recommendation Always drag a

Trends Hunter Expert Advisor is designed for medium-term trading. It is not a martingale and it does not depend on an account type (ECN, STP etc.) or spread level. This is a fully automated EA that features a custom algorithm for recognizing the price action and origination of a trend. If the EA identifies the beginning of a trend, one trade is opened. If a trend continues, the EA adds to the position. The number of addings is adjusted by the settings.
Options
Lots - fixed lot size; EMA1/EMA2 p

This is a multi-strategy EA. In the night scalping mode, the filters filter a trend-free range market environment and trades are placed in the opposite direction at the edges of the range. With an additional main trend filter in the trend-following mode, you can also trade pull-backs during longer trends on same houers or days. A detailed description of SpotLight EA can be found in the SpotLightBlog and a live monitoring here: If you have any question about the product, please contact me.
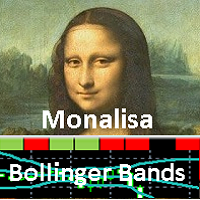
" MONALISA (acronym of MON itor A nd LIS t A ll) Bollinger Bands" is an indicator based on the Bollinger Bands indicator on all timeframes of any Currency Cross Pair. The indicator shows all Timeframes (from M1 to MN1) and colors in GREEN or RED that Timeframe that results in BUY or SELL based on the Bollinger Bands indicator. In addition, this indicator measures the " POWER " of the Trend that is highlighted on the middle line of the Bollinger Bands (SMA line) and in the table of Timeframes wit

Genio Scalp is an Expert Advisor that follows the trend. It uses some simple setting. This EA analyzes the trend using the Moving Average indicator on multiple timeframes, combined with mathematical functions. If the main trend on the market is "buy" and the trigger signal also recommends to "buy", then the EA will execute the "buy transaction". And vice versa. Furthermore, this EA can also use Autolot calculation. By default, as protection, the Stop Loss is set in a tight points. This EA is rec
The principle of this indicator is very simple: detecting the trend with Moving Average, then monitoring the return point of graph by using the crossing of Stochastic Oscillator and finally predicting BUY and SELL signal with arrows, alerts and notifications. The parameters are fixed and automatically calculated on each time frame. Example:
If you install indicator on EURUSD, timeframe M5: the indicator will detect the main trend with the Moving Average on this timeframe (for example the Moving

ForexGumpUltra is a new and more advanced indicator of the ForexGump series. This indicator easily determines the price direction on any currency pair and any timeframe. The indicator draws its signals on the zero bar and does not redraw them (see the video). In the 34th second of the video it can be seen that this indicator uses new filters to determine the changes in price movement direction without delay, despite the market noise present at the moment (see the video on the 34th second). Once

The Analytic Trade indicator is a complete trading system. It consists of 4 parts: The first part is the arrows showing the most optimal points for opening and closing orders. The up arrow is a buy signal, the down arrow is a sell one. The second part is the information panel in the upper right corner. The current price is shown in a larger font, above it are: the daily High, distance from the current price to the daily High, and the difference between the High and Low (in points). Below it are:

The indicator helps you trade following the VSA (Volume Spread Analysis) and PRICE ACTION methods, as well as study these methods from a perspective. The indicator searches for VSA and PRICE ACTION patterns considering the current trend. It is possible to view the patterns of the higher timeframe on the current timeframe chart. The custom mode allows you to find your patterns based on VSA method. Also, there is a volume histogram that automatically configures the width and visual horizontal leve

PriceChannel is designed for trend detection without the effect of accidental price leaps. It uses Price Series and a few moving averages for noise reduction. It works on multiple timeframes, even M1. To increase effectiveness, it is recommended to use 3 instances of PriceChannel with different parameters on one chart (see screenshots). You can use the following settings (for M1 charts): PriceChannel(10,2,30) Gold colour. PriceChannel(10,5,30) Blue colour. PriceChannel(21,8,13) Gray colour. Exa

Trend-Scanner is an indicator for MetaTrader 4 that allows you to view 3 types of trends and signals on the charts. Trend-Scanner searches for 3 types of trading signals on all the underlying assets listed in the settings (and can be customized by the trader). If there are conditions that allow you to identify reliable trends then a pop-up alert will be displayed, a sound notification and a push notification will be sent. Trend-Scanner constantly searches for signals deriving from patterns devel
This indicator is based on the Bollinger Bands on one or more timeframes and on any Currency Cross Pair. The indicator generates an alert message when it detects a buy or sell signal. It also draws a vertical bar on the price chart: green for buy or red for sell, white if flat. Alert messages and Vertical bars for BUY or SELL, are generated when the Bollinger Bands is consistent for all chosen timeframes else a FLAT signal is generated. In addition, the Multi TimeFrames Bollinger Bands Signals i
It is a tool for technical analysis. It allows you to make measurements: Fibo, including the search for clusters Fibo levels (by the DiNapoli method) Overbalance Trend line Selecting S/D levels
Input parameters Trend_Color - color of the trend line Trend_Width - width of the trend line Trend_info - if true, along with the trend line additional information is displayed (low, high, medium of the trend line) Trend_info_color_up_dn - color of the text describing the trend line Trend_info_font_up_dn

Arrow indicator utilizing variable Parabolic SAR and EMA for trending markets . Will show trend being established and trend continuation , allowing you to ride long trends or scalp. Designed for: Scalping Intraday trading Long-term trading Effective for: Currency Pairs Indices Oil Silver Gold Crypto Recommended timeframes: H1 H4 Daily Weekly Monthly For shorter timeframes, please adjust fully customizable settings. Test to find the optimum settings to suit your trading style. Function
Arrow is

Forex Play EA is an automated Expert Advisor based on smart algorithm and some standard indicators like Bollinger Bands, Stand Deviation etc. Money management - automatic lot calculation based on your risk per trade or manually set; Broker SPY Module (Hidden Take Profit and Stop Loss); Spread and Slippage Protection; High Trading Frequency; Flexible input options to use on different currency pairs; This system uses no grid, no martingale, no arbitrage, no hedges;
Parameters Distance from BB for

We-Point is an indicator for MT4 that help trader to read charts and research the point of Accelerator of the trend.
We-Point indicator is a useful tool for traders who want to study the direction of an underlying. We-Point indicator uses a mathematical formula that generates points in Red (which indicate bearish trend) and in Green (which indicate uptrend trend). When a Green (or Red) point will appear on the chart the trader will receive an alert (pop-up or push). We-Point indicator can be us

Viper Trend indicator is an indicator designed to find trends. It uses a moving average, a set of candle combinations and High/Low levels to find trends. This indicator is a complete trading system. You can trade with this indicator as you like.
Features and Recommendations You can use this indicator on all pairs except for the volatile pairs. It is recommended to use it on M15 and over charts. The most important element in this indicator are alerts. Do not open orders unless you receive an ale
This candlestick indicator searches for candlesticks, at which the direction on all selected timeframes coincides (M1, M5, M15, M30, H1, H4, D1, W1, MN). For example, if the candlestick on all timeframes is rising (bullish) or falling (bearish). You can: Turn off the display of unnecessary arrows and leave, for example, only those showing changes in signal direction, i.e. only the first arrow in each direction. Set the candlestick for the signal: the zero candlestick or a completely formed one.
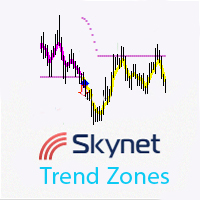
Skynet Trend Zones is based on classical indicators and some mathematical calculations and works in different market conditions for showing the trend. The principle of operation is as follows: if the price moves in a range, then a flat line is shown below or above the price depending on the previous trend; if the price moves down or up without a rollback, a line is shown at an angle to the price, and when a small rollback occurs, the indicator line is built again horizontally. Thus, you can work

This Expert Advisor uses the Parabolic indicator to determine the trend direction and to find better market entry and exit points. The Expert Advisor tries to enter the market at the beginning of a strong trend. The EA uses hedging strategy and grid of orders and which increases lot size. It uses parameter Max Order as an option in risk management.
Requirements and recommendations The minimum deposit is $10.000 or an equivalent cent account Leverage: 1:500 Stop level less than 20 or 30 points U

The Fibonacci Target indicator is an indicator that uses the Low, High and Fibonacci levels. This indicator has the ability to predict the target. It tries to determine the target that the graph will go on average and draws a target region. The indicator also serves as an oscillator. It can be used as a trend oscillator after making the necessary settings. This indicator is helpful to your strategy. There is no signal generating capability.
Parameters TargetPeriod - Target line period setting i

Jerus Line Scalper is an indicator for scalping on EURUSD, GBPUSD, AUDUSD, USDJPY and USDCAD pairs. Recommended pairs: M5, M15, M30 and H1. The trading strategy is as follows: as soon as the arrow appears, open an order in the direction of the arrow and set take profit to +10 points. Set stop loss at the indicator's stop line. Stop line is displayed in red or blue depending on the indicator signal. Also, the Martingale system can be applied in the system. If a trade is closed at a loss, the next

This Expert Advisor's main strategy is based on the usage of two kind of indicators: two built-in shifted MFI (Money Flow Index) to measure the asset prices oscillations and two Moving Averages calculated over Open Prices and Close Prices to confirm the trends. It combines these indicators signals in order to get stronger signals and ensure the EA will do good trading operations. The second strategy consists of sending a new opposite order against a losing order since it reaches the minimum nega
CutTheTrend FX is an automated trading Expert Advisor, which does not use indicators, because the analysis of history often leads to incorrect decisions in the future. The Expert Advisor analyses the current market situation based on Price Action and opens a position according to these calculations. It opens one position, but, if necessary, can apply grid algorithms to maintain positive operation. Also the EA is equipped with protective techniques, such as Trailing stop and Risk Blocking (see th
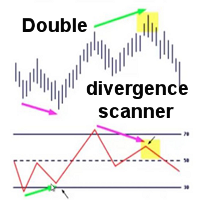
This multi indicator/oscillator (hereafter indicator), multi time frame and multi symbol indicator identifies when a divergence occurs between price and one, two or three indicators. It identifies both regular/classical (trend reversal) and hidden (trend continuation) divergences. It has RSI and MA trend filter options which makes it possible to filter out only the strongest setups. Combined with your own rules and techniques, this indicator will allow you to create (or enhance) your own powerfu

Forest is a Trend Expert Advisor based on the analysis of a unique mathematical model of trend lines, which allows you to determine the trend movement. The Expert Advisor is most suitable for the currency pair "USDCHF" on period "H1". The EA can work on any type of accounts, and with any brokers. The EA uses mathematical analysis to open trades and applies loss control to open trades. At its core, the EA does not use any risky systems with the increase in the volume or increase in the number of

"ANYWAY Plus EA" is a tool designed to handle your trades in a different concept, similar to "ANYWAY EA". But it looks for opportunities on 28 currency pairs and displays the data on the current chart. The EA does not start its trailing by locking in profit. It just moves stop loss by 1. It will step the SL by 1 so for every 1 pip the SL moves to 19, 18, 17, etc. All these stop losses and take profits can be hidden from the broker by selecting SLnTPMode = Client. Run the EA on one pair on the M5
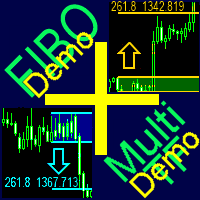
A ready-made multitimeframe trading system based on automatic plotting and tracking of Fibonacci levels for buying and selling any symbol. Demo version - calculation of the last 390 bars is not performed.
Advantages Determines the trend direction based on a complex of 14 indicators ( Cx ), extremums of ZigZag ( Z ), RSI ( R ), Impulse ( I ) Displaying the values of 14 indicators comprising the trend direction ( Cx ) Plotting horizontal levels, support and resistance lines, channels View the plo
FREE
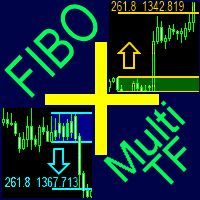
A ready-made multitimeframe trading system based on automatic plotting and tracking of Fibonacci levels for buying and selling any symbol.
Advantages Determines the trend direction based on a complex of 14 indicators ( Cx ), extremums of ZigZag ( Z ), RSI ( R ), Impulse ( I ) Displaying the values of 14 indicators comprising the trend direction ( Cx ) Plotting horizontal levels, support and resistance lines, channels View the plotting option of Fibonacci levels on any timeframe, with the abilit

"ANYWAY EA" is a tool designed to handle your trades in a different concept, which does not start its trailing by locking in profit. It just moves stop loss by 1. It will step the SL by 1 so for every 1 pip the SL moves to 19, 18, 17, etc. The brokers can see this and do nothing to deal with it. While you are sitting there waiting for it to lock in the points it has already made. All these stop losses and take profits can be hidden from the broker by selecting SLnTPMode = Client. Run the EA on a

The Idea Finding the third Elliott wave. Analyze the market as a wave structure in the format of 1-2-3 waves.
Algorithm The EA analyzes the closed bars using a simple algorithm with the ability to adjust various parameters. Reference point - touching of the High/Low of a certain bars range. After an impulse in the direction of the reference point, the EA waits for a rollback - the second wave. As soon as the second wave is formed, an entry point to the third wave appears.
Operation Modes The

Signal Bands is a sensitive and convenient indicator, which performs deep statistical processing of information. It allows to see on one chart (1) the price trend, (2) the clear price channel and (3) latent signs of trend change. The indicator can be used on charts of any periods, but it is especially useful for scalping due to its high sensitivity to the current market state.
The functions of the indicator : First, the Signal Bands indicator draws channels into which all price fluctuations exa
Uses an advanced grid algorithm with no martingale or limited Martingale (default) (version for MT5: GS grid5 ) . Defines and control the current trend; It switches himself its parameters in accordance with the current market conditions ;
Flexible customizable grid algorithm with or without martingale; Drawdown reduction algorithm (DD Reduction Algoritm); Hedge algorithm; Interactive trade control buttons; The ability to open / close orders manually; News filter to prevent trading during news
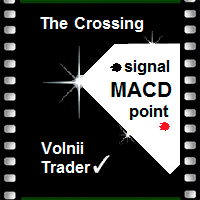
This indicator visualizes the intersection of two moving averages in the MACD oscillator. It uses the histogram color to signal about the moving averages crossing the zero level of the indicator. The MACD (Moving Average Convergence/Divergence) indicator is a popular oscillator actively used by traders when working in the currency and stock markets to determine trends and to search for trading signals. This linear indicator allows obtaining a variety of trading signals: crossing the zero line; d

DotaScalping is a semi-automated trading system for scalping. The indicator shows recommended moments for opening Buy/Sell trades as dots on the chart. Signals are generated based on the algorithm for price amplitude smoothing. The indicator tries to accurately calculate the moments of the maximum peak price values and produces signals based on the smoothed correlation. The indicator determines the High and Low price values and generates signals based on the trend direction. The indicator is v

The Expert Advisor has been developed specifically for the features of the CHFJPY currency pair. The EA's algorithm determines the direction of the current trend and starts operation. In case of a price reversal within the current trend, the EA adds additional orders. If trend changes, the EA starts to work in the direction contrary to the initial grid of orders. If there were no conditions for closing orders and the trend direction changed again, the EA continues to work with the "first" grid o

Essentials for manual trading. The utility includes functions such as money management, automatic exits, hedging of positions, setting orders by date, OrderClose menu and others. Simple operation and clearly arranged, the tool works with one or more orders. Low tick rate compatible.
Features Display money management - right lot size is calculated from stoploss, account balance and risk appetite Scheduling of pending and market order - time based strategies or for preparing an order when the mar
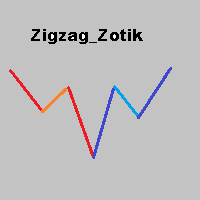
The Zigzag Zotik indicator displays the price movement in the form of a zigzag based on the AO_Zotik indicator values. The Zigzag Zotik indicator displays the trend movements and their corrections. The AO_Zotik indicator consists of three lines moving relative to "0": "main" line; "support and resistance" line; "balance" line. The "main" line crossing the "support and resistance" line indicates the end of one wave and the beginning of the other. The Zigzag Zotik indicator displays this on the ch
This indicator is based on Ichimoku kynko Hyo but personalized with We-Trading rules.
Ichimoku Trend Arrows As you can see, the indicator shows two types of arrows (signals): Big arrows to follow the big trends Minor arrows to re-enter on trend adding more trades With Ichi-Trend indi, you can follow the trend of the market. You can use it on Forex and on all CFDs and with all the fimeframe you like.
Parameters Main parameters help trader to setup Ichimoku value as: tenkan_sen - default value

This Expert Advisor is based on a scalping strategy that uses the Bollinger Bands indicator . The Bollinger Bands indicator reflects the price overbought or oversold conditions, which help to identify the entry or exit points as well as possible trend break-downs. The Bollinger Bands consist of an upper band placed above, and a lower band placed below. The distance between the Bollinger Bands or the width of the bands/channels based on the volatility measure. The mechanism of this system is simi

The Expert Advisor is able to trade on any financial instruments quoted in MetaTrader 4. To ensure this, it is necessary to monitor the correctness of settings. The trading logic is based on a series of pending orders. The full traded lot is composed of numerous small lots. Complex lot allows for a more precise control of the risk of the position volume, entering the market in parts. The advantage of the system of pending orders is that order trailing allows opening deals at more favorable price

This indicator is based on a combination of 2 different SuperTrend, a trend following indicator developed by Oliver Seban. You can find some implementation in the following pages: https://www.mql5.com/en/code/8268 https://www.mql5.com/en/code/10851 and others. Double ST indicator combines 2 different SuperTrends to have the trend direction at a glance. Simply insert the values for the 2 SuperTrends and you will see a ribbon with 3 different colors: red means that price is under both the SuperTre
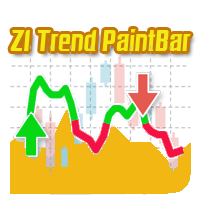
A trend indicator based on the CCI indicator. ZI Trend PaintBar Indicator is an improved variant of the CCI indicator, which shows the moment of trend following quite accurately. Combination of CCI indicator makes a better use of these advantages: Colored candlesticks showing the trend direction based on CCI indicator. Messages/Sounds (Notifications and sound settings) Mail - enable/disable sending emails. Alerts - enable/disable messages in the terminal when signals occur. Push - enable/disable
Merlin Grid is a fully automated EA that uses a clever combination of grid, price action, fast scalping, smart filtering and artificial intellect (artilect) to determine profitable entry and exit points into the FX market. Merlin Grid is optimized and backtested over a period of 8 years (2010–2018). Download the free demo version and give it a run yourself. Visit Merlin Grid's blog for set files, news, updates, wish list, etc.
Characteristics FIFO compliance option. Price averaging of same kind
Introduction to Harmonic Volatility Indicator Harmonic Volatility Indicator is the first technical analysis applying the Fibonacci analysis to the financial volatility. Harmonic volatility indicator is another level of price action trading tool, which combines robust Fibonacci ratios (0.618, 0.382, etc.) with volatility. Originally, Harmonic Volatility Indicator was developed to overcome the limitation and the weakness of Gann’s Angle, also known as Gann’s Fan. We have demonstrated that Harmonic

Trend Control is a trend-following Expert Advisor that determines the trend direction and closes positions only at trend reversals. The EA is equipped with a minimum of the most necessary functions to simplify working with it. The EA is most suitable for working on the EURUSD currency pair and the M5 timeframe. The EA is suitable for both five-digit quotes and four-digit quotes. The EA is equipped with a Stop Loss. The EA does not use any risky systems which increase the volume or increasing the

This Expert Advisor is based on a scalping strategy that uses Moving Average Envelopes Indicator . The Moving Average Envelopes indicator reflects the price overbought or oversold conditions, which help to identify the entry or exit points as well as possible trend break-downs. The moving average envelopes consist of an upper envelope placed above, and a lower envelope placed below. The distance between the moving average envelopes or the width of the bands/channels based on the volatility measu

SDX is our latest and most advanced dashboard for manual trading. The app is based on our proven grid platform and offers unique trading opportunities for both experienced and new traders. This unique combination of innovative tools is designed to simplify the trading process and to give you real advantage. The system is ideal for short term trend following, counter-trend trading and scalping on the Forex market.
Main Features Ability to work simultaneously with 10 pairs from one screen. Abilit

The Momentum Channel indicator works according to the daily price index. The indicator is used to analyze the parity price. This analysis is done through channels. channels are used to find trend return points. The indicator has 3 channel lines. these are the lines at 30, 50, and 70 levels. The 70 level is the overbought territory. Price movements in 70 and above indicate that the chart will fall in the near future. Price movements at 30 and below indicate that the chart will rise in near future
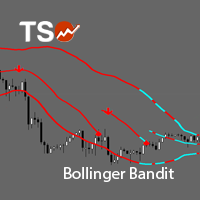
TSO Bollinger Bandit Strategy is an indicator based on the Bollinger Bandit Trading Strategy as presented in the book Building Winning Trading Systems with TradeStation by G. Pruitt and J. R. Hill. SCANNER is included . Now with Scanner you can find trading opportunities and setups easily and faster.
Features A complete entry and exit strategy for trending markets. Get email / push notifications when an entry signal occurs. The indicator is not repainting. Can easily be used in an EA. (see For

SFO Trend Racer system is a trend indicator created by the CEO and Founder of " Simple Forex Options ", Tevin Marshall . It serves 6 different functions all in one. It shows the trader the entry signals as well as exit signals, whether it is a take profit or a stop loss. It also uses trend filters and signal confirmations so that the trader is able to make the most logically fit decision. Trend Racer uses various filters and specific settings from a plethora of indicators. The beauty in this ind

Schrodinger trading machine is an Expert Advisor (robot) for any financial instrument on MetaTrader 4 platform. Both main input parameters (N and M) are optimized for EURUSD H1 . Of course, you are able to optimize these parameters for any currency pair and timeframe. For example, the main input parameters for GBPUSD H1: N = 5.0 and M = 12 The main input parameters N and M can be any positive numbers. These are input parameters (weight coefficients) of the one layer neural network. N is a double
Il MetaTrader Market è un sito semplice e pratico dove gli sviluppatori possono vendere le loro applicazioni di trading.
Ti aiuteremo a pubblicare il tuo prodotto e ti spiegheremo come prepararne la descrizione per il Market. Tutte le applicazioni sul Market sono protette da crittografia e possono essere eseguite solo sul computer dell'acquirente. La copia illegale è impossibile.

Ti stai perdendo delle opportunità di trading:
- App di trading gratuite
- Oltre 8.000 segnali per il copy trading
- Notizie economiche per esplorare i mercati finanziari
Registrazione
Accedi
Accetti la politica del sito e le condizioni d’uso
Se non hai un account, registrati