Масштабная миграция на MetaTrader 5 набирает обороты и в Австралии. Один из крупнейших брокеров зеленого континента Vantage FX, регулируемый Австралийской комиссией по ценным бумагам и инвестициям (ASIC), предложил своим клиентам мультирыночную
The large-scale migration to MetaTrader 5 is gaining momentum in Australia. One of the largest ASIC regulated Australian brokers Vantage FX now offers the next generation multi-asset HFT platform to their clients. Vantage FX representatives point out
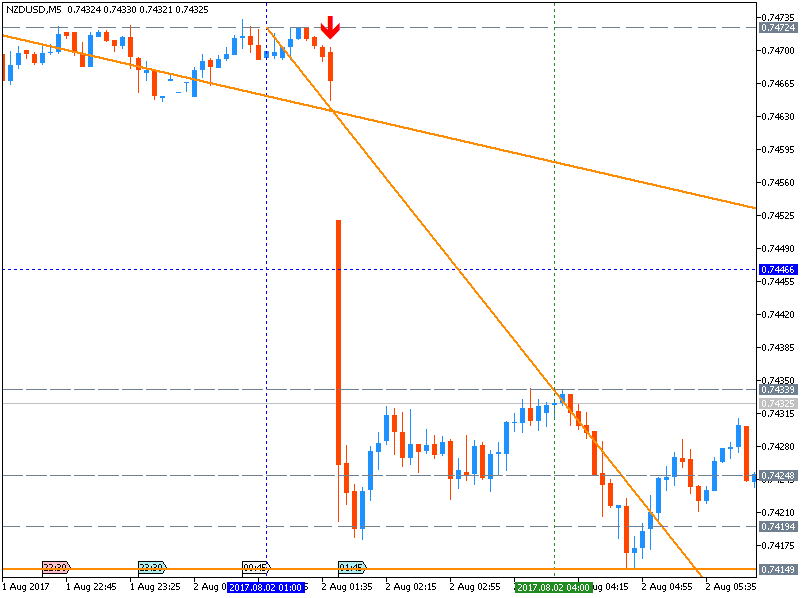
NZD/USD Intra-Day Fundamentals : New Zealand Employment Change and range price movement 2017-08-01 23:45 GMT | [NZD - Employment Change] past data is 1.1%, forecast data is 0.7%, actual data is -0.2%
FTSE 100 - daily ranging for direction; 7,332 is the key key level for the bearish reversal (based on the article ) The price on the daily chart is located within Ichimoku cloud waiting for the
Dax Index - weekly correction; 12,088 support level is the key (based on the article ) The price on weekly chart was bounced from 12,947 resistance level for the descending trianglew pattern to be
EUR/USD - bullish breakout; 1.1844 is the key (based on the article ) Intra-day price on H4 chart is on bullish breakout by the ascending triangle pattern to be crossing to above together with 1.1844
How to invest in bitcoin (based on the article ) Daily price is on bullish ranging above Ichimoku cloud within the following support/resistance levels: 2,998 resistance located far above Ichimoku
Intra-Day Fundamentals - EUR/USD, USD/JPY and USD/CNH: U.S. Gross Domestic Product 2017-07-28 13:30 GMT | [USD - GDP ] past data is 1.4%, forecast data is 2.5%, actual data is 2.6% according to the
USD/CAD - daily bearish; 1.2413 is the key (based on the article ) Daily price is located very far from Ichimoku cloud in the bearish area of the chart: price is breaking descending triangle pattern
Facebook shares - bullish breakout; 166.16 is the key (based on the article ) Facebook share price on weekly chart is located above ichimoku cloud in the bullish trend area. The price was bounced
EUR/USD - breakout with possible long term bullish reversal; 1.1777 is the key (based on the article ) Monthly price is on bear market rally located near and below Ichimoku cloud in the bearish area
Brent Crude Oil - intra-day bullish breakout; 51.13 level is the key (based on the article ) Price on H4 chart is above 100 SMA/200 SMA in the bullish area of the chart: the price is breaking 51.13
U.S. Commercial Crude Oil Inventories news event: intra-day bullish breakout; daily bullish reversal to be started 2017-07-26 15:30 GMT | [USD - Crude Oil Inventories] past data is -4.7M, forecast
AUD/USD Intra-Day Fundamentals : Australian Consumer Price Index and range price movement 2017-07-26 02:30 GMT | [AUD - CPI] past data is 0.5%, forecast data is 0.4%, actual data is 0.2% according to
Coca-Cola shares - global bullish reversal, 42.58 is the key (based on the article ) CCE share price on weekly chart os located inside Ichimoku cloud for the ranging market condition by breaking
EUR/USD Intra-day - bullish ranging with narrow s/r levels; 1.1684 is the key (based on the article ) EUR/USD H4 price is above Ichimoku cloud in the bullish area of the chart: the price is on ranging
NZD/USD - daily bullish breakout; 0.7457 is the key (based on the article ) Daily price is above Ichimoku cloud in the bullish area of the chart. The price is testing 0.7457 resistance level together