Doteki Heikin Ashi for MT5
- Indicateurs
- Fernando Carreiro
- Version: 1.1
(Google Traduction)
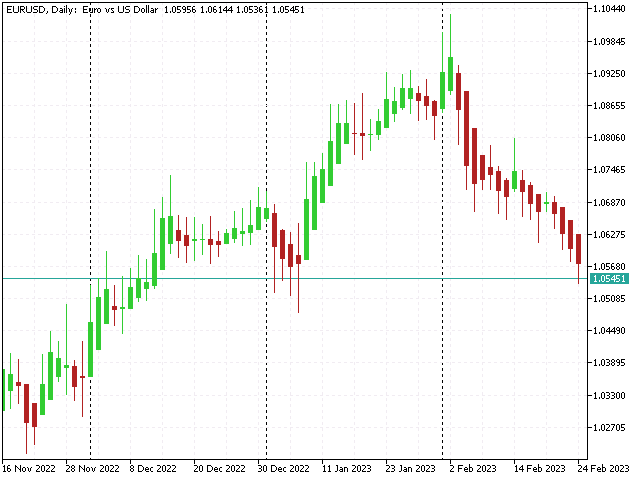
La représentation standard de la bougie Heikin Ashi a une valeur ouverte qui équivaut à une exponentielle Moyenne Mobile (EMA) du Prix Total, dont la valeur alpha de l'EMA est fixe à 0,5 (équivalent à une période EMA de 3,0).
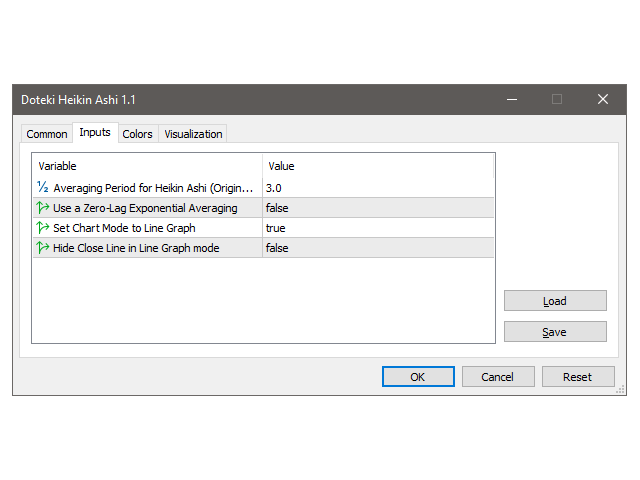
Dans cette version dynamique, la période peut être modifiée selon la valeur que l'on souhaite utiliser, ce qui permet également de analyse approximative sur plusieurs périodes de temps, ou utilisez la valeur basse ou haute comme une sorte de stop-loss suiveur. La traversée de le prix réel de clôture sur la valeur d'ouverture de Heikin Ashi peut également être utilisé comme signal pour un changement de direction de la tendance.
De plus, outre l'EMA standard, cette version a également la possibilité d'utiliser un EMA presque sans décalage au lieu de cela, ce qui peut détecter plus rapidement les changements de direction de la tendance, en particulier lors de l'utilisation de longues périodes de moyenne.
Lorsque vous attachez l'indicateur au graphique, vous avez également la possibilité de basculer automatiquement le graphique dans le Mode graphique linéaire et éventuellement masquer les prix réels de clôture du graphique linéaire, cependant, sans cela, vous ne pourrez pas voir les signaux croisés entre les prix réels de clôture et les Heikin Ashi valeurs ouvertes.
(Original text)
The standard Heikin Ashi candle representation has an open value that is equivalent to an Exponential Moving Average (EMA) of the Total Price, of which the alpha value of the EMA is fixed at 0.5 (equivalent to an EMA period of 3.0).
In this dynamic version, the period can be changed to whatever value one wishes to use, which also allows one to approximate multi-time-frame analysis, or use the low or high value as a sort of trailing stop-loss. The crossing of the real Close price over the Heikin Ashi open value can also be used as a signal for a change in trend direction.
Also, besides the standard EMA, this version also has the option of using an Almost Zero-Lag EMA instead, which can detect changes in trend direction more quickly, especially when using longer periods of averaging.
When attaching the indicator to the chart, you also have the option of automatically switching the Chart into the Line Graph Mode and optionally hiding the real Close prices from the Line Graph, however, without it, you will not be able to see the cross-over signals between the real Close prices and the Heikin Ashi open values.


Banger Indicator king. Don't really like the EMA or whaterver is behind the candles. Is it possible to remove it?