• Aperçu
  • Avis
  • Commentaires

SPTforMT4

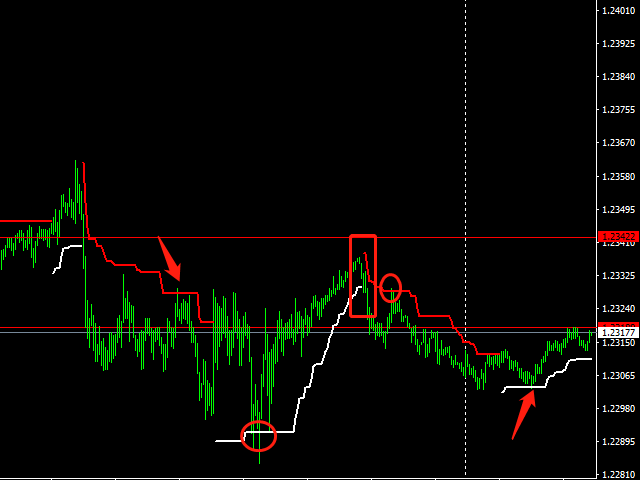
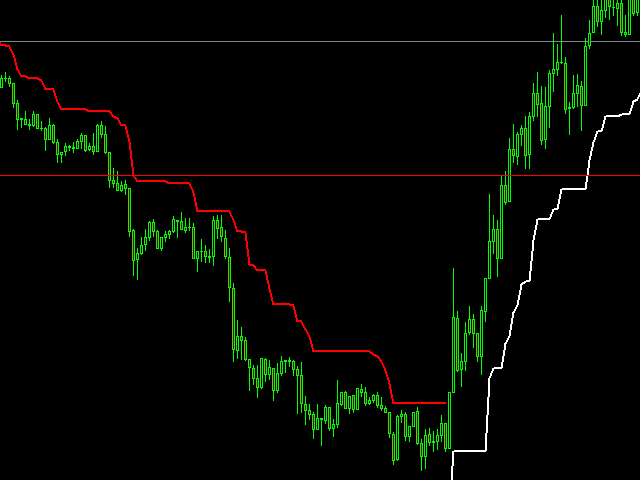
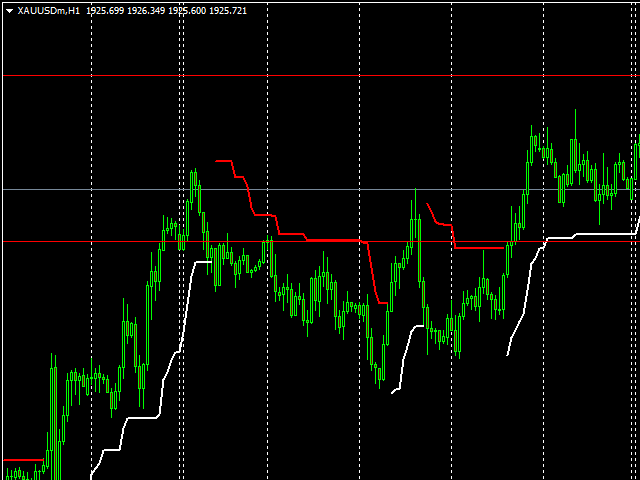
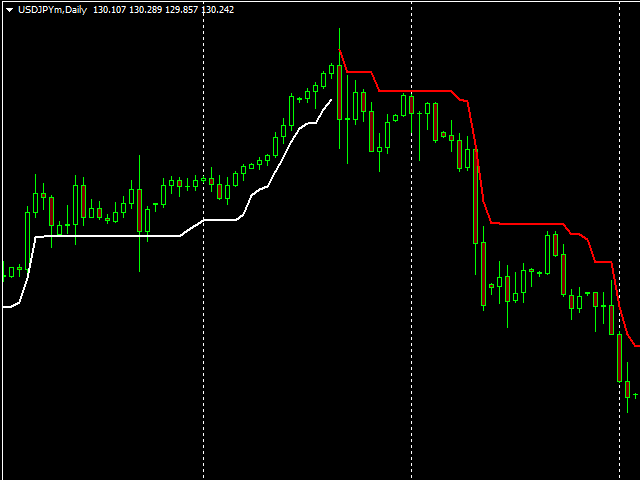
SPT is a trend indicator

It is written on the basis of ATR, with clear trend lines indicating the direction in progress,

Different traders' understanding of this indicator may form two different purposes

Trend-based traders will conduct trend trading when the trend line changes,

Respectful shock traders will carry out range trading according to the final support or resistance level marked by this indicator


The index parameters are as follows:

Multiplier: multiple of ATR

Period: ATR cycle. The smaller the cycle, the more sensitive the index is, the higher the ineffectiveness is, but the smaller the stop loss is

To install the MT4 Supertrend Line indicator, please follow the instructions below:


1.Download the indicator archive file.

2.Open the MetaTrader 4 data folder (via File->Open Data Folder).

3.Open the MQL4 Folder.

4.Copy all the folders from the archive directly to the MQL4 folder.

5.Restart MetaTrader 4 or refresh the indicators list by right-clicking the Navigator subwindow of the platform and choosing Refresh.

Produits recommandés
What Is MT4 Candlestick Pattern Indicator Candlestick patterns are groups of candlestick that have a meaning for the trader. These groups are usually composed of two, three, four, or five candles and indicate some form of price action happening. In many cases traders use these patterns to decide what to do next. Candlestick Pattern Indicator for MT4 is a plugin that allows you to see the most common candlestick patterns on your chart. The indicator scans the chart and detects popular patterns, m
There are total of 11 bullish candlestick patterns and 11 bearish candlestick pattern and 4 different types of indecision bar. Bullish formations Bullish 3 method formation Bullish Engulfing bar Bullish Harami Bullish Separating line Bullish long lower shadow Morning star Morning Doji star Three white soldiers Rising window Piercing line Tweezer tops (MINOR) Bearish formations Bearish 3 method formation Bearish engulfing Bearish Harami Bearish long lower shadow Bearish Separating Lines Evening s
This indicator Super Neuro Trend indicator.Indicator displays trend movement. Indicator helps to buy and sell. Features FiltPer- displays indicator period. deviation - displaus indicator deviation. Trend - displaus indicator trend.( true,false) Rectangle - displaus indicator rectangle. (true,false)  How to understand the status: If the trend color is green, trend is up. I f the trend color is red, trend is down. I f the trend waiting,trend waiting.     /////////////////////////////////////////
Introduction to Harmonic Volatility Indicator Harmonic Volatility Indicator is the first technical analysis applying the Fibonacci analysis to the financial volatility. Harmonic volatility indicator is another level of price action trading tool, which combines robust Fibonacci ratios (0.618, 0.382, etc.) with volatility. Originally, Harmonic Volatility Indicator was developed to overcome the limitation and the weakness of Gann’s Angle, also known as Gann’s Fan. We have demonstrated that Harmonic
Intraday Setup
Che Jeib Che Said
Intraday Setup Indicator uses Bollinger Bands as a main indicator to find a good setup filtered with candle stick pattern  such as engulfing and pin bar. This is great tool for those who trade with Bollinger bands for entry or use it as a filter for trend. It is suggested to use a higher time frame when using this tool. There are many input setting for user to conveniently find a good probability setup. 
FREE
Doji Engulfing Paths
Boubacar Tidiane Traore
Presentation Doji Engulfing Paths enables to get signals and data about the doji and the engulfing patterns on charts. It makes it possible to get opportunities from trends, and to follow the directional moves to get some profits on the forex and stocks markets. It is a good advantage to take all the appearing opportunities with reversal signals and direct signals in order to obtain some profits on the forex market. System features With fast execution, it allows to register directly the inform
IDNR4 and 7 28 Pairs Radar
Francesco Petralla
5 (1)
This indicator detects IDRN4 and IDNR7 two powerful patterns on 28 pairs on new daily bar. IDNR4 is the acronym for "Inside Day Narrow Range 4" where "Inside Day" is a lower high and higher low than the previous bar and "Narrow Range 4" is a bar with the narrowest range out of the last 4 bars so "Narrow Range 7" out of the last 7 bars. Hence, ID/NR4 and better ID/NR7 are an objective criterion for identifying days of decreased range and volatility. Once we find an ID/NR4 or an ID/NR7 pattern, we
CheckList MT4
Kambiz Shahriarynasab
4 (2)
One of the basic needs of every trader is to have a checklist to enter every position. Of course, using pen and paper may not be convenient forever. With this indicator, you can have a small checklist next to the screen for each of your charts and use it for better use in your trades. MT5 Version This indicator will have many updates and special settings will be added to it. You can contact us via Instagram, Telegram, WhatsApp, email or here. We are ready to answer you.
Candlestick Patterns MT4 is a simple and convenient indicator able to define 29 candle patterns. Advantages Defines and highlights 29 candle patterns; Estimated trading direction is shown as an arrow; Each candlestick pattern can be disabled in the settings; The indicator can be used as an arrow indicator in EAs. Parameters TextSize - chart text size; TextColor - chart text color; Alert - enable/disable alerts; ---------- Candlestick Patterns ------------- - settings separator; AdvanceBlock
Présentation du   détecteur d'évasion du volume de la bande de Bollinger   , un puissant indicateur technique conçu pour améliorer la   stratégie populaire d'évasion de la bande de Bollinger   . Cet indicateur fait passer le suivi des tendances au niveau supérieur en incorporant des données de volume, minimisant efficacement les faux signaux. En adhérant au principe du "volume confirme le prix", cet outil permet aux traders d'identifier les cassures de prix accompagnées d'augmentations significa
The indicator scans for stop grabber (special pattern of Joe Dinapoli which gives very high probability buy / sell signals and does not repaint ) signals in multiple timeframes for the all markets filtered and shows the results on Dashboard. Key Features Dashboard can be used for all markets It can scan for stop grabber pattern on MN1, W1, D1, H4, H1, M30, M15 ,M5, M1 timeframes Parameters UseMarketWatch: Set true to copy all symbols available in market watch MarketWatchCount : Set the numbe
L'indicateur affiche un signal sur le graphique lorsque le deuxième chandelier se trouve à l'intérieur du premier, c'est-à-dire qu'il n'a pas dépassé ses limites. Cette configuration de chandelier est appelée barre intérieure. Cette configuration n'est pas aussi populaire que la Barre d'épingle ou la Prise de contrôle, mais elle est parfois utilisée par certains traders. Il est possible de filtrer par tendance (2 moyennes mobiles) et par renversement (RSI et bandes de Bollinger). Un panneau mul
50+ Candlestick Patterns, Simulated Trading Results, Top Five Performers Candle Analysis extends Candlesticks Pattern Analysis by not only identifying Patterns but also recording the Past Performance of the Patterns. What it Does:- Identifies and plots results on chart Displays Top Patterns for both Bullish and Bearish type.  Log can be printed in experts tab to see Simulated Trading results Displays All or Selected Patterns Alerts on Pattern formation More detailed information in Blog
Breakout FX
David Leander Tschacher
5 (1)
Breakout FX draws arrows and emits alarms if the price exceeds or falls below the previous n candles. ️ Breakout FX can be used in expert advisors. ️ Breakout FX can improve already existing trading strategies. ️ Breakout FX is very fast and is not repainting. Inputs Breakout Range [Candles] Breakout Price Type Arrow Size Enable Alerts Enable Push Notifications Enable Emails
TheStrat Patterns
Robert Gerald Wood
This indicator will draw patterns based on Rob Smith's The Strat as they emerge in real time on your chart. As price evolves, TheStrat offers 18 distinct price action patterns that can help you get good entries in the market. Each pattern involves two or three candles, and this indicator will draw a bounding box around the candles and name the pattern. The indicator also shows when a potential setup is forming, known by stratters as an Actionable signal. Candles Each candle is defined by i
The True Oversold Overbought indicator provides you with ability to swiftly check whether the asset is oversold or overbought.  Other than complementing your trading with True Oversold Overbought, you can use the indicator as your only trading system. It works with all forex instruments and will save you the headache of estimating when the market is due for a reversal or retracement.  When the "Super Charge" feature is enabled, the areas where the price is in oversold/overbought status are ampl
Indicator plots price cycle blocks and sends signals with smart volume confirmation. Price cycles and fractals are combined to determine the demand/supply blocks. The indicator can be used alone or combined with other Cycle Indicators Inputs: Period: Recommended value is between 35 and 55( Which are Set 1 and Set 2 periods of cycle sniper ) Engulfing: If true, you will be able to see the engulfing bar confirmation. Volume Filter: True (The  arrow comes with volume confirmation ) Videos with dif
L'indicateur "Fibo Star" a été conçu pour tracer les éventails de Fibonacci sous forme d'étoiles sur votre graphique. Ces éventails de Fibonacci sont un outil puissant pour analyser les mouvements de prix et peuvent fournir des aperçus des niveaux potentiels de support et de résistance. Cet indicateur est équipé d'un panneau de contrôle convivial qui vise à simplifier le processus de dessin et de configuration des éventails, permettant ainsi d'économiser du temps et des efforts. Mode d'emploi :
This multi time frame and multi symbol indicator identifies high-probability breakout patterns. It does this by identifying strong, symmetrical pennants and triangles. This pattern DOES NOT appear very often on higher time frames. But when it does, it is a very high-probability setup. The indicator also includes an Inside bars scanner. It can for example be used to detect a special type of Inside bars formation which is formed by a Master candle (MC) followed by 4 inside candles (please see the
TrendControl is an arrow indicator of technical analysis for determining a trend, which can adjust to the price, is a graphical plot calculated using mathematical formulas, the initial data for which is a price chart. The indicator shows the direction of the trend, takes into account the minimum and maximum values ​​of the extreme candles on the chart, then brings them to the average and compares them with the past data. The principle of operation of the indicator is to automatically determin
Indicador de sesion de trabajo
Edmundo Antonio Bazan Garcia
Permite ver el horario comprendido entre la hora inicial que indique el usuario y la hora final, de esa manera, si el usuario desea ver sobre el grafico una sesion de trabajo, solo tiene que indicar la hora incial y la hora final de la sesion que desee. Esto permite que el usuario identifique con mayor facilidad el horario que comprenda la sesion de trabajo que el usuario desee vigilar, o trabajar, o simplemente tener como referencia.
Triangle patterns are chart formations that signal a possible breakout in either direction. In the case of symmetrical triangles, the probability of a breakout to the upside or downside is about 50%. For more detailed information, I recommend the numerous publications on the Internet on this subject. What is special about this indicator is that it can be integrated into your own MT4 applications, such as scripts, Expert Advisers, etc. using the implemented indicator buffer via the iCustom() func
Candle Inside
Yuriy Vins
5 (1)
Candle Inside indicator - draws Japanese candlesticks of a higher timeframe on the chart. Now, after loading the indicator, it is possible to see what is happening inside each candle. In addition to the standard buttons for selecting the timeframe in the MT-4 terminal, additional buttons are added, when clicked, an older period is selected to display Japanese candles or zones. For example, if you select the standard period M1 and the period of the indicator M5, then the chart will display minute
ABCD Harmonic Patterns
Mehmet Ozhan Hastaoglu
Thanks to this indicator, you can easily see the new ABCD harmonic patterns in the chart. If the two price action lengths are equal, the system will give you a signal when it reaches the specified level. You can set the limits as you wish. For example, You can get the signal of the price, which occurs in the Fibonaci 38.2 and 88.6 retracements, and then moves for the same length, at the level you specify. For example, it will alarm you when the price reaches 80% as a percentage. In vertic
Trend Line Chart Pattern Signals  Is a traders Tool for Signals based on Strong  Patterns Formed By a pair of robust trend lines. They FOR WITH DIFFERENT POPULAR PATTERNS ON CHARTS LIKE – TRIANGLES, FLAGS,RANGE , ASCENDING TRIANGLES, DESCENDING PATTERNS, PENNANTS ETC. The TREND LINES  form  dynamically  on running bars. The  sensitivity  of the trend lines can be changed by custom settings. The  Buy and Sell Signals Generate upon Break Of the Trend Line + "Close" of the same bar above the previo
Harmonic ABCD Universal
Mihail Matkovskij
5 (2)
The indicator displays harmonic ABCD patterns, as well as the market entry points, which allows the trader to make trading decisions quickly. Harmonic ABCD Universal is one of the few indicators that predict price movement by determining pivot points with a rather high probability long before the pivot itself. It supports sending push and email notifications, as well as alerts. The indicator scans all possible combinations on the chart for the current moment, and also in history, with the help o
Introduction to Fractal Pattern Scanner Fractal Indicator refers to the technical indicator that makes use of the fractal geometry found in the financial market. Fractal Pattern Scanner is the advanced Fractal Indicator that brings the latest trading technology after the extensive research and development work in the fractal geometry in the financial market. The most important feature in Fractal Pattern Scanner is the ability to measure the turning point probability as well as the trend probabi
True SnD
Indra Lukmana
5 (1)
This Supply & Demand indicator uses a unique price action detection to calculate and measures the supply & demand area. The indicator will ensure the area are fresh and have a significant low risk zone. Our Supply Demand indicator delivers functionality previously unavailable on any trading platform. Trading idea You may set pending orders along the supply & demand area. You may enter a trade directly upon price hit the specific area (after a rejection confirmed). Input parameters Signal - S
The indicator is designed for binary options. It produces a sound alert, after which you should instantly enter the market. The indicator operates based on signals form RSI and CCI, as well as support and resistance levels. When the chart is in overbought and oversold zones, the indicator finds a level in this zone and notifies you using a sound and a message. Indicator Parameters dist - the number of points to generate a signal. Suitable values ​​are from 21 to 50. Filtr_SMA - the filter, use
SignalPinner is a trend line Indicator which can detect market trends early by including three types of signal arrows. Non repaint and trend following. Signals on the strong trend, signals in the beginning of trend and signals with multiple market analysis algorithm as the main signals. Supported by alert notification message to keep you getting signals while on the go. Symbols: Any Timeframes: Any Features Histogram buffers as a sign the trend is started. It can help the trader knowing the ma
Les acheteurs de ce produit ont également acheté
Atomic Analyst
Issam Kassas
5 (1)
Tout d'abord, il convient de souligner que cet indicateur de trading n'est ni repainting, ni redrawing et ne présente aucun délai, ce qui le rend idéal à la fois pour le trading manuel et automatisé. L'Analyste Atomique est un indicateur d'action sur les prix PA qui utilise la force et le momentum du prix pour trouver un meilleur avantage sur le marché. Équipé de filtres avancés qui aident à éliminer les bruits et les faux signaux, et à augmenter le potentiel de trading. En utilisant plusieur
ACTUELLEMENT 26% DE RÉDUCTION La meilleure solution pour tout débutant ou trader expert ! Cet indicateur est un outil de trading unique, de haute qualité et abordable car nous avons incorporé un certain nombre de caractéristiques exclusives et une nouvelle formule. Avec seulement UN graphique, vous pouvez lire la force de la devise pour 28 paires Forex ! Imaginez comment votre trading va s'améliorer parce que vous êtes capable de repérer le point de déclenchement exact d'une nouvelle tendan
TPSproTREND PrO
Roman Podpora
5 (15)
TPSpro TRENDPRO  - is a trend indicator that automatically analyzes the market and provides information about the trend and each of its changes, as well as giving signals for entering trades without redrawing! The indicator uses each candle, analyzing them separately. referring to different impulses - up or down impulse. Exact entry points into transactions for currencies, crypto, metals, stocks, indices!  -  Version MT5               DETAILED DESCRIPTION        /       TRADING SETUPS           
Présentation       Quantum Trend Sniper Indicator   , l'indicateur révolutionnaire MQL5 qui transforme la façon dont vous identifiez et négociez les inversions de tendance ! Développé par une équipe de traders expérimentés avec une expérience commerciale de plus de 13 ans,       Indicateur Quantum Trend Sniper       est conçu pour propulser votre parcours de trading vers de nouveaux sommets grâce à sa manière innovante d'identifier les inversions de tendance avec une précision extrêmement élevée
Scalper Inside PRO
Alexey Minkov
4.75 (55)
SALE NOW! Limited Time Offer! An exclusive indicator that utilizes an innovative algorithm to swiftly and accurately determine the market trend. The indicator automatically calculates opening, closing, and profit levels, providing detailed trading statistics. With these features, you can choose the most appropriate trading instrument for the current market conditions. Additionally, you can easily integrate your own arrow indicators into Scalper Inside Pro to quickly evaluate their statistics and
Advanced Supply Demand
Bernhard Schweigert
4.92 (310)
CURRENTLY 26% OFF !! Best Solution for any Newbie or Expert Trader! This indicator is a unique, high quality and affordable trading tool because we have incorporated a number of proprietary features and a new formula. With this update, you will be able to show double timeframe zones. You will not only be able to show a higher TF but to show both, the chart TF, PLUS the higher TF: SHOWING NESTED ZONES. All Supply Demand traders will love it. :) Important Information Revealed Maximize the potenti
TPSpro RFI Levels
Roman Podpora
5 (13)
A key element in trading is zones or levels from which decisions to buy or sell a trading instrument are made. Despite attempts by major players to conceal their presence in the market, they inevitably leave traces. Our task was to learn how to identify these traces and interpret them correctly. Reversal First Impulse levels (RFI)   -  Version MT5                INSTRUCTIONS                 RUS                 ENG                                       R ecommended to use with an indicator   -  
TrendMaestro
Stefano Frisetti
5 (2)
note: this indicator is for METATRADER4, if you want the version for METATRADER5 this is the link: TRENDMAESTRO recognizes a new TREND in the bud, he never makes mistakes. The certainty of identifying a new TREND is priceless. DESCRIPTION TRENDMAESTRO identifies a new TREND in the bud, this indicator examines the volatility, volumes and momentum to identify the moment in which there is an explosion of one or more of these data and therefore the moment in which prices have strong probability of f
Actuellement 20% de réduction ! La meilleure solution pour tout débutant ou trader expert ! Ce logiciel de tableau de bord fonctionne sur 28 paires de devises. Il est basé sur 2 de nos principaux indicateurs (Advanced Currency Strength 28 et Advanced Currency Impulse). Il donne un excellent aperçu de l'ensemble du marché Forex. Il montre les valeurs de l'Advanced Currency Strength, la vitesse de mouvement des devises et les signaux pour 28 paires de devises dans tous les (9) délais. Imagine
Présentation de l'indicateur miraculeux Forex : Libérez la puissance du trading précis En avez-vous assez de chercher le meilleur indicateur Forex qui fournisse réellement des résultats exceptionnels sur tous les délais ? Ne cherchez plus ! L'indicateur miraculeux Forex est là pour révolutionner votre expérience de trading et propulser vos gains vers de nouveaux sommets. Basé sur une technologie de pointe et des années de développement minutieux, l'indicateur miraculeux Forex se positionne comme
Entry Points Pro
Yury Orlov
4.7 (224)
Indicateur supérieur pour MT4 fournissant des signaux précis pour entrer dans un trade sans repeindre ! Il peut être appliqué à tous les actifs financiers : forex, cryptocurrencies, métaux, actions, indices.  La version MT5 est ici Il fournira des signaux de trading assez précis et vous dira quand il est préférable d'ouvrir un trade et de le fermer. Regardez la vidéo (6:22) avec un exemple de traitement d'un seul signal qui a rapporté à l'indicateur ! La plupart des traders améliorent l
Quantum Breakout Indicator PRO
Bogdan Ion Puscasu
4.96 (26)
Présentation       Quantum Breakout PRO   , l'indicateur révolutionnaire MQL5 qui transforme la façon dont vous négociez les zones d'évasion ! Développé par une équipe de traders expérimentés avec une expérience de trading de plus de 13 ans,   Quantum Breakout PRO   est conçu pour propulser votre parcours de trading vers de nouveaux sommets grâce à sa stratégie de zone de discussion innovante et dynamique. Quantum Breakout Indicator vous donnera des flèches de signalisation sur les zones d
FX Power MT4 NG
Daniel Stein
5 (8)
Obtenez votre mise à jour quotidienne du marché avec des détails et des captures d'écran via notre Morning Briefing ici sur mql5 et sur Telegram ! FX Power MT4 NG est la nouvelle génération de notre très populaire indicateur de force des devises, FX Power. Et qu'est-ce que ce compteur de force de nouvelle génération offre ? Tout ce que vous avez aimé de l'original FX Power PLUS Analyse de la force de l'OR/XAU Des résultats de calcul encore plus précis Périodes d'analyse configurables individuel
Shepherd Harmonic Pattern
Abdullah Alrai
4.68 (59)
Cet indicateur détectera des motifs harmoniques dessinés sur le graphique par des méthodes manuelles et automatiques. Vous pouvez consulter le manuel d'utilisateur à partir de ce lien: Ajoutez votre avis et contactez-nous pour l'obtenir. Il existe une version gratuite pour essayer ce produit sur MT4. Vous pouvez l'utiliser pour détecter les motifs Gartley et Nenstar: https://www.mql5.com/en/market/product/30181 Vous pouvez acheter la version complète de MT4 à partir de: https://www.mql5.com/en/m
FX Volume
Daniel Stein
4.6 (35)
Obtenez votre mise à jour quotidienne du marché avec des détails et des captures d'écran via notre Morning Briefing ici sur mql5 et sur Telegram ! FX Volume est le PREMIER et SEUL indicateur de volume qui fournit un VRAI aperçu du sentiment du marché du point de vue d'un courtier. Il fournit des informations impressionnantes sur la façon dont les acteurs institutionnels du marché, comme les courtiers, sont positionnés sur le marché des changes, bien plus rapidement que les rapports COT. Voir c
How to use Pair Trading Station Pair Trading Station is recommended for H1 time frame and you can use it for any currency pairs. To generate buy and sell signal, follow few steps below to apply Pair Trading Station to your MetaTrader terminal. When you load Pair Trading Station on your chart, Pair Trading station will assess available historical data in your MetaTrader platforms for each currency pair. On your chart, the amount of historical data available will be displayed for each currency pai
Cycle Sniper
Elmira Memish
4.41 (34)
NEW YEAR SALE PRICE FOR LIMITED TIME!!! Please contact us after your purchase and we will send you the complimentary indicators to complete the system Cycle Sniper is not a holy grail but when you use it in a system which is explained in the videos, you will feel the difference. If you are not willing to focus on the charts designed with Cycle Sniper and other free tools we provide, we recommend not buying this indicator. We recommend watching the videos about the indiactor and system before pu
PTS Precision Index Oscillator V2
PrecisionTradingSystems
5 (1)
L'oscillateur de l'indice de précision (Pi-Osc) de Roger Medcalf de Precision Trading Systems La version 2 a été soigneusement recodée pour être ultra-rapide à charger sur votre graphique, et quelques autres améliorations techniques ont été incorporées pour améliorer l'expérience. Le Pi-Osc a été créé pour fournir des signaux de synchronisation de trading précis conçus pour trouver des points d'épuisement extrêmes, les points auxquels les marchés sont contraints d'aller simplement pour élim
TakePropips Donchian Trend Pro
Eric John Pajarillaga Aldana
4.82 (17)
TakePropips Donchian Trend Pro   (MT4) est un outil puissant et efficace qui détecte automatiquement la direction de la tendance à l'aide du canal Donchian et vous fournit des signaux de trading d'entrée et de sortie ! Cet indicateur multifonction comprend un scanner de tendance, des signaux de trading, un panneau statistique, un filtre, des sessions de trading et un tableau de bord de l'historique des alertes. Il est conçu pour vous fournir des signaux de trading et vous faire gagner des heures
PTS - Divergence Buy Finder par Precision Trading Systems Le Precision Divergence Finder a été conçu pour trouver les points bas du marché avec une précision extrême, et il le fait fréquemment. En analyse technique, l'art de choisir les creux est généralement beaucoup plus facile que de choisir les sommets, et cet outil est précisément conçu pour cette tâche. Après avoir identifié une divergence haussière, il est sage d'attendre que la tendance s'inverse avant d'acheter. Vous pouvez utilise
L'indicateur de vente PTS Divergence Finder de Roger Medcalf - Precision Trading Systems. Cet indicateur ne fournit que des indications baissières de vente. Tout d'abord, on m'a souvent demandé pourquoi je n'avais pas fourni un indicateur de divergence de vente tout en fournissant volontiers un outil de recherche de divergence de signaux d'achat depuis de nombreuses années. J'ai répondu que les divergences de vente sont moins fiables que les divergences d'achat, ce qui est toujours vrai. Certain
Up down v6T
Guner Koca
5 (1)
Thise indicator is up down v6  comes with tradingwiev version. purchased people, after installed on terminal ,contact me on mql5  to get BONUS  TradingView version. up-down indicator is no repaint and works all pairs and lower than weekly time frames charts. it is suitable also 1 m charts for all pairs. and hold long way to signal. dont gives too many signals. when red histogram cross trigger line that is up signal.and price probably will down when blue histogram cross trigger line that is dow
Price Action Entry Alerts
Stephen Sanjeeve Sahayam
5 (3)
Cet indicateur examine chaque barre pour la pression d'achat ou de vente et identifie 4 types de modèles de bougies avec le volume le plus élevé. Ces bougies sont ensuite filtrées à l'aide de plusieurs filtres linéaires pour afficher les signaux d'achat ou de vente. Les signaux fonctionnent mieux, en conjonction avec une direction temporelle plus élevée et lorsqu'ils sont négociés pendant les heures de volume élevé. Tous les filtres sont personnalisables et fonctionnent indépendamment. Peut aff
XQ Indicator MetaTrader 4
Marzena Maria Szmit
3 (2)
Step into the realm of Forex trading with confidence and precision using XQ, a cutting-edge Forex indicator designed to elevate your trading game to unprecedented heights. Whether you're a seasoned trader or just stepping into the world of currency exchange,   XQ Forex Indicator   empowers you with the insights and signals needed to make informed trading decisions. The signal conditions are a combination of three indicators, and XQ Forex Indicator only display  medium and long-term trends . The
Currency Strength Exotics
Bernhard Schweigert
4.88 (33)
ACTUELLEMENT 20% DE RÉDUCTION ! La meilleure solution pour tout débutant ou trader expert ! Cet indicateur est spécialisé pour montrer la force de la devise pour tous les symboles comme les paires exotiques, les matières premières, les indices ou les contrats à terme. C'est le premier de son genre, n'importe quel symbole peut être ajouté à la 9ème ligne pour montrer la force réelle de la devise de l'or, l'argent, le pétrole, DAX, US30, MXN, TRY, CNH etc. Il s'agit d'un outil de trading uniq
Nous vous présentons ON Trade Waves Patterns Harmonic Elliot Wolfe, un indicateur avancé conçu pour détecter divers types de schémas sur le marché à l'aide de méthodes manuelles et automatiques. Voici comment il fonctionne : Schémas Harmoniques : Cet indicateur peut identifier les schémas harmoniques qui apparaissent sur votre graphique. Ces schémas sont essentiels pour les traders qui pratiquent la théorie du trading harmonique, telle qu'elle est décrite dans le livre de Scott Carney "Harmonic
Royal Scalping Indicator M4
Vahidreza Heidar Gholami
4.17 (6)
Royal Scalping Indicator is an advanced price adaptive indicator designed to generate high-quality trading signals. Built-in multi-timeframe and multi-currency capabilities make it even more powerful to have configurations based on different symbols and timeframes. This indicator is perfect for scalp trades as well as swing trades. Royal Scalping is not just an indicator, but a trading strategy itself. Features Price Adaptive Trend Detector Algorithm Multi-Timeframe and Multi-Currency Trend Low
Présentation de l'indicateur astronomique pour MT4 : Votre compagnon de trading céleste ultime Êtes-vous prêt à élever votre expérience de trading à des hauteurs célestes ? Ne cherchez pas plus loin que notre indicateur astronomique révolutionnaire pour MT4. Cet outil innovant transcende les indicateurs de trading traditionnels en exploitant des algorithmes complexes pour vous fournir des aperçus astronomiques inégalés et des calculs de précision. Un univers d'informations à portée de main : Con
GOLD Impulse with Alert
Bernhard Schweigert
4.56 (9)
Cet indicateur est une super combinaison de nos 2 produits Advanced Currency IMPULSE with ALERT  +   Currency Strength Exotics . Il fonctionne pour tous les cadres temporels et montre graphiquement l'impulsion de force ou de faiblesse pour les 8 principales devises plus un symbole ! Cet indicateur est spécialisé pour montrer l'accélération de la force des devises pour tout symbole comme l'or, les paires exotiques, les matières premières, les indices ou les contrats à terme. C'est le premi
Supply and Demand Dashboard PRO
Bernhard Schweigert
4.82 (22)
Actuellement 20% de réduction ! Ce tableau de bord est un logiciel très puissant qui fonctionne sur plusieurs symboles et jusqu'à 9 horizons temporels. Il est basé sur notre indicateur principal (Best reviews : Advanced Supply Demand ).   Le tableau de bord donne une excellente vue d'ensemble. Il montre :  Les valeurs d'offre et de demande filtrées, y compris l'évaluation de la force de la zone, Les distances en pips vers/et dans les zones, Il met en évidence les zones imbriquées, Il donne
Filtrer:
Aucun avis
Répondre à l'avis