Pivot classic woodie camarilla fibonacci demark
- Indicateurs
- Emin Ulucanli
- Version: 1.10
- Mise à jour: 28 janvier 2023
Pivot Classic, Woodie, Camarilla, Fibonacci and Demark
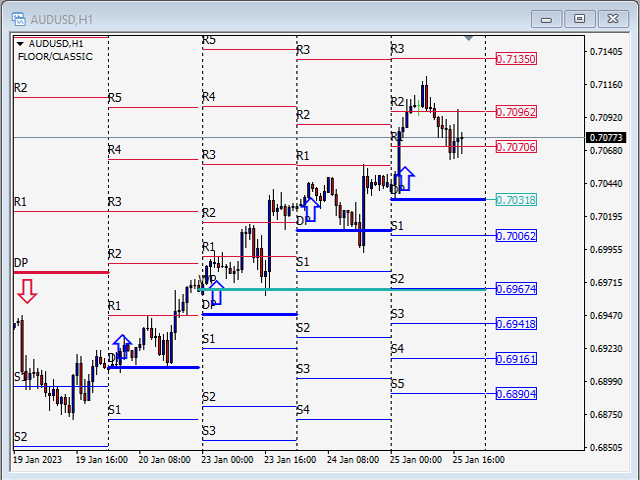
Floor/Classic
Les points pivots, ou simplement les pivots, sont utiles pour identifier les niveaux de support/résistance potentiels, les fourchettes de négociation, les inversions de tendance et le sentiment du marché en examinant les valeurs hautes, basses et de clôture d'un actif. Les points pivots Floor/Classic peuvent être calculés comme suit.
Pivot Point (P) = (High + Low + Close)/3
S1 = P * 2 - High
S2 = P - (High - Low)
S3 = Low – 2*(High - P)
R1 = P * 2 - Low
R2 = P + (High - Low)
R3 = High + 2*(P - Low)
Woodie
Elle diffère de la méthode standard de calcul du point pivot. Il utilise la différence entre le haut et le bas de la veille, également connue sous le nom de range, pour calculer les niveaux de support et de résistance. Certains traders préfèrent utiliser les formules Woodie car elles donnent plus de poids au cours de clôture de la période précédente. Les points pivots Woodie peuvent être calculés comme suit.
R2 = P + (H - L)
R1 = (2 * P) - LOW
P = (HIGH + LOW + (CLOSE * 2)) / 4
S1 = (2 * P) - HIGH
S2 = P - (H - L)
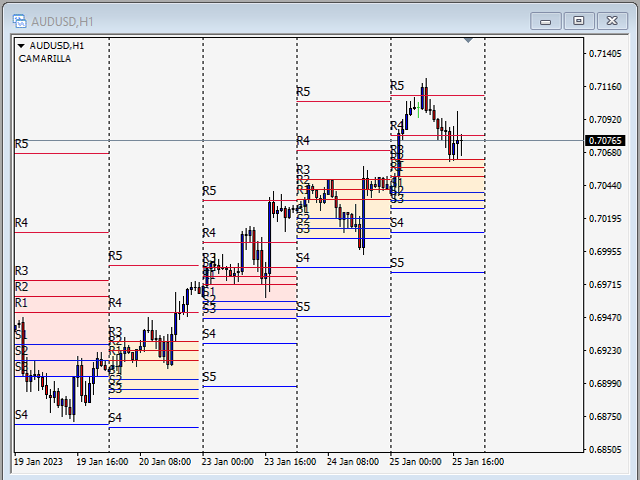
Camarilla
Les formules Camarilla sont similaires à la formule Woodie. Son idée de base est que le prix a tendance à revenir à sa moyenne. Les niveaux Camarilla aident à cibler des stop loss précis et à cibler des ordres de profit. Les niveaux les plus importants sont S3, S4 et R3, R4. Les points pivots Camarilla peuvent être calculés comme suit.
R4 = ((High - Low) * 1.1) / 2 + Close
R3 = ((High - Low) * 1.1) / 4 + Close
R2 = ((High - Low) * 1.1) / 6 + Close
R1 = ((High - Low) * 1.1) / 12 + Close
S1 = Close - ((High - Low) * 1.1) / 12
S2 = Close - ((High - Low) * 1.1) / 6
S3 = Close - ((High - Low) * 1.1) / 4
S4 = Close - ((High - Low) * 1.1) / 2
Fibonacci
Les niveaux de point de pivot Fibonacci sont déterminés en calculant d'abord le point de pivot, comme dans la méthode standard. Multipliez ensuite le range de la veille par le niveau Fibonacci correspondant.La plupart des traders utilisent des corrections de 38,2 %, 61,8 % et 100 % dans leurs calculs. La raison derrière cela est que de nombreux commerçants utilisent les cotes Fibonacci. Les points pivots Fibonacci peuvent être calculés comme suit.
Pivot Point (P) = (High + Low + Close)/3
Support 1 (S1) = P - (0.382 * (High - Low))
Support 2 (S2) = P - (0.6182 * (High - Low))
Support 3 (S3) = P - (1 * (High - Low))
Resistance 1 (R1) = P + (0.382 * (High - Low))
Resistance 2 (R2) = P + (0.6182 * (High - Low))
Resistance 3 (R3) = P + (1 * (High - Low))
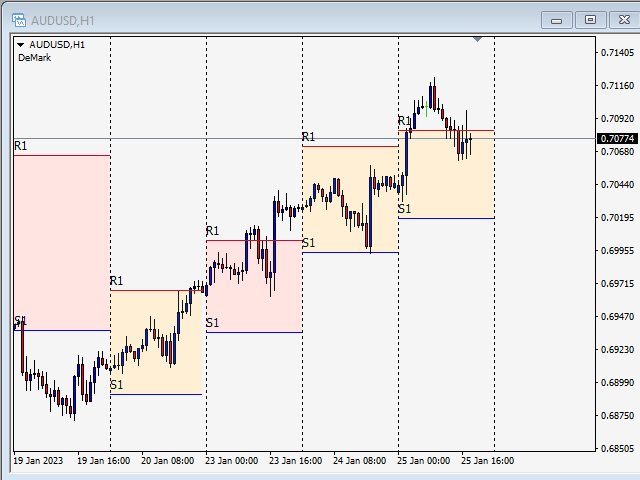
Demark
Ces points pivots ont un caractère conditionnel qui met davantage l'accent sur les mouvements de prix récents en fonction de la relation entre le cours d'ouverture et le cours de clôture. Les points pivots Demark peuvent être calculés comme suit.
If Close < Open, then X = High + (2 * Low) + Close
If Close > Open, then X = (2 * High) + Low + Close
If Close = Open, then X = High + Low + (2 * Close)
Support 1 (S1) = X/2 - High
Resistance 1 (R1) = X/2 - Low
gayet güzel olmuş. teşekkürler