• Aperçu
  • Avis
  • Commentaires

YKL Monte Carlo Simulation

Indicador Monte Carlo Simulation

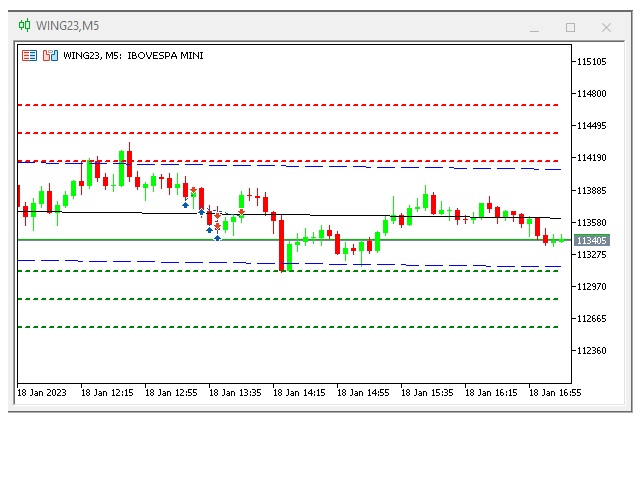
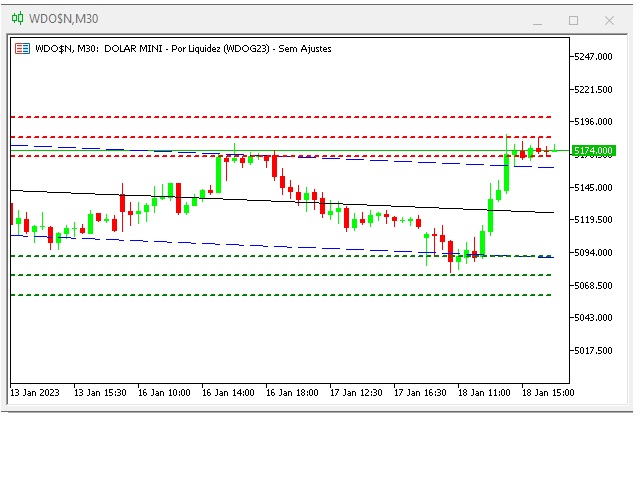
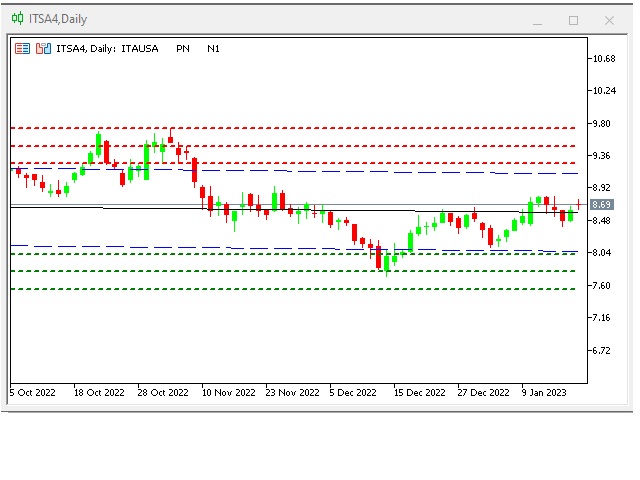
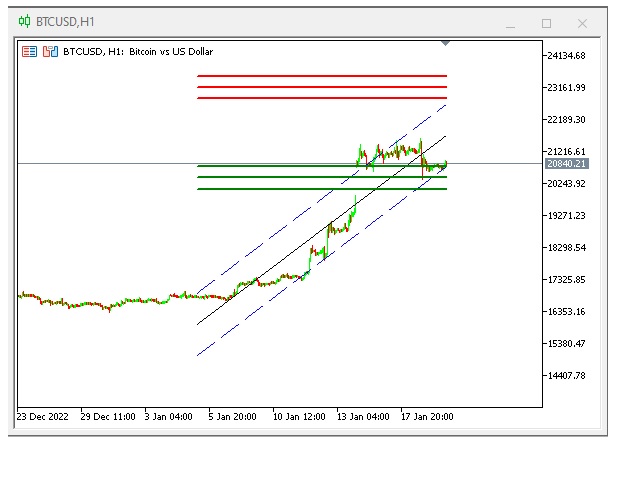
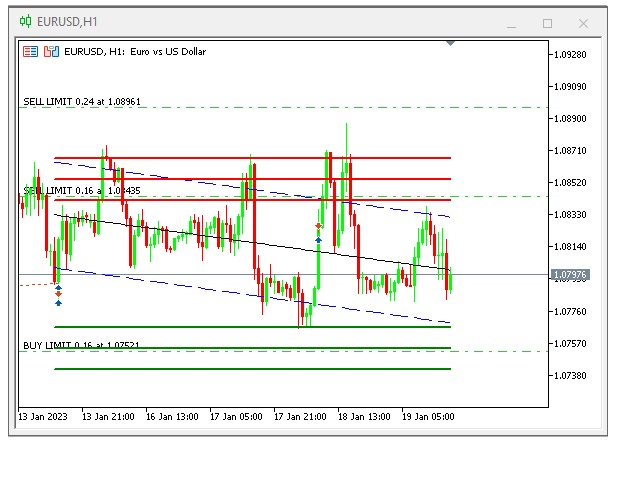
Indicador faz uma regressão linear nos preços de fechamento do ativo escolhido e gera uma simulação de Monte Carlo de N preços aleatórios para definir 3 níveis de sobrecompra e 3 níveis de sobrevenda.

O primeiro processo é a Regressão Linear dos preços de fechamento do ativo, no qual é regido pela equação:

Y = aX + b + R

Onde Y é o valor do ativo escolhido, X é o tempo, a é a inclinação da reta, b é a intersecção da reta e R é o resíduo.

O resíduo representa a quantidade da variabilidade do preço de Y que o modelo ajustado não consegue explicar.

Com a regressão feita, parte-se para a segunda etapa que é plotar a reta gerada pelo modelo e, com base na média e desvio padrão dos resíduos, fazer a geração de N preços aleatórios - Simulação de Monte Carlo. São calculados média e desvio padrão de todas as simulações geradas, plotando no indicador 3 níveis de sobrecompra e 3 níveis de sobrevenda.

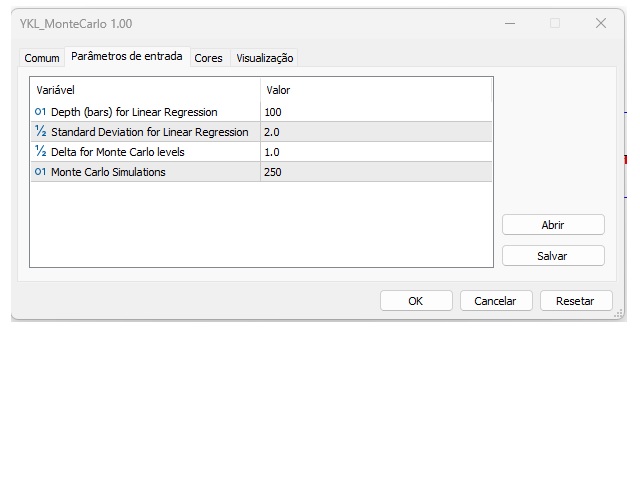
Inputs do indicador:

·         Barras de regressão: número de barras para que seja feita a regressão linear dos preços de fechamento do ativo escolhido.

·         Desvio Padrão: é o desvio informado para que seja feita a plotagem inicial da regressão linear.

·         Delta para níveis de Monte Carlo: valor para que sejam montados os níveis de sobrecompra e sobrevenda na Simulação de Monte Carlo. Exemplo: se o desvio padrão escolhido for 2 e o delta for 0.3, significa que os níveis de sobrecompra/sobrevenda seriam 2, 2.3 e 2.6 desvios, respectivamente.

·         Simulação Monte Carlo: número de simulações a serem geradas, ou seja, valores aleatórios com base na regressão e desvio da regressão.

Recomenda-se utilizar mínimo de 1 desvio padrão e mais de 100 simulações de Monte Carlo para que os resultados sejam mais precisos.

Indicador funciona para qualquer ativo em qualquer tempo gráfico, incluindo Forex.


Produits recommandés
LT Donchian Channel
Thiago Duarte
4.75 (4)
Donchian Channel is an indicator created by Richard Donchian. It is formed by taking the highest high and the lowest low of the last specified period in candles. The area between high and low is the channel for the chosen period. Its configuration is simple. It is possible to have the average between the upper and lower lines, plus you have alerts when price hits one side. If you have any questions or find any bugs, please contact me. Enjoy!
FREE
Follow The Line MT5
Oliver Gideon Amofa Appiah
4.4 (30)
This indicator obeys the popular maxim that: "THE TREND IS YOUR FRIEND" It paints a GREEN line for BUY and also paints a RED line for SELL. (you can change the colors). It gives alarms and alerts of all kinds. IT DOES NOT REPAINT and can be used for all currency pairs and timeframes. Yes, as easy and simple as that. Even a newbie can use it to make great and reliable trades. NB: For best results, get my other premium indicators for more powerful and reliable signals. Get them here: https://www.m
FREE
Rainbow MT5
Jamal El Alama
4.33 (3)
Description : Rainbow MT5 is a technical indicator based on Moving Average with period 34 and very easy to use. When price crosses above MA and MA changes color to green, then this is a signal to buy. When price crosses below MA and MA changes color to red, then this is a signal to sell. The Expert advisor ( Rainbow EA MT5 ) based on Rainbow MT5 indicator is now available here . MT4 version is available here .
FREE
Are you tired of drawing trendlines every time you're analyzing charts? Or perhaps you would like more consistency in your technical analysis. Then this is for you. This indicator will draw trend lines automatically when dropped on a chart. How it works Works similar to standard deviation channel found on mt4 and mt5. It has 2 parameters: 1. Starting Bar 2. Number of bars for calculation The   starting bar   is the bar which drawing of the trend lines will begin, while the   number of bars for c
FREE
Candle by Seconds
Marcelo Akio Iqueuti
4.63 (30)
It was developed especially for intraday operations, allowing the market operator to create unconventional candlestick charts, to escape the traditional points of OHLC (Open, Hight, Low and Close). This Expert Advisor (EA) assembles custom candles in any time frame by seconds unit. You can generate charts that are not available in standard Metatrader 5 periods, for example: Generate a chart of an unconventional time frame of 27 seconds or, if you want to generate 7 minutes time frame, jus
FREE
Bar Color Trend
Germano Chagas
4.5 (10)
Combining the best of Price Action , Directional Movement , and Divergence/Convergence analysis, Candle Color Trend is a easy and reliable way to identify trend direction. The indicator automatically paints the candles according to the assumption that an uptrend is defined by prices that form a series of higher highs and higher lows. In contrast, a downtrend is defined by prices that form a series of lower highs and lower lows. Additionally, ADX Wilder indicator is used to measure trend weakness
FREE
Weis Waves
Flavio Javier Jarabeck
3.15 (26)
The original author is David Weis, an expert in the Wyckoff Method. The Weis Wave is a modern adaptation of the 1930's Wyckoff Method, another expert in Tape Reading techniques and Chart Analysis. Weis Waves takes market volume and stacks it into waves according to price conditions giving the trader valuable insights about the market conditions. If you want to learn more about this subject you can find tons of videos in YouTube. Just look for "The Wickoff Method", "Weis Wave" and "Volume Spread
FREE
Important Lines
Terence Gronowski
4.88 (26)
This indicator displays Pivot-Lines, preday high and low, preday close and the minimum and maximum of the previous hour. You just have to put this single indicator to the chart to have all these important lines, no need to setup many single indicators. Why certain lines are important Preday high and low : These are watched by traders who trade in a daily chart. Very often, if price climbs over or falls under a preday low/high there is an acceleration in buying/selling. It is a breakout out of
FREE
Tabajara V5
Flavio Javier Jarabeck
4.87 (38)
Metatrader 5 version of the famous Andre Machado's Tabajara indicator. If you don't know Andre Machado's Technical Analysis work you don't need this indicator... For those who need it and for those several friend traders who asked this porting from other platforms, here it is... FEATURES 8-period Moving Average 20-period Moving Average 50-period Moving Average 200-period Moving Average Colored candles according to the inflexion of the 20-period MA SETTINGS You can change the Period of all M
FREE
Value Chart Candlesticks
Flavio Javier Jarabeck
4.67 (9)
The idea of a Value Chart indicator was presented in the very good book I read back in 2020 , " Dynamic Trading Indicators: Winning with Value Charts and Price Action Profile ", from the authors Mark Helweg and David Stendahl. The idea is simple and the result is pure genius: Present candlestick Price analysis in a detrended way! HOW TO READ THIS INDICATOR Look for Overbought and Oversold levels. Of course, you will need to test the settings a lot to find the "correct" one for your approach.
FREE
Automatic Trendlines
Pasi Hakamaki
4.64 (50)
The indicator draws trendlines on chart. This indicator has six inputs. User can specify alternative labels for both lines. If multiple instances of the indicator are used, the labels must differ. User can set width and color of the lines and depth which specifies what significant peaks should be used. For example, Depth=10 sets trendlines using the current peaks and valleys that have at least 10 bars to the right and to the left and that have highs/lows less/greater than the peak's high/low. In
FREE
Free automatic Fibonacci is an indicator that automatically plots a Fibonacci retracement based on the number of bars you select on the BarsToScan setting in the indicator. The Fibonacci is automatically updated in real time as new highest and lowest values appears amongst the selected bars. You can select which level values to be displayed in the indicator settings. You can also select the color of the levels thus enabling the trader to be able to attach the indicator several times with differe
FREE
PZ Penta O MT5
PZ TRADING SLU
4 (6)
The Penta-O is a 6-point retracement harmonacci pattern which usually precedes big market movements. Penta-O patterns can expand and repaint quite a bit. To make things easier this indicator implements a twist: it waits for a donchian breakout in the right direction before signaling the trade. The end result is an otherwise repainting indicator with a very reliable trading signal. The donchian breakout period is entered as an input. [ Installation Guide | Update Guide | Troubleshooting | FAQ | A
FREE
Waves Sizer
Flavio Javier Jarabeck
3.67 (6)
Wyckoff fans, enjoy! Ideally to be used with the Weis Waves indicator, but it can be easily used alone, the Waves Sizer puts the range (in resulting Price movement) done by the Price on its market swings. You can control how accurate or loose will be the swings. This tool is very helpful for visually know how much the Price has traveled in your Timeframe. This way you can confront this level of effort with the resulting Volume, etc... Weis Waves indicator: https://www.mql5.com/en/market/pro
FREE
Aggression Volume
Flavio Javier Jarabeck
3.8 (20)
Aggression Volume Indicator is the kind of indicator that is rarely found in the MQL5 community because it is not based on the standard Volume data provided by the Metatrader 5 platform. It requires the scrutiny of all traffic Ticks requested on the platform... That said, Aggression Volume indicator requests all Tick Data from your Broker and processes it to build a very special version of a Volume Indicator, where Buyers and Sellers aggressions are plotted in a form of Histogram. Additionally,
FREE
Donchian Pro
Paulo Henrique Faquineli Garcia
5 (2)
The Donchian Channel Channels are among the most popular tools of technical analysis, as they visually convey to the analyst the limits within which most price movement tends to occur. Channel users know that valuable information can be obtained at any time, whether prices are in the central region of a band or close to one of the border lines. One of the best known techniques to explore these concepts is Bollinger Bands. However, John Bollinger was not the only one to research the applicatio
FREE
A countdown timer for the  Volume bar chart generator  and  Tick chart generator  products, which are available for download from the MQL5 Market: Tick chart generator: https://www.mql5.com/en/market/product/29215 Volume bar chart generator: https://www.mql5.com/en/market/product/47197 The counter conveniently displays the number of ticks or transactions (depending on the chart) that need to pass for a new bar to start printing. The user can set the following indicator inputs. Volume type
FREE
What is this indicator? This indicator is the MACD (Moving Average Convergence/Divergence) supporting Virtual Trading mode of  Knots Compositor . When the mode is turned on, the indicator will be recalculated based on the displayed candlesticks. When the mode is turned off, the indicator will be recalculated based on the original chart candlesticks. Types of the applied price - Close - Open - High - Low - Median Price (HL/2) - Typical Price (HLC/3) - Weighted Price (HLCC/4) KC-Indicators
FREE
This indicator sums up the difference between the sells aggression and the buys aggression that occurred in each Candle, graphically plotting the waves of accumulation of the aggression volumes.   Through these waves an exponential average is calculated that indicates the direction of the business flow. Note: This indicator DOES NOT WORK for Brokers and/or Markets WITHOUT the type of aggression (BUY or SELL).   Be sure to try our Professional version with configurable features and alerts:  Agr
FREE
This is a buyer and seller aggression indicator that analyzes the shape of each candle and project this data in a histogram form. There are 4 histograms in one. On the front we have two: Upper - Buyer force. Lower - Seller force. At the background we also have two histogram, both with same color. They measure the combined strenght of buyers and sellers. This histograms can be turned off in Input Parameters. It is also possible to have the real or tick volume to help on this force measurement. IN
FREE
MIDAS Super VWAP
Flavio Javier Jarabeck
4.29 (14)
Imagine VWAP, MVWAP and MIDAS in one place... Well, you found it! Now you can track the movement of Big Players in various ways, as they in general pursue the benchmarks related to this measuring, gauging if they had good execution or poor execution on their orders. Traders and analysts use the VWAP to eliminate the noise that occurs throughout the day, so they can measure what prices buyers and sellers are really trading. VWAP gives traders insight into how a stock trades for that day and deter
FREE
Dual RSI
Paul Conrad Carlson
Indicator alerts for Dual Relative strength index rsi. Large rsi preset at 14 is below 30 small rsi preset at 4 is below 10 for buy bullish signals . Large rsi preset are 14 is above 70 small rsi preset at 4 is above 90 for sell bearish signals . Includes mobile and terminal alerts. draws lines when alerts. This indicator can help identify extremes and then the tops or bottoms of those extremes .
FREE
This indicator is a zero-lag indicator and displays  strength of trend change . True Trend  Oscillator Pro works best in combination with True Trend Moving Average Pro that displays exact trend as is. Oscillator value is exact price change in given direction of the trend. True Trend Moving Average Pro: https://www.mql5.com/en/market/product/103586 If you set PERIOD input parameter to 1 this indicator becomes a sharpshooter for binary options. Developers can use True Trend Oscillator in E
FREE
Cybertrade Keltner Channels
Emanuel Andriato
4.67 (3)
Cybertrade Keltner Channels - MT5 Created by Chester Keltner, this is a volatility indicator used by technical analysis. It is possible to follow the trend of financial asset prices and generate support and resistance patterns. In addition, envelopes are a way of tracking volatility in order to identify opportunities to buy and sell these assets. It works on periods longer than the period visible on the chart. All values ​​are available in the form of buffers to simplify possible automations.
FREE
Cumulative Delta MT5
Evgeny Shevtsov
4.47 (57)
The indicator analyzes the volume scale and splits it into two components - seller volumes and buyer volumes, and also calculates the delta and cumulative delta. The indicator does not flicker or redraw, its calculation and plotting are performed fairly quickly, while using the data from the smaller (relative to the current) periods. The indicator operation modes can be switched using the Mode input variable: Buy - display only the buyer volumes. Sell - display only the seller volumes. BuySell -
FREE
Simple Weis Wave
Jean Jacques Huve Ribeiro
4.2 (5)
One of the best tools for analyzing volume, Weis Wave was idelized by David Weis, to facilitate the reading of directional flow. For the VSA method disciples it is an evolution of the practices created by Richard Wycoff, facilitating a predictive reading of the market, always seeking an accumulation and distribution of the negotiated contracts. Cumulative wave volume  Range of wave ( removed) Average Wave volume Ref "Tim Ord lectures" ( removed)
FREE
This indicator is especially for the binary trading. Time frame is 1 minutes and exp time 5 or 3 minutes only. You must be use martingale 3 step. So you must put lots size is 10 % at most. You should use Mt2 trading platform to connect with my indicator to get more signal without human working. This indicator wining rate is over 80% but you may get 100% of profit by using martingale 3 step. You should use MT2 Trading Platform to connect meta trader platform and binary platform . You can get mt2
FREE
Stat Monitor 5
Sergei Linskii
5 (1)
Stat Monitor is a good information indicator. Benefits of the indicator: The indicator provides useful information - the current spread, the cost of one lot of the symbol, trading leverage and the recommended lot size for trading. You can use the indicator on the MetaTrader 5 trading platform of any broker. The indicator provides useful information. Version of the Stat Monitor indicator for MetaTrader 4 I wish you all good luck in trading and stable profit!
FREE
Santa Donchian
Marco Aurelio Cestari
4.17 (6)
Santa Donchian Indicator  is an efficient way to detect support, resistence and break outs in any market. The Donchian channel measures the high and the low of a previously defined range.  Typically, a trader would look for a well-defined range and then wait for the price to break out to either one side for a trade entry trigger. Advantages Never repaints, never backpaints, never recalculates. Works in all symbols and all timeframes. Perfect trend filter for any strategy or expert advisor. Fu
FREE
White Weis Volume Ticks
Ricardo Almeida Branco
5 (3)
White Weis Volume This indicator shows the sum of the volume in each wave, bulish or bearish, as idealized by David Weis , but it brings an important addition , which is the marking of the bar with the highest volume of the wave (White Bar)! In coding the indicator, it was sought to optimize the code to require minimal processing during use and not to overload mt5. The indicator can be used for pre-trading analysis and study, where the trader analyzes possible points of support and resi
Les acheteurs de ce produit ont également acheté
Tout d'abord, il convient de souligner que ce système de trading est un indicateur non repeint, non redessiné et non retardé, ce qui le rend idéal pour le trading manuel et automatisé. Le "Système de Trading Smart Trend MT5" est une solution de trading complète conçue pour les traders débutants et expérimentés. Il combine plus de 10 indicateurs premium et propose plus de 7 stratégies de trading robustes, ce qui en fait un choix polyvalent pour différentes conditions de marché. Stratégie de suivi
Atomic Analyst MT5
Issam Kassas
5 (11)
Tout d'abord, il convient de souligner que cet indicateur de trading n'est ni repainting, ni redrawing et ne présente aucun délai, ce qui le rend idéal à la fois pour le trading manuel et automatisé. L'Analyste Atomique est un indicateur d'action sur les prix PA qui utilise la force et le momentum du prix pour trouver un meilleur avantage sur le marché. Équipé de filtres avancés qui aident à éliminer les bruits et les faux signaux, et à augmenter le potentiel de trading. En utilisant plusieur
Quantum Trend Sniper
Bogdan Ion Puscasu
5 (37)
Présentation       Quantum Trend Sniper Indicator   , l'indicateur révolutionnaire MQL5 qui transforme la façon dont vous identifiez et négociez les inversions de tendance ! Développé par une équipe de traders expérimentés avec une expérience commerciale de plus de 13 ans,       Indicateur Quantum Trend Sniper       est conçu pour propulser votre parcours de trading vers de nouveaux sommets grâce à sa manière innovante d'identifier les inversions de tendance avec une précision extrêmement élevée
FX Volume MT5
Daniel Stein
4.94 (17)
Obtenez votre mise à jour quotidienne du marché avec des détails et des captures d'écran via notre Morning Briefing ici sur mql5 et sur Telegram ! FX Volume est le PREMIER et SEUL indicateur de volume qui fournit un VRAI aperçu du sentiment du marché du point de vue d'un courtier. Il fournit des informations impressionnantes sur la façon dont les acteurs institutionnels du marché, comme les courtiers, sont positionnés sur le marché des changes, bien plus rapidement que les rapports COT. Voir c
Gold Stuff mt5
Vasiliy Strukov
4.89 (166)
Gold Stuff mt5 est un indicateur de tendance conçu spécifiquement pour l'or et peut également être utilisé sur n'importe quel instrument financier. L'indicateur ne se redessine pas et ne traîne pas. Délai recommandé H1. Contactez-moi immédiatement après l'achat pour obtenir les réglages et un bonus personnel !   RÉGLAGES Dessiner la flèche - on off. dessiner des flèches sur le graphique. Alertes - activation et désactivation des alertes sonores. Notification par e-mail - activé désactivé.
Trend Screener Pro MT5
STE S.S.COMPANY
4.89 (61)
Indicateur de tendance, solution unique révolutionnaire pour le trading et le filtrage des tendances avec toutes les fonctionnalités de tendance importantes intégrées dans un seul outil ! Il s'agit d'un indicateur multi-période et multi-devises 100 % non repeint qui peut être utilisé sur tous les symboles/instruments : forex, matières premières, crypto-monnaies, indices et actions. Trend Screener est un indicateur de suivi de tendance efficace qui fournit des signaux de tendance fléchés avec des
FX Power MT5 NG
Daniel Stein
5 (4)
Obtenez votre mise à jour quotidienne du marché avec des détails et des captures d'écran via notre Morning Briefing ici sur mql5 et sur Telegram ! FX Power MT5 NG est la nouvelle génération de notre très populaire indicateur de force des devises, FX Power. Et qu'est-ce que ce compteur de force de nouvelle génération offre ? Tout ce que vous avez aimé de l'original FX Power PLUS Analyse de la force de l'OR/XAU Des résultats de calcul encore plus précis Périodes d'analyse configurables individuel
Top indicator for MT5   providing accurate signals to enter a trade without repainting! It can be applied to any financial assets:   forex, cryptocurrencies, metals, stocks, indices .  Watch  the video  (6:22) with an example of processing only one signal that paid off the indicator! MT4 version is here It will provide pretty accurate trading signals and tell you when it's best to open a trade and close it. Most traders improve their trading results during the first trading week with the help of
Tout d'abord, il convient de souligner que cet outil de trading est un indicateur non repeint, non redessiné et non retardé, ce qui le rend idéal pour le trading professionnel. L'indicateur Smart Price Action Concepts est un outil très puissant à la fois pour les nouveaux et les traders expérimentés. Il regroupe plus de 20 indicateurs utiles en un seul, combinant des idées de trading avancées telles que l'analyse du trader Inner Circle et les stratégies de trading Smart Money Concepts. Cet in
RelicusRoad Pro MT5
Relicus LLC
4.82 (22)
Maintenant 147 $ (augmentant à 499 $ après quelques mises à jour) - Comptes illimités (PCS ou Mac) Manuel d'utilisation RelicusRoad + Vidéos de formation + Accès au groupe Discord privé + Statut VIP UNE NOUVELLE FAÇON DE REGARDER LE MARCHÉ RelicusRoad est l'indicateur de trading le plus puissant au monde pour le forex, les contrats à terme, les crypto-monnaies, les actions et les indices, offrant aux traders toutes les informations et tous les outils dont ils ont besoin pour rester renta
Auto Order Block with break of structure based on ICT and Smart Money Concepts Futures Break of Structure ( BoS )             Order block ( OB )            Higher time frame Order block / Point of Interest ( POI )    shown on current chart           Fair value Gap ( FVG ) / Imbalance   ,  MTF      ( Multi Time Frame )    Volume Imbalance     ,  MTF          vIMB Gap’s Equal High / Low’s     ,  MTF             EQH / EQL Liquidity               Current Day High / Low           HOD /
AW Trend Predictor MT5
AW Trading Software Limited
4.76 (55)
La combinaison des niveaux de tendance et de panne dans un seul système. Un algorithme d'indicateur avancé filtre le bruit du marché, détermine la tendance, les points d'entrée, ainsi que les niveaux de sortie possibles. Les signaux indicateurs sont enregistrés dans un module statistique, qui vous permet de sélectionner les outils les plus appropriés, montrant l'efficacité de l'historique des signaux. L'indicateur calcule les marques Take Profit et Stop Loss. Manuel et instruction ->   ICI   / v
Blahtech Supply Demand MT5
Blahtech Limited
4.57 (14)
Was: $299  Now: $99   Supply Demand uses previous price action to identify potential imbalances between buyers and sellers. The key is to identify the better odds zones, not just the untouched ones. Blahtech Supply Demand indicator delivers functionality previously unavailable on any trading platform. This 4-in-1 indicator not only highlights the higher probability zones using a multi-criteria strength engine, but also combines it with multi-timeframe trend analysis, previously confirmed swings
ICT, SMC, SMART MONEY CONCEPTS, SMART MONEY, Smart Money Concept, Support and Resistance, Trend Analysis, Price Action, Market Structure, Order Blocks, BOS/CHoCH,   Breaker Blocks ,  Momentum Shift,   Supply&Demand Zone/Order Blocks , Strong Imbalance,   HH/LL/HL/LH,    Fair Value Gap, FVG,  Premium  &   Discount   Zones, Fibonacci Retracement, OTE, Buy Side Liquidity, Sell Side Liquidity, BSL/SSL Taken, Equal Highs & Lows, MTF Dashboard, Multiple Time Frame, BigBar, HTF OB, HTF Market Structure
L'indicateur de Carré Gann est un puissant outil d'analyse du marché basé sur l'article "Formule Mathématique pour les Prédictions de Marché" écrit par W.D. Gann. Cet outil utilise des concepts mathématiques et des théories de Gann pour réaliser une analyse précise du marché. Il utilise les carrés de 144, 90, 52 et aussi le carré de 9. De plus, il intègre la méthode du  pour le carré de 9 et sa relation avec les canaux et le modèle en étoile de ce carré. Manuel d'Utilisateur et Application : Ava
TPSpro TRENDPRO  - is a trend indicator that automatically analyzes the market and provides information about the trend and each of its changes, as well as giving signals for entering trades without redrawing! The indicator uses each candle, analyzing them separately. referring to different impulses - up or down impulse. Exact entry points into transactions for currencies, crypto, metals, stocks, indices!  -  Version MT4                  DETAILED DESCRIPTION        /       TRADING SETUPS       
Advanced Supply Demand MT5
Bernhard Schweigert
4.53 (15)
La meilleure solution pour tout commerçant débutant ou expert ! Cet indicateur est un outil de trading unique, de haute qualité et abordable car nous avons intégré un certain nombre de fonctionnalités propriétaires et une nouvelle formule. Avec cette mise à jour, vous pourrez afficher des zones à double horaire. Vous pourrez non seulement afficher un TF plus élevé, mais afficher les deux, le graphique TF, PLUS le TF supérieur : AFFICHAGE DES ZONES NICHÉES. Tous les traders Supply Demand vont ado
Dessine automatiquement les niveaux de support et de résistance PLUS les écarts des bougies de propulsion sur votre graphique, afin que vous puissiez voir où le prix est susceptible de se diriger ensuite et/ou de s'inverser potentiellement. Cet indicateur est conçu pour être utilisé dans le cadre de la méthodologie de trading de position enseignée sur mon site web (The Market Structure Trader) et affiche des informations clés pour le ciblage et les entrées potentielles. MT4 Version:  https://
A key element in trading is zones or levels from which decisions to buy or sell a trading instrument are made. Despite attempts by major players to conceal their presence in the market, they inevitably leave traces. Our task was to learn how to identify these traces and interpret them correctly. Reversal First Impulse levels (RFI)   -  Version MT4                  INSTRUCTIONS                 RUS                 ENG                         R ecommended to use with an indicator   -  TREND PRO  
Le profit de la structure du marché change à mesure que le prix s'inverse et recule. L'indicateur d'alerte d'inversion de la structure du marché identifie le moment où une tendance ou un mouvement de prix approche de l'épuisement et est prêt à s'inverser. Il vous avertit des changements dans la structure du marché qui se produisent généralement lorsqu'un renversement ou un recul majeur est sur le point de se produire. L'indicateur identifie initialement les cassures et la dynamique des prix,
Présentation       Quantum Breakout PRO   , l'indicateur révolutionnaire MQL5 qui transforme la façon dont vous négociez les zones d'évasion ! Développé par une équipe de traders expérimentés avec une expérience commerciale de plus de 13 ans,       Évasion quantique PRO       est conçu pour propulser votre parcours commercial vers de nouveaux sommets grâce à sa stratégie de zone de discussion innovante et dynamique. Quantum Breakout Indicator vous donnera des flèches de signalisation sur le
TrendLine PRO MT5
Evgenii Aksenov
4.78 (49)
The Trend Line PRO indicator is an independent trading strategy. It shows the trend change, the entry point to the transaction, as well as automatically calculates three levels of Take Profit and Stop Loss protection Trend Line PRO is perfect for all Meta Trader symbols: currencies, metals, cryptocurrencies, stocks and indices Advantages of Trend Line PRO Never redraws its signals The possibility of using it as an independent strategy It has three automatic levels Take Profit and Stop Loss lev
XQ Indicator MetaTrader 5
Marzena Maria Szmit
5 (1)
Step into the realm of Forex trading with confidence and precision using XQ, a cutting-edge Forex indicator designed to elevate your trading game to unprecedented heights. Whether you're a seasoned trader or just stepping into the world of currency exchange, XQ Forex Indicator empowers you with the insights and signals needed to make informed trading decisions. The signal conditions are a combination of three indicators, and XQ Forex Indicator only display  medium and long-term trends . The ind
Trend Line Map Pro MT5
STE S.S.COMPANY
4.67 (9)
Trend Line Map indicator is an addons for   Trend Screener Indicator . It's working as a scanner for all signals generated by Trend screener ( Trend Line Signals ) . It's a Trend Line Scanner based on Trend Screener Indicator.  If you don't have Trend Screener Pro Indicator,   the Trend Line Map Pro will not work.     LIMITED TIME OFFER : Trend Line Map Indicator is available for only 50 $ and lifetime. ( Original price 125$ ) By accessing to our MQL5 Blog,  you can find all our premium indica
TrendDecoder Premium MT5
Christophe, Pa Trouillas
5 (1)
Identifiez les ranges et les tendances fortes  |  Obtenez les premiers signaux   |    Obtenez des TP et des sorties   clairs   |    Repérer les niveaux Fibo que le prix va tester   |  Indicateur qui ne retrace pas, non retardé - idéal pour le trading manuel et automatisé - adapté à tous les actifs et à toutes les unités de temps - 50% discount   pour le lancement - puis retour à >>   149 $ Après votre achat,   contactez-moi sur ce canal  pour obtenir les réglages recommandés. Version MT4 :   cli
MetaBands M5
Vahidreza Heidar Gholami
4.67 (3)
MetaBands uses powerful and unique algorithms to draw channels and detect trends so that it can provide traders with potential points for entering and exiting trades. It’s a channel indicator plus a powerful trend indicator. It includes different types of channels which can be merged to create new channels simply by using the input parameters. MetaBands uses all types of alerts to notify users about market events. Features Supports most of the channel algorithms Powerful trend detection algorith
Was: $249  Now: $99   Market Profile defines a number of day types that can help the trader to determine market behaviour. A key feature is the Value Area, representing the range of price action where 70% of trading took place. Understanding the Value Area can give traders valuable insight into market direction and establish the higher odds trade. It is an excellent addition to any system you may be using. Inspired by Jim Dalton’s book “Mind Over Markets”, this indicator is designed to suit the
Malaysian SNR Levels
Matthias Horst Pieroth
This indicator can be used to display Support and Resistance levels according to  the  Malaysian SNR concept , in which Support and Resistance are exact levels of a line chart. Malaysian SNR There are 3 different horizontal levels in Malaysian SNR: A-Level : This level is located at the peak of this line chart. (shape looks like the letter A) V-Level : Level at the valley of a line chart, (shape looks like the letter V) Gap-Leve l: This level is located at the Close/Open gap between two cand
The Volume by Price Indicator for MetaTrader 5 features Volume Profile and Market Profile TPO (Time Price Opportunity). Get valuable insights out of currencies, equities and commodities data. Gain an edge trading financial markets. Volume and TPO histogram bar and line charts. Volume Footprint charts. TPO letter and block marker charts including split structures. Versatile segmentation and compositing methods. Static, dynamic and flexible ranges with relative and/or absolute visualizations. Lay
ICT Silver Bullet MT5
Haidar, Lionel Haj Ali
5 (19)
ICT Silver Bullet If you are searching for a reliable indicator to trade the ICT Silver Bullet concept, or ICT concepts, Smart Money Concepts, or SMC, this indicator will respond to your need!  Before version 2.2, this indicator was focused only on ICT Silver Bullet, but moving forward, we will include the different elements for smart money concept trading. This indicator will help you identify the following: FVG - fair value gaps Market structure: BOS and CHOCH. It is based on ZIGZAG as it is
Plus de l'auteur
YKL Multiple Regression
Ygor Keller Luccas
5 (1)
Indicador Multiple Regression Indicador faz o plot da  Curva de Retorno  e dos canais superior e inferior de uma  regressão para os preços de fechamento do ativo do gráfico. A  Curva de Retorno  é a linha central do indicador e representa a região de equilíbrio do preço entre vendedores e compradores. Nesse indicador o usuário escolhe o tipo da regressão podendo ser de 3 tipos: primeiro grau, segundo grau ou terceiro grau. Os plots do indicador são: Linha central – cor padrão preta; Linha superi
FREE
YKL DinDX
Ygor Keller Luccas
5 (2)
Dynamic Indicator --> YKL_DinDX Dynamic Indicator that creates a Band based on the distance from moving average specified by the user. The indicator considers the period entered by the user in order to calculate the average distance from moving average, creating an upper band and a lower band. This indicator is utilized by EA YKL_Scalper, version 2.0 or superior.
FREE
Indicador Regressão Linear – Par de Ativos Indicador é um oscilador que faz o plot do Resíduo resultado da regressão linear entre os dois ativos inseridos como input do indicador, representado pela fórmula: Y = aX + b + R Onde Y é o valor do ativo dependente, X é o valor do ativo independente, a é a inclinação da reta entre os dois ativos, b é a intersecção da reta e R é o resíduo. O resíduo representa a quantidade da variabilidade que Y que o modelo ajustado não consegue explicar. E os resíduos
FREE
YKL Maps
Ygor Keller Luccas
5 (1)
Indicador MAPS Indicador é um oscilador que faz o plot da Curva de Retorno de uma regressão de segundo grau para os preços de fechamento do ativo do gráfico. A Curva de Retorno é a linha central do indicador MAPS e representa a região de equilíbrio do preço entre vendedores e compradores. Os plots do indicador são: Linha central - C0 - cor da mesma varia de acordo com a tendência do mercado, sendo verde para tendência de alta e vermelho para baixa; Linhas superiores: S1, S2, S3 e S4, sendo que a
FREE
Indicador Regressão Linear – Par de Ativos - INTRADAY Indicador é um oscilador que faz o plot do Resíduo resultado da regressão linear entre os dois ativos inseridos como input do indicador, representado pela fórmula: Y = aX + b + R Onde Y é o valor do ativo dependente, X é o valor do ativo independente, a é a inclinação da reta entre os dois ativos, b é a intersecção da reta e R é o resíduo. O resíduo representa a quantidade da variabilidade que Y que o modelo ajustado não consegue explicar. E
FREE
Indicador Volatilidade Histórica Indicador é um oscilador que faz o plot da volatilidade histórica de um ativo, representado pelas fórmulas: Volatilidade Histórica = Raiz quadrada da média das diferenças ao quadrado * Fator de anualização. Média das diferenças ao quadrado = soma de todas as diferenças de retorno diário / número total das diferenças. Retorno diário = (preço atual - preço anterior) / preço anterior. Nesse indicador estamos utilizando os preços de fechamento de cada barra e fazemos
FREE
Estratégia Bandas de Bollinger (“Estratégia da Paula”) Estratégia A estratégia desse robô é baseada no retorno as médias, operando o indicador Bandas de Bollinger. Essa estratégia é popularmente conhecida como “Estratégia da Paula”. Basicamente o robô fica monitorando barras que rompam a Banda de Bollinger (tanto a superior quanto a inferior) para depois voltar para dentro da Banda na próxima barra. Se a condição acima for satisfeita, considerando também os demais parâmetros do robô, o mesmo
YKL Scalper 8
Ygor Keller Luccas
YKL Scalper   Estrategia YKL Scalper - NOVA VERSÃO 8.0   Estratégia Afastamento da Média Móvel Estratégia A estratégia desse robô é baseada no afastamento do preço em relação as médias móveis, operando o indicador Média Móvel, standard do MT5. Basicamente o robô fica monitorando o afastamento da média móvel, conforme distância DX inserida pelo usuário. Quando o afastamento atinge a distância DX, o robô inicia uma operação de compra ou venda, no sentido de voltar ao encontro da média móvel.
YKL Quant
Ygor Keller Luccas
EA YKL Quant Esse EA faz operações de compra e venda de dois pares de ativos com base no Resíduo  resultado da regressão linear entre esses dois ativos, representado pela fórmula: Y = aX + b + R Onde  Y  é o valor do ativo dependente,  X  é o valor do ativo independente,  a  é a inclinação da reta (Beta) entre os dois ativos,  b  é a intersecção da reta e  R  é o resíduo. O resíduo representa a quantidade da variabilidade que Y que o modelo ajustado não consegue explicar. E os resíduos podem ser
YKL DayTrade
Ygor Keller Luccas
EA YKL DayTrade Esse EA faz operações de compra de ações da bolsa Brasileira B3 de acordo com uma das 3 estratégias pré-definidas e realiza a venda das mesmas no final do dia (operação DAYTRADE). Cada estratégia tem um algoritmo de cálculo do valor de entrada (compra), do stop loss e possíveis filtros. Estratégias : JoeBiden : entrada com 1.5% de desconto em relação às duas mínimas anteriores saída no final do dia stop loss de 4% em relação a entrada timeframe diário sem filtros Chicotada : entr
Filtrer:
Aucun avis
Répondre à l'avis