• Aperçu
  • Avis
  • Commentaires
  • Nouveautés

MR Dynamic POC 5

The most crucial price level in any "Volume Profile" is the "Point of Control". Is the price level with the highest traded volume. And mainly, is the level where the big guys start there their positions, so it's an accumulation/distribution level for smart money.

The idea of the indicator arose after the "MR Volume Profile Rectangles" indicator was made. When creating the "MR Volume Profile Rectangles" indicator, we spent a lot of time comparing the volumes with those from the volume profile in NinjaTrader 8 terminal with CQG datafeed. The settings of EURUSD-6E, GBPUSD-6B, AUDUSD-6A and other currency pairs were compared. After making sure that everything is working according to our requirements, we made the "MR Dynamic POC" indicator following the model used in NinjaTrader 8.

Some of the important benefits of the indicator are as follows:

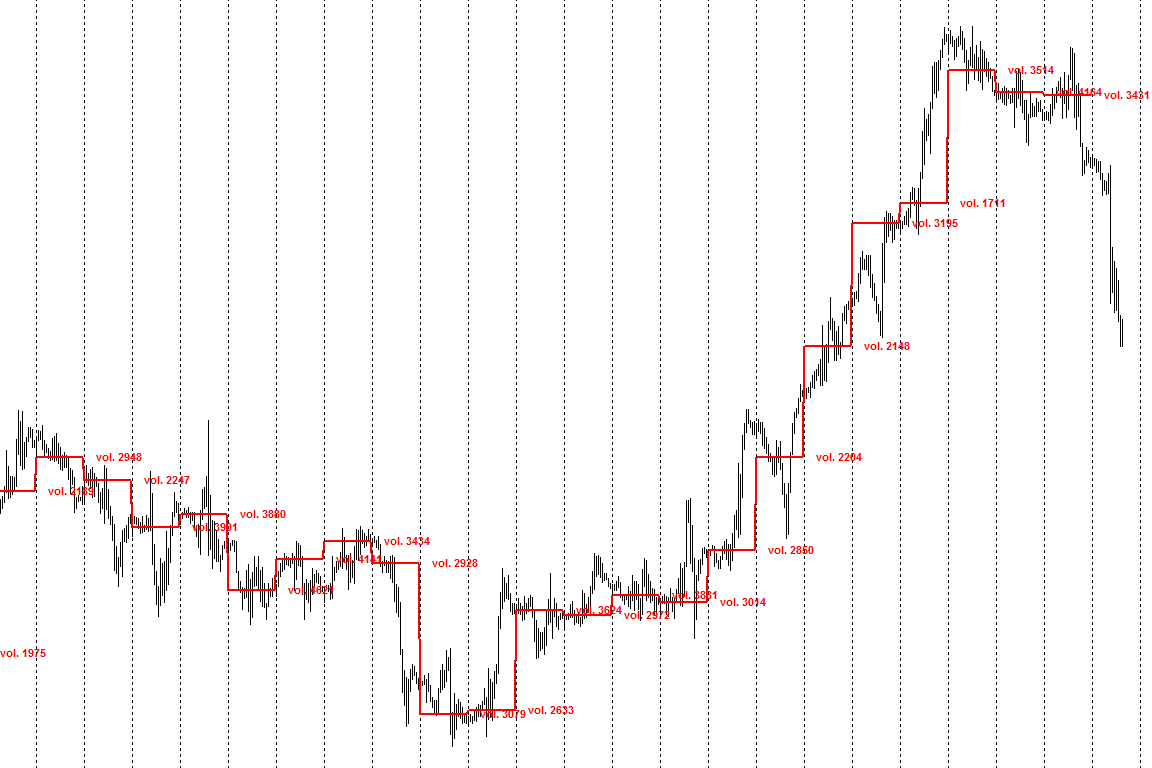
    • The indicator can show the price changes of the maximum volume accumulation (POC).
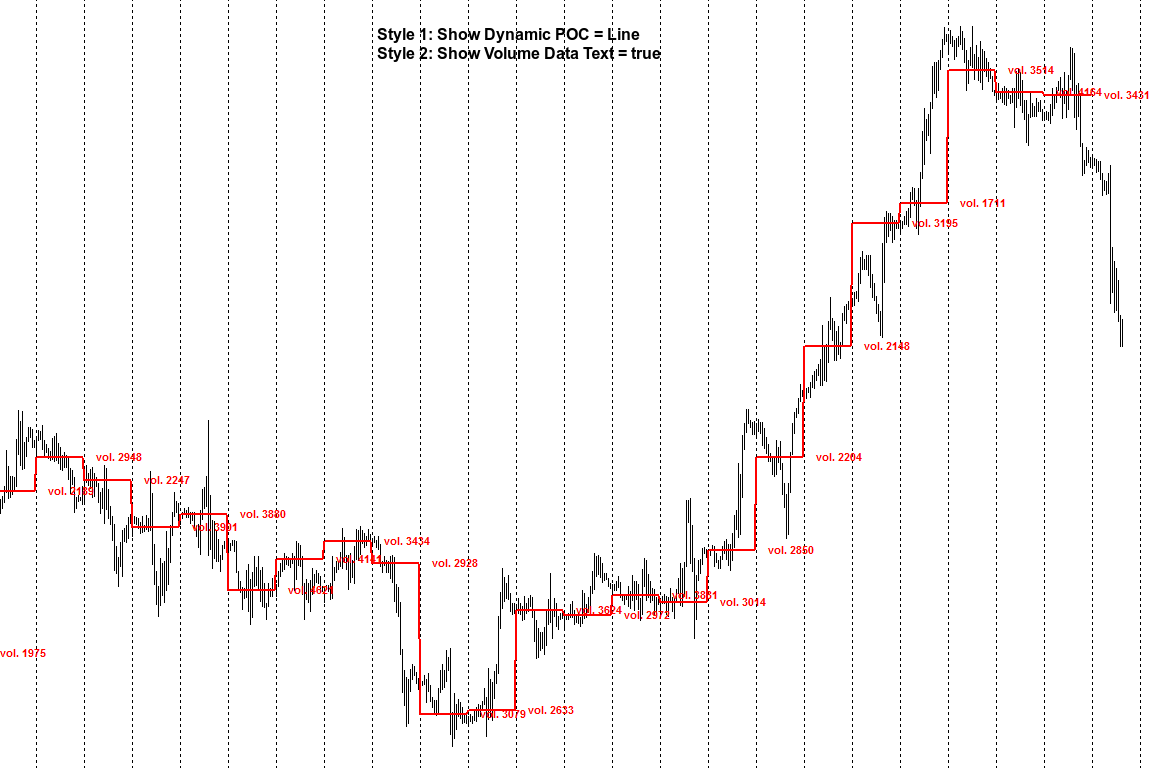
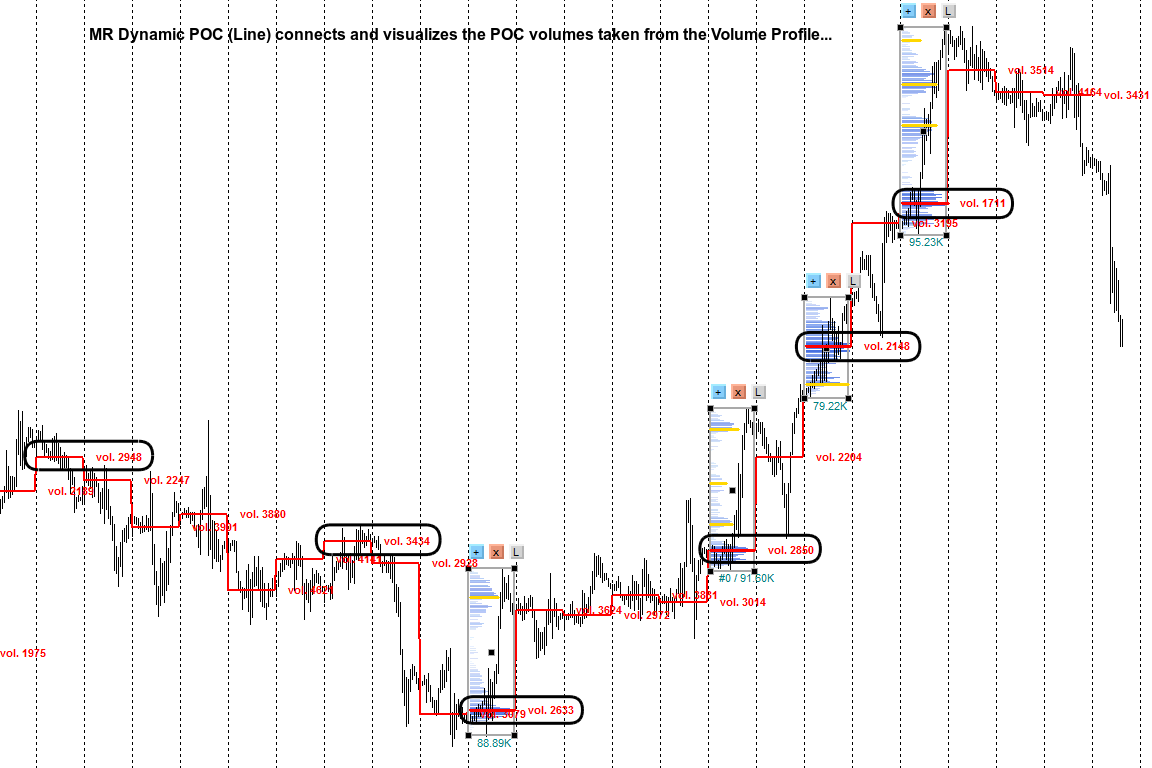
        • Dynamic POC "Line" - connects and visualizes the POC volumes taken from a "Volume Profile".
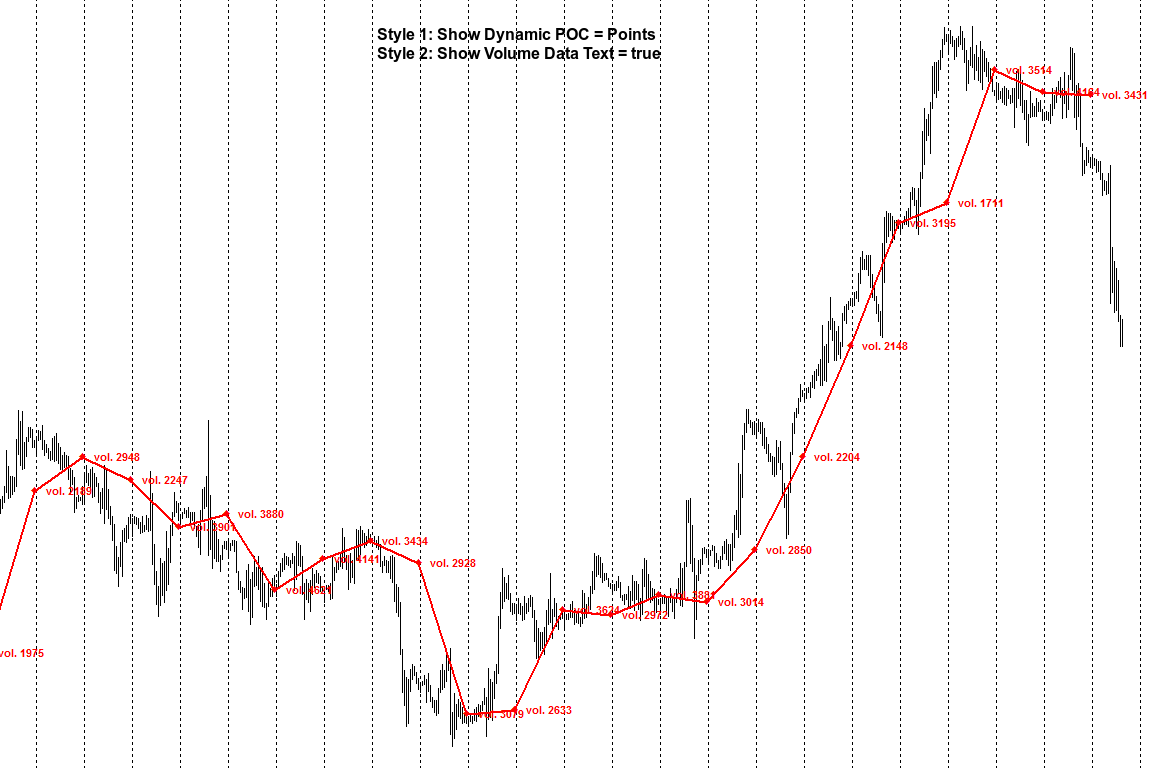
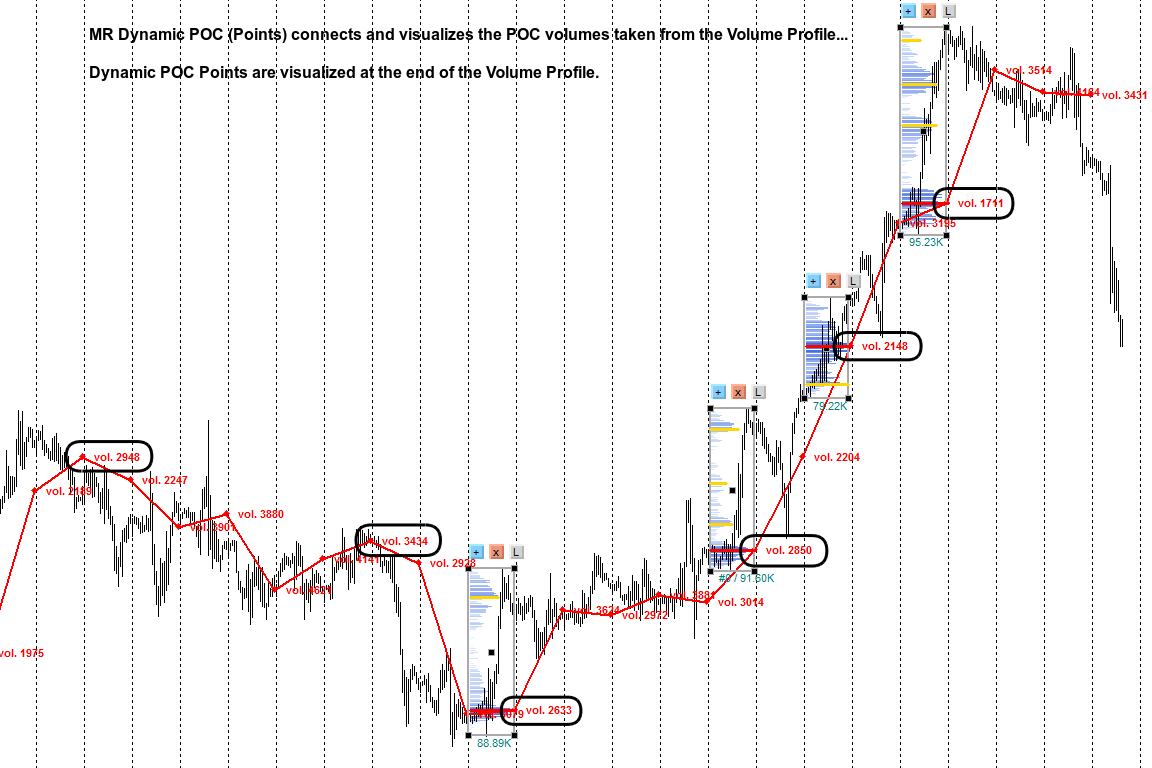
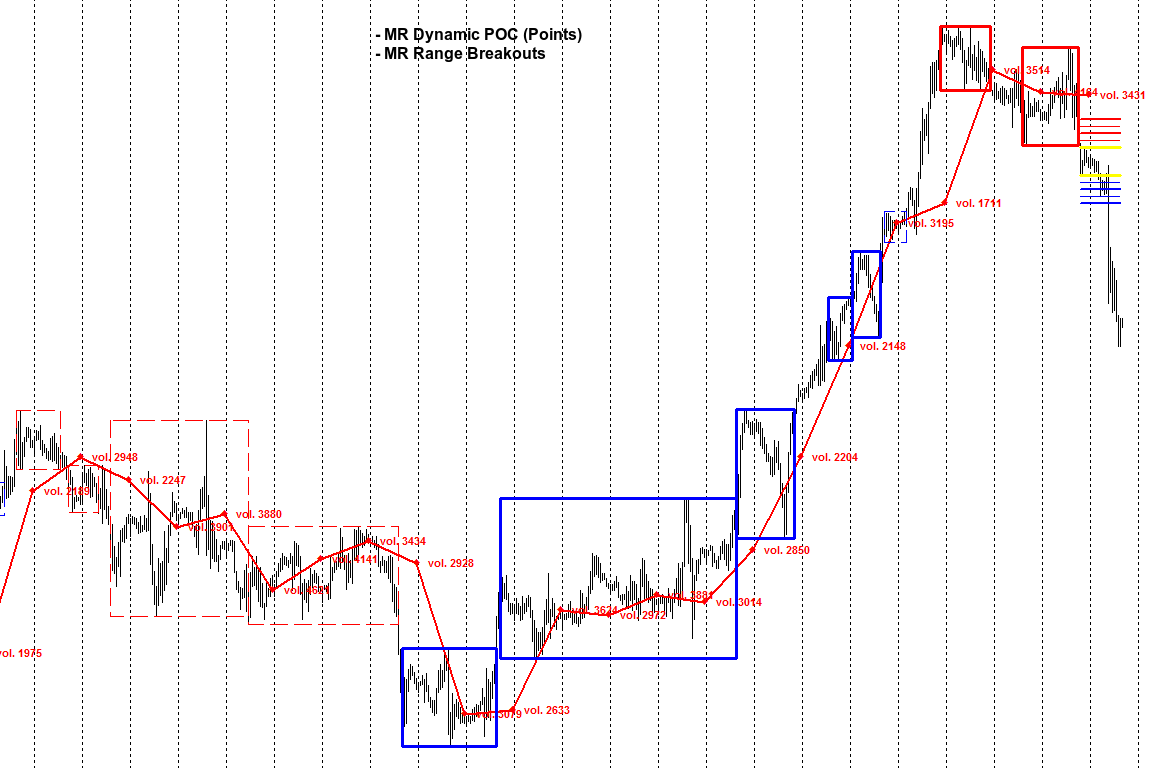
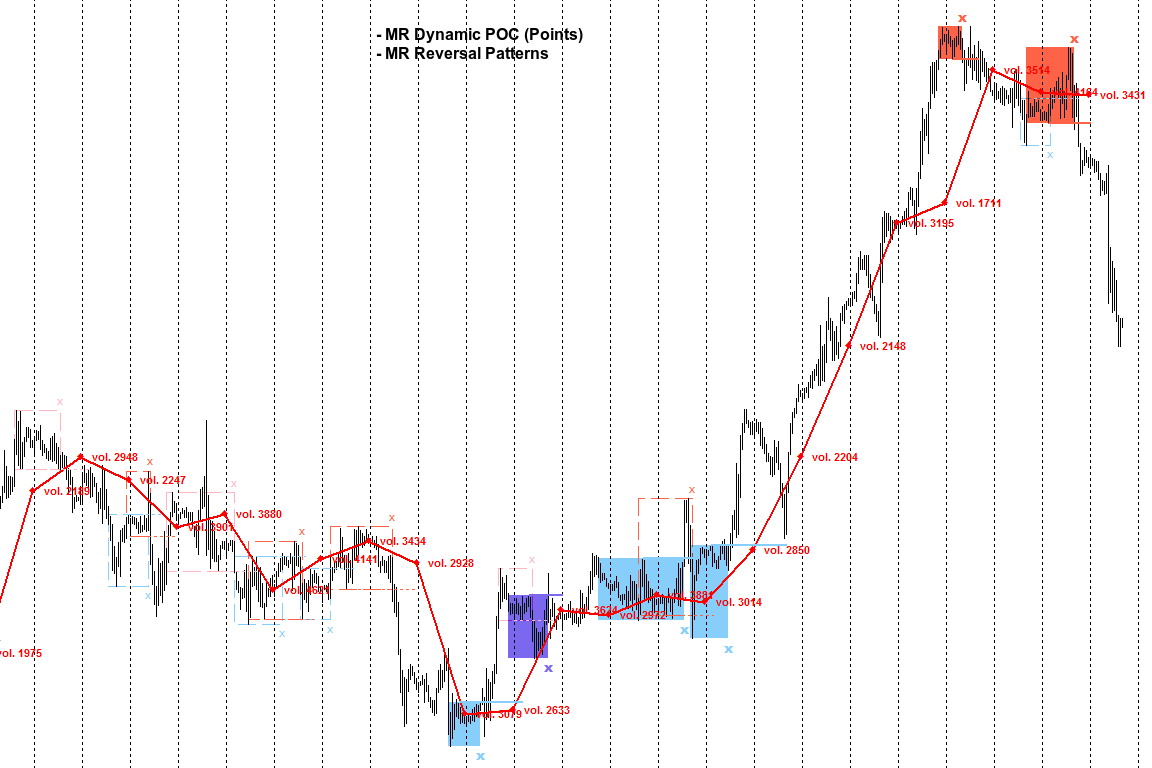
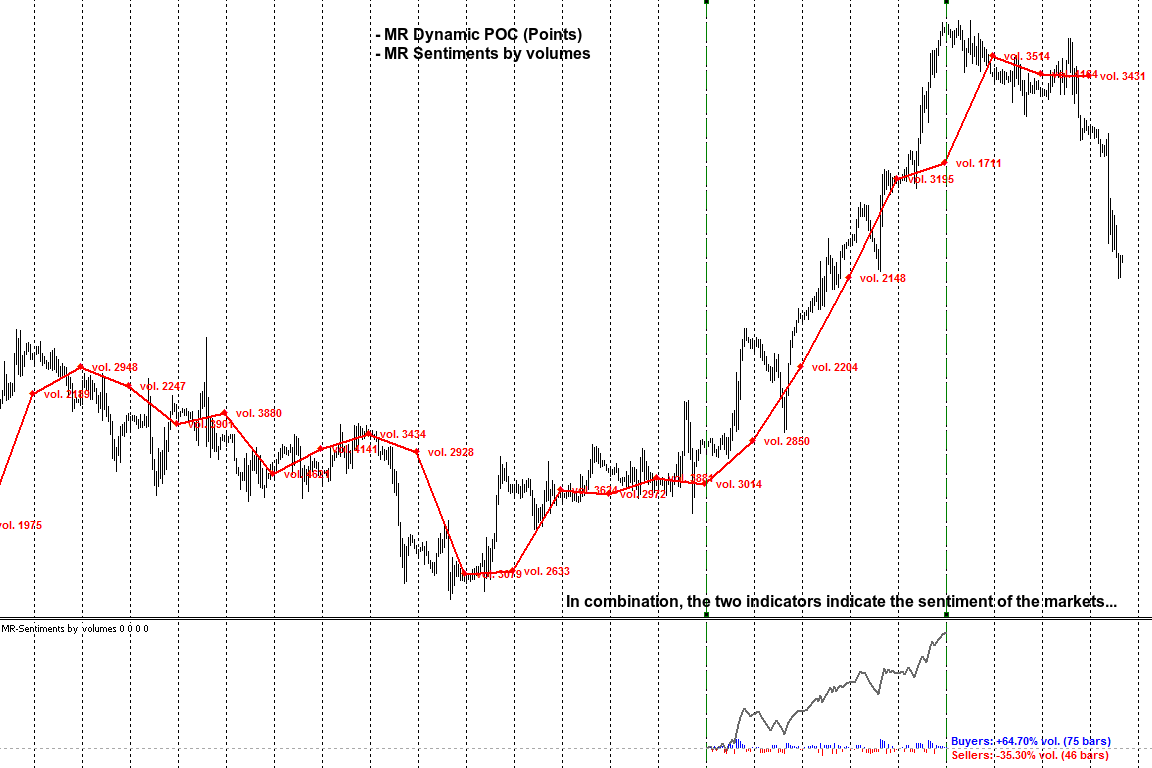
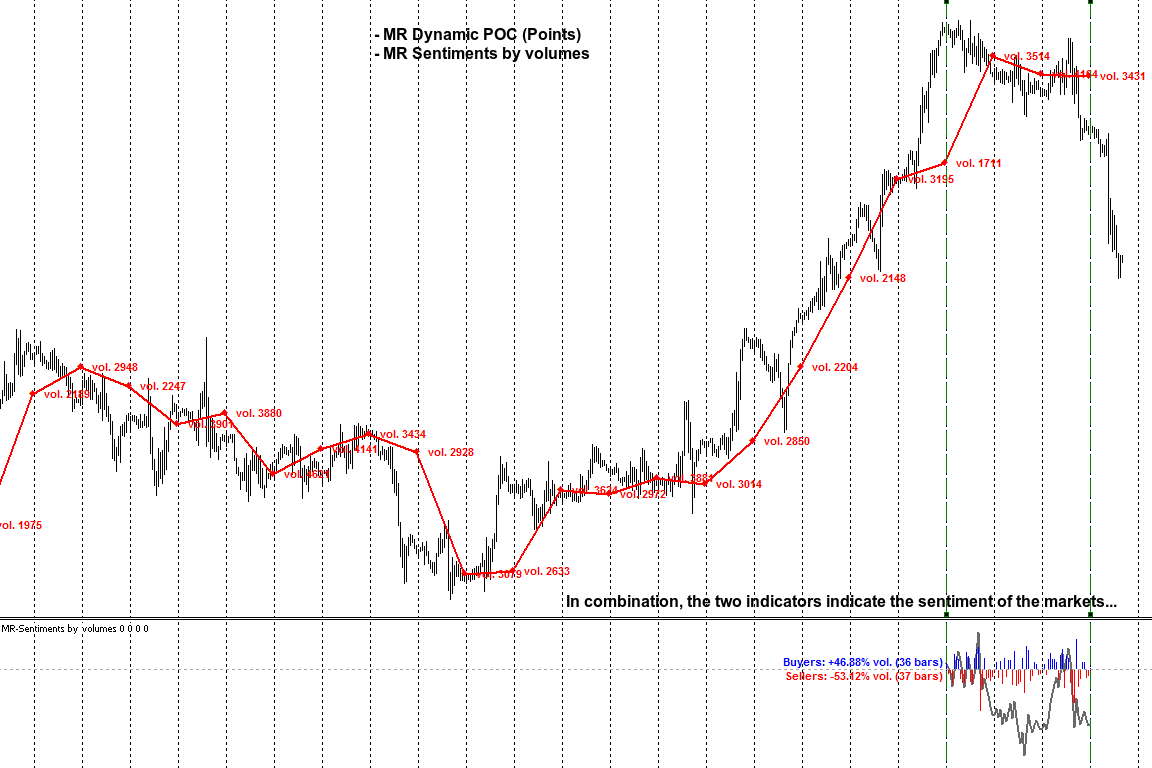
          • Dynamic POC "Points" - connects and visualizes POC volumes taken from a "Volume Profile". Dynamic POC "Points" are displayed at the end of the "Volume Profile". This is new concept for visualizing virgin or processed volumes.
          • "MR Dynamic POC" based on indicator "VP: Volume Profile v6.0. © FXcoder".


          If you liked the indicator, please support our work by giving 5 stars!!!

          For MetaTrader 4 https://www.mql5.com/en/market/product/90825
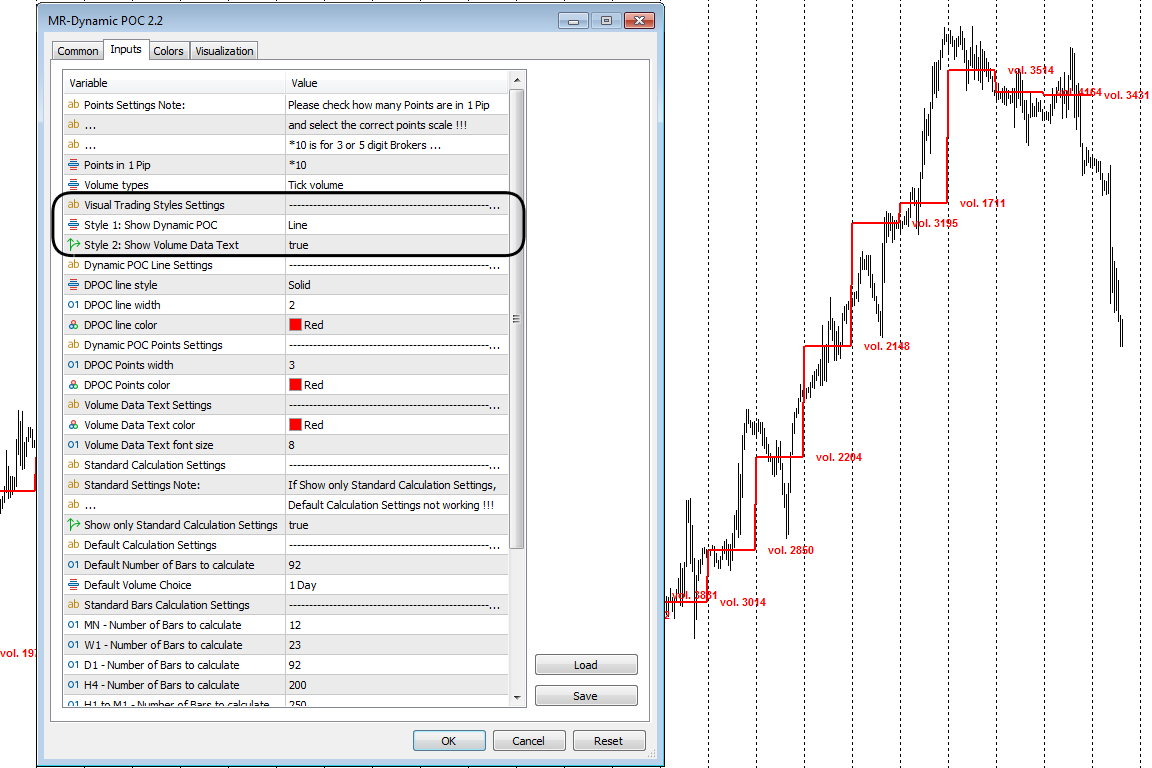

          Indicator settings:

          Points in 1 Pip - Offers you a choice of the number of Points in 1 Pip.
          Volume types - Offers you a choice to use tic volumes or real volumes. Note: To use real volumes, your Broker must provide them in the MetaTrader terminal.

          Section "Visual Trading Styles Settings"
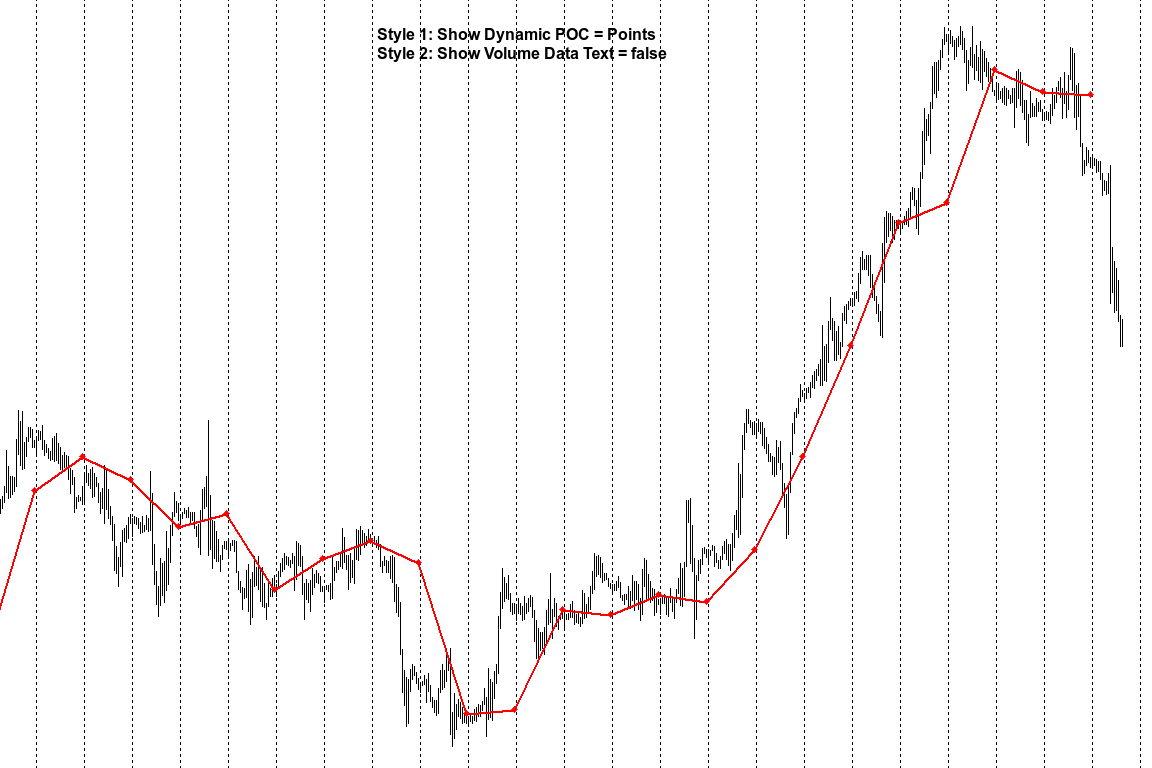
          Style 1: Show Dynamic POC - "Line" connects and visualizes the POC volumes taken from a Volume Profile. "Points" connects and visualizes POC volumes taken from a Volume Profile.
          Style 2: Show Volume Data Text - Shows or not to display text with information about the amount of volumes for the POC.

          Section "Dynamic POC Line Settings"
          DPOC line style - Specifies the line style of Dynamic POC indicator.
          DPOC line width - Specifies the line width of Dynamic POC indicator.
          DPOC line color - Specifies the line color of Dynamic POC indicator.

          Section "Dynamic POC Points Settings"
          DPOC Points width - Specifies the size of Dynamic POC Points.
          DPOC Points color - Specifies the color of Dynamic POC Points.

          Section "Volume Data Text Settings"
          Volume Data Text color - Data text color.
          Volume Data Text font size - You can choose the data text size.

          Section "Standard Calculation Settings"
          Show only Standard Calculation Settings - Enables or disables the default settings. If show only Standard calculation settings, Default calculation settings not working.

          Section "Default Calculation Settings"
          Default Number of Bars to calculate - Default number of Bars to calculate indicator.
          Default Volume Choice - You choose the volumes from which time frame to display on all lower time frames.

          Section "Standard Bars Calculation Settings"
          MN - Number of Bars to calculate - The number of monthly Bars to calculate the indicator.
          W1 - Number of Bars to calculate - The number of weekly Bars to calculate the indicator.
          D1 - Number of Bars to calculate - The number of daytime Bars to calculate the indicator.
          H4 - Number of Bars to calculate - The number of 4 hour Bars to calculate the indicator.
          H1 to M1 - Number of Bars to calculate - The number of Bars to calculate the indicator from a time frame lower than 4 hours.

          Section "Standard Volume Choice"
          In this section, you choose on which time frame to display the volumes of the time frame you have chosen for it...
          On D1 show Volumes from - W1
          On H4 show Volumes from - D1
          On H1 show Volumes from - D1
          On M30 show Volumes from - H4
          On M15 show Volumes from - H4
          On M5 show Volumes from - H4
          On M1 show Volumes from - H1

          Produits recommandés
          Standardize
          Manuel Espinosa
          5 (1)
          The "Standardize" indicator   is a technical analysis tool designed to   standardize and smooth price or volume data to highlight significant patterns and reduce market noise, making it easier to interpret and analyze. Description & Functionality: Standardization : The indicator standardizes price or volume values by subtracting the mean and dividing by the standard deviation. This converts the data into a distribution with zero mean and standard deviation of one, allowing different data sets
          FREE
          The indicator enables very quick orientation in the market phase (re/accumulation, re/distribution, up/down trend). It is counted only from price data (without volume). It is based on the assumptions of Wyckoff's law of Causa and Effect. Oscillations are an expression of the level of market uncertainty and point to the presence of Big Money. Such a "storm" is followed by a calmer trend that needs to be exited. You need to use other tools or shorter period of the same indicator for that. I kee
          Are you tired of drawing trendlines every time you're analyzing charts? Or perhaps you would like more consistency in your technical analysis. Then this is for you. This indicator will draw trend lines automatically when dropped on a chart. How it works Works similar to standard deviation channel found on mt4 and mt5. It has 2 parameters: 1. Starting Bar 2. Number of bars for calculation The   starting bar   is the bar which drawing of the trend lines will begin, while the   number of bars for c
          FREE
          Pivot Point Supertrend (corresponds to Pivot Point Super Trend indicator from Trading View) Pivot Point Period:    Pivot point defined as highest high and highest low... input 2 = defining highest high and highest low with 2 bars on each side which are lower (for highest high) and are higher (for lowest low calculation) ATR Length  : the  ATR  calculation is based on 10 periods ATR Factor: ATR multiplied by 3
          FREE
          Value Chart Candlesticks
          Flavio Javier Jarabeck
          4.75 (8)
          The idea of a Value Chart indicator was presented in the very good book I read back in 2020 , " Dynamic Trading Indicators: Winning with Value Charts and Price Action Profile ", from the authors Mark Helweg and David Stendahl. The idea is simple and the result is pure genius: Present candlestick Price analysis in a detrended way! HOW TO READ THIS INDICATOR Look for Overbought and Oversold levels. Of course, you will need to test the settings a lot to find the "correct" one for your approach.
          FREE
          Free automatic Fibonacci is an indicator that automatically plots a Fibonacci retracement based on the number of bars you select on the BarsToScan setting in the indicator. The Fibonacci is automatically updated in real time as new highest and lowest values appears amongst the selected bars. You can select which level values to be displayed in the indicator settings. You can also select the color of the levels thus enabling the trader to be able to attach the indicator several times with differe
          FREE
          Follow The Line MT5
          Oliver Gideon Amofa Appiah
          4.5 (28)
          This indicator obeys the popular maxim that: "THE TREND IS YOUR FRIEND" It paints a GREEN line for BUY and also paints a RED line for SELL. (you can change the colors). It gives alarms and alerts of all kinds. IT DOES NOT REPAINT and can be used for all currency pairs and timeframes. Yes, as easy and simple as that. Even a newbie can use it to make great and reliable trades. NB: For best results, get my other premium indicators for more powerful and reliable signals. Get them here: https://www.m
          FREE
          Volume Zone Fractal
          Eduardo Da Costa Custodio Santos
          VZO Plus est un indicateur qui montre les régions de surachat et de survente en fonction du volume négocié. #Lorsque la ligne indicatrice se situe entre -40 et -60, elle est survendue #Lorsque la ligne indicatrice se situe entre 40 et 60, il s'agit d'un surachat. En dehors de ces régions, le marché suit son chemin naturel par inertie. Au-dessus de la ligne verte, cela signifie que le marché est positif, Une autre façon d'analyser l'indicateur est à travers les régions de divergence. Lorsque nous
          (traduction Google) Cet indicateur est basé sur le " Time Segmented Volume (TSV) " original développé par Worden Brothers, Inc . Cependant, j'ai ajouté quelques fonctionnalités supplémentaires à celui-ci. On peut choisir le prix à appliquer, au lieu d'avoir uniquement le prix de clôture par défaut utilisé par l'original. On peut également choisir la pondération de volume à utiliser, y compris un pseudo-volume basé sur la plage réelle, ou aucune pondération de volume du tout. (Original text) This
          FREE
          Donchian Pro
          Paulo Henrique Faquineli Garcia
          5 (2)
          The Donchian Channel Channels are among the most popular tools of technical analysis, as they visually convey to the analyst the limits within which most price movement tends to occur. Channel users know that valuable information can be obtained at any time, whether prices are in the central region of a band or close to one of the border lines. One of the best known techniques to explore these concepts is Bollinger Bands. However, John Bollinger was not the only one to research the applicatio
          FREE
          Reversal Composite Candles
          MetaQuotes Ltd.
          3.57 (14)
          The idea of the system is to indentify the reversal patterns using the calculation of the composite candle. The reversal patterns is similar to the "Hammer" and "Hanging Man" patterns in Japanese candlestick analysis. But it uses the composite candle instead the single candle and doesn't need the small body of the composite candle to confirm the reversal. Input parameters: Range - maximal number of bars, used in the calculation of the composite candle. Minimum - minimal size of the composite can
          FREE
          Spike Catch Pro
          Amani Fungo
          4 (6)
          Spike Catch Pro 22:03 release updates Advanced engine for searching trade entries in all Boom and Crash pairs (300,500 and 1000) Programmed strategies improvements Mx_Spikes (to combine Mxd,Mxc and Mxe), Tx_Spikes,   RegularSpikes,   Litho_System,   Dx_System,   Md_System,   MaCross,   Omx_Entry(OP),  Atx1_Spikes(OP),   Oxc_Retracement (AT),M_PullBack(AT) we have added an arrow on strategy identification, this will help also in the visual manual backtesting of the included strategies and see h
          FREE
          Wave Box Market Frenquency
          Jean Jacques Huve Ribeiro
          4.75 (4)
          Totally linked to the result of a movement and the duration he had. Its height records how many ticks the asset walked during a given movement, its width shows us the duration that movement had. Its configuration must be in line with the Weis Wave Indicator configuration to observe the movement force and can indicate a possible accumulation or distribution of the movement;
          FREE
          This is a buyer and seller aggression indicator that analyzes the shape of each candle and project this data in a histogram form. There are 4 histograms in one. On the front we have two: Upper - Buyer force. Lower - Seller force. At the background we also have two histogram, both with same color. They measure the combined strenght of buyers and sellers. This histograms can be turned off in Input Parameters. It is also possible to have the real or tick volume to help on this force measurement. IN
          FREE
          Universal Box MT5
          Sergey Ermolov
          4.75 (8)
          Version MT4   |  FAQ  |   EA Universal Breakout   L'Universal Box   trace des   intervalles de prix   sur le graphique qui peuvent être utilisés ultérieurement pour négocier sur un breakout de l'intervalle de prix. Il existe de nombreuses stratégies avec lesquelles vous pouvez appliquer cet indicateur. L'indicateur est configuré par défaut pour marquer les intervalles des   séances de négociation Asiatique, Européenne et Américaine   sur le graphique. Les intervalles sont représentés par des re
          FREE
          What is this indicator? This indicator is the MACD (Moving Average Convergence/Divergence) supporting Virtual Trading mode of  Knots Compositor . When the mode is turned on, the indicator will be recalculated based on the displayed candlesticks. When the mode is turned off, the indicator will be recalculated based on the original chart candlesticks. Types of the applied price - Close - Open - High - Low - Median Price (HL/2) - Typical Price (HLC/3) - Weighted Price (HLCC/4) KC-Indicators
          FREE
          Tabajara V5
          Flavio Javier Jarabeck
          4.84 (32)
          Metatrader 5 version of the famous Andre Machado's Tabajara indicator. If you don't know Andre Machado's Technical Analysis work you don't need this indicator... For those who need it and for those several friend traders who asked this porting from other platforms, here it is... FEATURES 8-period Moving Average 20-period Moving Average 50-period Moving Average 200-period Moving Average Colored candles according to the inflexion of the 20-period MA SETTINGS You can change the Period of all M
          FREE
          Cybertrade Keltner Channels
          Emanuel Andriato
          4.75 (4)
          Cybertrade Keltner Channels - MT5 Created by Chester Keltner, this is a volatility indicator used by technical analysis. It is possible to follow the trend of financial asset prices and generate support and resistance patterns. In addition, envelopes are a way of tracking volatility in order to identify opportunities to buy and sell these assets. It works on periods longer than the period visible on the chart. All values ​​are available in the form of buffers to simplify possible automations.
          FREE
          Mitimom
          Danil Poletavkin
          The indicator is based on Robert Miner's methodology described in his book "High probability trading strategies" and displays signals along with momentum of 2 timeframes. A Stochastic oscillator is used as a momentum indicator. The settings speak for themselves period_1 is the current timeframe, 'current' period_2 is indicated - the senior timeframe is 4 or 5 times larger than the current one. For example, if the current one is 5 minutes, then the older one will be 20 minutes The rest of the
          FREE
          Forex Indicator Arrows
          NGUYEN NGHIEM DUY
          1 (1)
          Forex Indicator Arrows is an arrow Indicator used as an assistant tool for your trading strategy. The indicator analyzes the standard deviation of bar close for a given period and generates a buy or sell signals if the deviation increases. It good to combo with Martingale EA to follow Trend and Sellect Buy Only/Sell Only for EA work Semi-Automatic. You can use this  Indicator with any EAs in my Products.
          FREE
          Le Capteur de Tendance : La Stratégie du Capteur de Tendance avec Indicateur d'Alerte est un outil d'analyse technique polyvalent qui aide les traders à identifier les tendances du marché et les points d'entrée et de sortie potentiels. Elle présente une stratégie dynamique de Capteur de Tendance, s'adaptant aux conditions du marché pour une représentation visuelle claire de la direction de la tendance. Les traders peuvent personnaliser les paramètres selon leurs préférences et leur tolérance
          FREE
          True Day
          Aurthur Musendame
          5 (1)
          True Days is a tool designed specifically for the trader who wants to catch intraday volatility in price charts.  True day makes it easier for the trader to avoid trading in the dead zone - a period in time where markets are considered dead or non volatile. The trader can concentrate on finding opportunities only during periods of profound market movements. By default the indicator gives you a true day starting at 02:00 to 19:00 hours GMT+2. You can adjust according to your Time Zone. By deafult
          FREE
          Pivot Point Fibo RSJ est un indicateur qui trace les lignes de support et de résistance de la journée en utilisant les taux de Fibonacci. Cet indicateur spectaculaire crée jusqu'à 7 niveaux de support et de résistance via Pivot Point en utilisant les taux de Fibonacci. C'est fantastique de voir comment les prix respectent chaque niveau de ce support et de cette résistance, où il est possible de percevoir les points d'entrée/sortie possibles d'une opération. Caractéristiques Jusqu'à 7 nive
          FREE
          CAP Channel Trading MT5
          MEETALGO LLC
          3.96 (53)
          The   CAP Channel Trading   is a volatility-based indicator that makes use of the “advanced envelope theory”. These envelopes consist of two outer lines. Envelope theory states that the market price will generally fall between the boundaries of the envelope (or channel). If prices move outside the envelope, it is a trading signal or trading opportunity. Benefits of the Channel Trading Indicator CAP Channel Trading works with any asset It can be applied to any financial assets: forex, cryptoc
          FREE
          JCStatistics 简繁数据统计 1.显示账户信息:内容显示 交易员、账号、本金、杠杆、保证金、保证金比例、余额、净值; 日周月开盘余额、持仓收益、日收益、周收益、月收益; 收益为正时显示红色字体,收益为负时显示绿色字体; 日收益低于-5%时显示CircuitBreak; 总收益低于-10%时显示MarginCall; 2.显示统计数据: 收益(收益率)(交易量)(胜率) 5日数据;4周数据;12月数据; 3.当前标的统计:Symbol()收益(交易量)(胜率) 4.主流标的统计:收益(交易量)(胜率) 可以选择性显示账户信息、数据信息,调整显示颜色,调整字体,调整字体大小。 指标删除后自动删除桌面文字及背景。 备注:如遇使用问题,请联系邮箱:16692618587@qq.com.
          FREE
          Emperor
          Aleksandr Valutsa
          If necessary, please translate using an automatic translator. The description is offered only in the original language.. Робот конструктор может быть использован как с готовыми торговыми стратегиями, так и с целью создания своих стратегий. Мониторинг Все наши сигналы имя или описания которых содержат название советника "Emperor":  https://www.mql5.com/ru/users/robotstroi/seller Начинающий трейдер Пошаговые действия для быстрого старта: Настроить терминал с добавлением необходимых URL адресов
          L'indicateur montre des niveaux ronds sur le graphique. Ils sont également appelés niveaux psychologiques, niveaux de banque ou niveaux des principaux acteurs. À ces niveaux, il y a une véritable lutte entre les haussiers et les baissiers, une accumulation de nombreux ordres, ce qui entraîne une volatilité accrue. L'indicateur s'adapte automatiquement à tout instrument et à toute période. Si le niveau 80 est cassé puis testé, il faut acheter. Si le niveau 20 est cassé puis testé, vendre. L'obje
          FREE
          LT Donchian Channel
          Thiago Duarte
          4.75 (4)
          Donchian Channel is an indicator created by Richard Donchian. It is formed by taking the highest high and the lowest low of the last specified period in candles. The area between high and low is the channel for the chosen period. Its configuration is simple. It is possible to have the average between the upper and lower lines, plus you have alerts when price hits one side. If you have any questions or find any bugs, please contact me. Enjoy!
          FREE
          WaveTrend Plus
          Nguyen Thanh Cong
          5 (2)
          Introduction WaveTrend Plus is an amazing oscillator that can detect optimal entry points in the market with high precision using complex computations of price and momentum. This version packs many improvements compared to the original WaveTrend such as cleaner visuals, oversold/overbought signals and divergence detection Signal Buy when oversold signal appear (green dot below) or when a bullish divergence is detected (green dashed line) Sell when overbought signal appear (red dot ab
          FREE
          Vanguard's Volatility indicator is based on the analysis of long and short price volatility. It helps to determine market entry points by displaying favorable entry points with arrows. This indicator can be used as a filter in trading or as a tool to show the exact direction of the trend. It is suitable for both scalping on small time intervals and long-term trading. It is important to remember that successful trading requires a comprehensive approach, and additional information is needed to en
          Les acheteurs de ce produit ont également acheté
          Atomic Analyst MT5
          Issam Kassas
          4.56 (18)
          Tout d'abord, il convient de souligner que cet indicateur de trading n'est ni repainting, ni redrawing et ne présente aucun délai, ce qui le rend idéal à la fois pour le trading manuel et automatisé. Manuel de l'utilisateur : réglages, entrées et stratégie. L'Analyste Atomique est un indicateur d'action sur les prix PA qui utilise la force et le momentum du prix pour trouver un meilleur avantage sur le marché. Équipé de filtres avancés qui aident à éliminer les bruits et les faux signaux, et à
          TPSpro RFI Levels MT5
          Roman Podpora
          4.7 (10)
          Reversal First Impulse levels (RFI)      INSTRUCTIONS        RUS       -       ENG              R ecommended to use with an indicator   -   TPSpro  TREND PRO -  Version MT4                 A key element in trading is zones or levels from which decisions to buy or sell a trading instrument are made. Despite attempts by major players to conceal their presence in the market, they inevitably leave traces. Our task was to learn how to identify these traces and interpret them correctly. Main functi
          Tout d'abord, il convient de souligner que ce système de trading est un indicateur non repeint, non redessiné et non retardé, ce qui le rend idéal pour le trading manuel et automatisé. Cours en ligne, manuel et téléchargement de préréglages. Le "Système de Trading Smart Trend MT5" est une solution de trading complète conçue pour les traders débutants et expérimentés. Il combine plus de 10 indicateurs premium et propose plus de 7 stratégies de trading robustes, ce qui en fait un choix polyvalent
          FxaccurateLS
          Shiv Raj Kumawat
          WHY IS OUR FXACCCURATE LS MT5 THE PROFITABLE ? PROTECT YOUR CAPITAL WITH RISK MANAGEMENT Gives entry, stop and target levels from time to time. It finds Trading opportunities by analyzing what the price is doing during established trends. POWERFUL INDICATOR FOR A RELIABLE STRATEGIES We have made these indicators with a lot of years of hard work. It is made at a very advanced level. Established trends provide dozens of trading opportunities, but most trend indicators completely ignore them!
          Maintenant 147 $ (augmentant à 499 $ après quelques mises à jour) - Comptes illimités (PCS ou Mac) Manuel d'utilisation RelicusRoad + Vidéos de formation + Accès au groupe Discord privé + Statut VIP UNE NOUVELLE FAÇON DE REGARDER LE MARCHÉ RelicusRoad est l'indicateur de trading le plus puissant au monde pour le forex, les contrats à terme, les crypto-monnaies, les actions et les indices, offrant aux traders toutes les informations et tous les outils dont ils ont besoin pour rester renta
          TPA True Price Action indicator reveals the true price action of the market makers through 100% non-repainting signals strictly at the close of a candle! TPA shows entries and re-entries, every time the bulls are definitely stronger than the bears and vice versa. Not to confuse with red/green candles. The shift of power gets confirmed at the earliest stage and is ONE exit strategy of several. There are available now two free parts of the TPA User Guide for our customers. The first "The Basics"
          MetaForecast M5
          Vahidreza Heidar Gholami
          5 (2)
          MetaForecast prédit et visualise l'avenir de n'importe quel marché en se basant sur les harmoniques des données de prix. Bien que le marché ne soit pas toujours prévisible, s'il y a un motif dans les prix, MetaForecast peut prédire l'avenir aussi précisément que possible. Comparé à d'autres produits similaires, MetaForecast peut générer des résultats plus précis en analysant les tendances du marché. Paramètres d'entrée Past size (Taille passée) Spécifie le nombre de barres que MetaForecast uti
          Bill Williams Advanced
          Siarhei Vashchylka
          5 (8)
          Bill Williams Advanced is designed for automatic chart analysis using Bill Williams' "Profitunity" system. The indicator analyzes four timeframes at once. Manual (Be sure to read before purchasing) Advantages 1. Automatically analyzes the chart using the "Profitunity" system of Bill Williams. The found signals are placed in a table in the corner of the screen. 2. Equipped with a trend filter based on the Alligator indicator. Most of the system signals are recommended to be used only accordi
          Native Channels
          BeeXXI Corporation
          5 (1)
          This indicator recognizes all support and resistance levels. A number of unique high-performance techniques have been applied, which made the existence of this indicator possible. All formed channels are naturally visible: horizontal linear linear parabolic cubic (Polynomial 3 degrees - Wave) This is due to a bundle of approximating channels. The formed channels form "standing waves" in a hierarchical sequence. Thus, all support and resistance levels are visible. All parameter management is
          AT Forex Indicator MT5
          Marzena Maria Szmit
          5 (3)
          The AT Forex Indicator MT5 is a sophisticated trading tool designed to provide traders with a comprehensive analysis of multiple currency pairs. This powerful indicator simplifies the complex nature of the forex market, making it accessible for both novice and experienced traders. AT Forex Indicator uses advanced algorithms to detect trends, patterns and is an essential tool for traders aiming to enhance their forex trading performance. With its robust features, ease of use, and reliable signal
          How to use Pair Trading Station Pair Trading Station is recommended for H1 time frame and you can use it for any currency pairs. To generate buy and sell signal, follow few steps below to apply Pair Trading Station to your MetaTrader terminal. When you load Pair Trading Station on your chart, Pair Trading station will assess available historical data in your MetaTrader platforms for each currency pair. On your chart, the amount of historical data available will be displayed for each currency pai
          XQ Indicator MetaTrader 5
          Marzena Maria Szmit
          5 (1)
          Step into the realm of Forex trading with confidence and precision using XQ, a cutting-edge Forex indicator designed to elevate your trading game to unprecedented heights. Whether you're a seasoned trader or just stepping into the world of currency exchange, XQ Forex Indicator empowers you with the insights and signals needed to make informed trading decisions. The signal conditions are a combination of three indicators, and XQ Forex Indicator only display  medium and long-term trends . The ind
          Go Way TREND
          Ywsf Hsyn Hmad Alrsh
          Suivez la tendance. Oui, attendez le signal d'entrée, qu'il soit d'achat ou de vente, sur une image de 15 minutes, et vérifiez le signal s'il apparaît sur une image de 30 minutes (il faut parfois une heure ou plus pour que le signal apparaisse. Vous pouvez revenir au cadre de 15 minutes et revenez au cadre de 30 minutes, et répétez cette opération jusqu'à ce que le signal principal apparaisse pour vous. Si le signal apparaît sur le cadre de 30 minutes, entrez avec le prix et le profit est pris
          Introduction to Fractal Pattern Scanner Fractal Indicator refers to the technical indicator that makes use of the fractal geometry found in the financial market. Fractal Pattern Scanner is the advanced Fractal Indicator that brings the latest trading technology after the extensive research and development work in the fractal geometry in the financial market. The most important feature in Fractal Pattern Scanner is the ability to measure the turning point probability as well as the trend probabil
          Tout d'abord, il convient de souligner que ce système de trading est un indicateur non repainting, non redrawing et non lagging, ce qui le rend idéal pour le trading professionnel. Cours en ligne, manuel utilisateur et démonstration. Le "Système de Trading de Support et Résistance Intelligent" est un indicateur avancé conçu pour les traders novices et expérimentés. Il permet aux traders de bénéficier de précision et de confiance sur le marché du forex. Ce système complet combine plus de 7 strat
          Analyst AI
          Nestor Alejandro Chiariello
          Bonjour traders, ce formidable indicateur a été conçu pour analyser le marché de manière extraordinaire. Il sera disponible pour tous les traders sur le site mql5 de la plateforme MT5. Tout d'abord, il convient de souligner ici que cet indicateur de trading est un indicateur sans repeinture, sans redessin et sans retard, ce qui le rend idéal à la fois pour le trading manuel et robot, pour un signal optimal !. L'IA analytique est différente de tout ce qui est connu parce que? , il disp
          Cryo
          Sabina Fik
          5 (1)
          Cryo is based on the process of identifying the rate of change in price growth and allows you to find entry and exit points from the market. A fundamental technical indicator that allows you to assess the current market situation in order to enter the market of the selected currency pair in a trend and with minimal risk. The Cryo indicator was created on the basis of the original indicators for searching for extremes, the indicator is well suited for determining a reversal or a large sharp je
          ICT Breakers MT5
          Diego Arribas Lopez
          MT4 Version   Order Blocks ICT   Kill Zones   SMT Divergences ICT Breakers The ICT Breakers indicator is a powerful tool for traders looking to gain an edge in the market. This indicator is based on the order flow and volume analysis, which allows traders to see the buying and selling pressure behind the price action. This information can be extremely valuable in identifying key levels of support and resistance, as well as potential turning points in the market. Breaker blocks are areas where i
          Introduction to Chart Pattern MT Chart Pattern MT is a chart pattern scanner to detect the triangle pattern, falling wedge pattern, rising wedge pattern, channel pattern and so on. Chart Pattern MT uses highly sophisticated chart pattern detection algorithm. However, we have designed it in the easy to use with intuitive user interface. Chart Pattern MT will show all the patterns in your chart in the most efficient format for your trading. You do not have to do tedious manual pattern detection an
          IVISTscalp5
          Vadym Zhukovskyi
          5 (5)
          Nous vous présentons l'indicateur iVISTscalp5, qui est non seulement unique, mais également efficace dans les opérations de trading. Cet indicateur est basé sur des données temporelles et est le résultat de nombreuses années d'expérience et d'analyse approfondie des marchés financiers. L'indicateur iVISTscalp5 est un excellent outil pour le trading manuel. La commodité, la simplicité et la visualisation - toute la complexité est cachée à l'intérieur. Nous avons simplifié au maximum les paramètre
          TrendMaestro5
          Stefano Frisetti
          note: this indicator is for METATRADER4, if you want the version for METATRADER5 this is the link:  https://www.mql5.com/it/market/product/108106 TRENDMAESTRO ver 2.4 TRENDMAESTRO recognizes a new TREND in the bud, he never makes mistakes. The certainty of identifying a new TREND is priceless. DESCRIPTION TRENDMAESTRO identifies a new TREND in the bud, this indicator examines the volatility, volumes and momentum to identify the moment in which there is an explosion of one or more of these data a
          VTrende Pro
          Andrii Diachenko
          5 (1)
          VTrende Pro - MTF indicator for trend trading with a display panel for MT5 *** Videos can be translated into any language using subtitles (video language - Russian) Although the signals of the VTrende Pro indicator can be used as signals of a full-fledged trading system, it is recommended to use them in conjunction with the Bill Williams TS. VTrende Pro is an extended version of the VTrende indicator. Difference between Pro version and VTrende: - Time zones - Signal V - signal 1-2 waves
          Trade smarter, not harder: Empower your trading with Harmonacci Patterns Special Offer: Purchase now to receive free bonuses worth $165! (Read more for details) This is arguably the most complete harmonic price formation auto-recognition indicator you can find for the MetaTrader Platform. It detects 19 different patterns, takes fibonacci projections as seriously as you do, displays the Potential Reversal Zone (PRZ) and finds suitable stop-loss and take-profit levels. [ Installation Guide | Up
          Introduction to X3 Chart Pattern Scanner X3 Cherart Pattern Scanner is the non-repainting and non-lagging indicator detecting X3 chart patterns including Harmonic pattern, Elliott Wave pattern, X3 patterns, and Japanese Candlestick patterns. Historical patterns match with signal patterns. Hence, you can readily develop the solid trading strategy in your chart. More importantly, this superb pattern scanner can detect the optimal pattern of its kind. In addition, you can switch on and off individu
          Elliott Wave Trend was designed for the scientific wave counting. This tool focuses to get rid of the vagueness of the classic Elliott Wave Counting using the guideline from the template and pattern approach. In doing so, firstly Elliott Wave Trend offers the template for your wave counting. Secondly, it offers Wave Structural Score to assist to identify accurate wave formation. It offers both impulse wave Structural Score and corrective wave Structure Score. Structural Score is the rating to sh
          Volatility Trend System - est un système commercial qui fournit des signaux pour les entrées. Le système de volatilité donne des signaux linéaires et ponctuels dans le sens de la tendance, ainsi que des signaux pour en sortir, sans redessin ni délai. L'indicateur de tendance surveille la direction de la tendance à moyen terme, montre la direction et son changement. L'indicateur de signal est basé sur les changements de volatilité et montre les entrées sur le marché. L'indicateur est équipé
          Piranha version 2
          Maria Strudov
          5 (1)
          "Piranha" - an autonomous trading system that determines overbought and oversold levels on the chart. Red and blue zones represent overbought and oversold levels respectively. Entry points are marked with arrows: a downward arrow in the red zone for "sell" and an upward arrow in the blue zone for "buy". The Take profit level is indicated by the green moving average. Key features: Adjusting the Take profit level as the green moving average changes position. Averaging ability when a new market e
          SMCpro
          Arief
          5 (1)
          Currently Price  20% OFF  ( for unlimited use ) Indicator   USER MANUAL , trade setups, solving issues, etc :  Direct Download Here     (  for users only  ) Hello World! Introducing.. SMCpro tool and Indicator for  MetaTrader 5 , a cutting-edge feature designed to revolutionize your trading experience. With innovative ICT Smart Money Concept, you gain unparalleled insight into market dynamics, empowering you to make informed trading decisions like never before. SMC Indicator built on th
          The iChannels
          BeeXXI Corporation
          5 (2)
          Ultra-fast recognition of parabolic channels (as well as linear, horizontal and wavy channels) throughout the depth of history, creating a hierarchy of channels. Required setting: Max bars in chart: Unlimited This indicator is designed primarily for algorithmic trading, but can also be used for manual trading.  This indicator will have a very active evolution in the near future and detailed descriptions on how to apply to create robots
          Introducing the Power Trade Plus indicator designed by a small group of traders with a few years of experience trading the market profitably.  The Power Trade Plus is derived from the Power Trade indicator,  the indicator strive in powerful sniper entries and take profit levels,  with an algorithm that's can determine the markets volatility and Provides entries based on the current market volatility. This indicator is much more effective in stock ,currencies and indices.
          Plus de l'auteur
          MR Reversal Patterns 4
          Sergey Khramchenkov
          5 (2)
          In the "Masters of Risk" trading system, one of the main concepts is related to places where markets change direction. In fact, this is a change in priority and a violation of the trend structure at the extremes of the market, where supposedly there are or would be stop-losses of "smart" participants who are outside the boundaries of the accumulation of volume. For this reason, we call them "Reversal Patterns" - places with a lot of weight for the start of a new and strong trend. Some of the imp
          "Sentiments of traders" in the financial markets is a topic that has been of interest to us for a long time. In time, we could not find the right formula to define these sentiments. We went through many stages in the search for the right methodology - from taking data from external sources to calculate open positions of buyers and sellers to calculating tick volumes, but still we were not satisfied with the results. The calculation of open positions of buyers and sellers from external sources ha
          A "Volume Profile" is an advanced charting indicator that displays total volume traded at every price level over a user specified time period. The main components of the volume profile are POC ( Point Of Control - the price level, at which the maximum number of contracts were executed during a selected period), VAH ( Value Area High - the highest price in the Value Area) and VAL ( Value Area Low - the lowest price in the Value Area). When we settled on the original indicator, we spent a lot o
          A "Volume Profile" is an advanced charting indicator that displays total volume traded at every price level over a user specified time period. The main components of the volume profile are POC ( Point Of Control - the price level, at which the maximum number of contracts were executed during a selected period), VAH ( Value Area High - the highest price in the Value Area) and VAL ( Value Area Low - the lowest price in the Value Area). When we settled on the original indicator, we spent a lot o
          MR Reversal Patterns 5
          Sergey Khramchenkov
          5 (1)
          In the "Masters of Risk" trading system, one of the main concepts is related to places where markets change direction. In fact, this is a change in priority and a violation of the trend structure at the extremes of the market, where supposedly there are or would be stop-losses of "smart" participants who are outside the boundaries of the accumulation of volume. For this reason, we call them "Reversal Patterns" - places with a lot of weight for the start of a new and strong trend. Some of the im
          The most crucial price level in any "Volume Profile" is the "Point of Control" . Is the price level with the highest traded volume. And mainly, is the level where the big guys start there their positions, so it's an accumulation/distribution level for smart money. The idea of the indicator arose after the "MR Volume Profile Rectangles" indicator was made. When creating the "MR Volume Profile Rectangles" indicator, we spent a lot of time comparing the volumes with those from the volume profil
          MR Volume POC Levels 4
          Sergey Khramchenkov
          5 (2)
          The most crucial price level in any "Volume Profile" is the "Point of Control" . Is the price level with the highest traded volume. And mainly, is the level where the big guys start there their positions, so it's an accumulation/distribution level for smart money. The idea of the indicator arose after the "MR Volume Profile Rectangles" indicator was made. When creating the "MR Volume Profile Rectangles" indicator, we spent a lot of time comparing the volumes with those from the volume profil
          MR Range Breakouts 4
          Sergey Khramchenkov
          5 (1)
          " A trading range occurs when a financial instrument trades between constant high and low prices over a period of time. The upper part of the trading range of a financial instrument often provides price resistance, while the lower part of the trading range usually offers price support.  Traders can enter in the direction of a breakout or breakdown from a trading range... " This is the "Classical Theory" understanding of ranges. We have a different understanding of the nature of ranges and th
          MR Dynamic POC 4
          Sergey Khramchenkov
          The most crucial price level in any "Volume Profile" is the "Point of Control" . Is the price level with the highest traded volume. And mainly, is the level where the big guys start there their positions, so it's an accumulation/distribution level for smart money. The idea of the indicator arose after the "MR Volume Profile Rectangles" indicator was made. When creating the "MR Volume Profile Rectangles" indicator, we spent a lot of time comparing the volumes with those from the volume profil
          We publish the indicator as a useful tool in trading and call this indicator the "Swiss Army Knife" because it provides many possibilities and combinations to help understand the material on the "Masters of Risk" trading system. The indicator itself is not part of the tools used in the "Masters of Risk" trading system. The indicator consists of 3 separate multi-timeframe indicators, which in combination with each other help to reduce the "noise" of false signals. The first of the indicators ar
          "Sentiments of traders" in the financial markets is a topic that has been of interest to us for a long time. In time, we could not find the right formula to define these sentiments. We went through many stages in the search for the right methodology - from taking data from external sources to calculate open positions of buyers and sellers to calculating tick volumes, but still we were not satisfied with the results. The calculation of open positions of buyers and sellers from external sources ha
          MR Range Breakouts 5
          Sergey Khramchenkov
          5 (2)
          " A trading range occurs when a financial instrument trades between constant high and low prices over a period of time. The upper part of the trading range of a financial instrument often provides price resistance, while the lower part of the trading range usually offers price support.  Traders can enter in the direction of a breakout or breakdown from a trading range... " This is the "Classical Theory" understanding of ranges. We have a different understanding of the nature of ranges and th
          We publish the indicator as a useful tool in trading and call this indicator the "Swiss Army Knife" because it provides many possibilities and combinations to help understand the material on the "Masters of Risk" trading system. The indicator itself is not part of the tools used in the "Masters of Risk" trading system. The indicator consists of 3 separate multi-timeframe indicators, which in combination with each other help to reduce the "noise" of false signals. The first of the indicators ar
          Filtrer:
          Aucun avis
          Répondre à l'avis
          Version 2.2 2023.03.15
          - Fixed some technical details.