Trend Show Volume
- Indicateurs
- Rodolfo Leonardo De Morais
- Version: 1.2
- Activations: 5
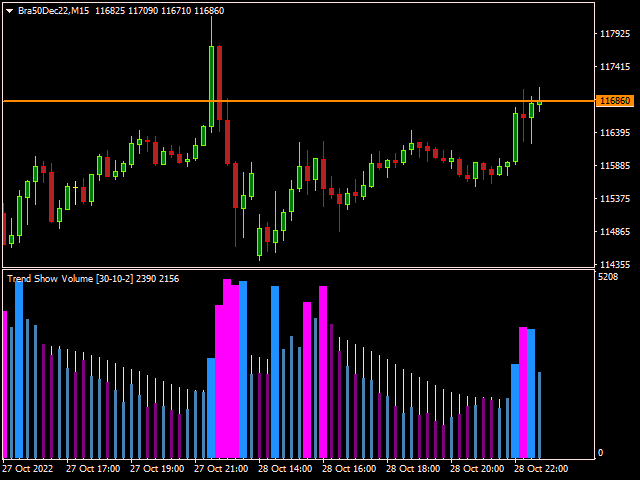
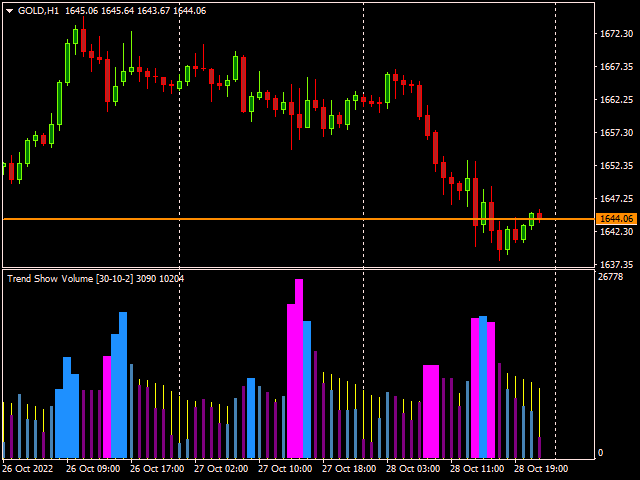
Trend Show Volume
This indicator allows you to visualize volume distortions. When the volume increases by x percent we have different colors and sizes plotted.
Indicator Parameters
pPercentShow - Percentage of volume on which different colors and sizes will be plotted
pLength - Average applied to volume [background bar]
pModeMA - Type of media applied to the volume