Diamond by MMD MT4
- Indicateurs
- Mariusz Maciej Drozdowski
- Version: 7.32
- Mise à jour: 25 avril 2023
- Activations: 5
Diamant par MMD
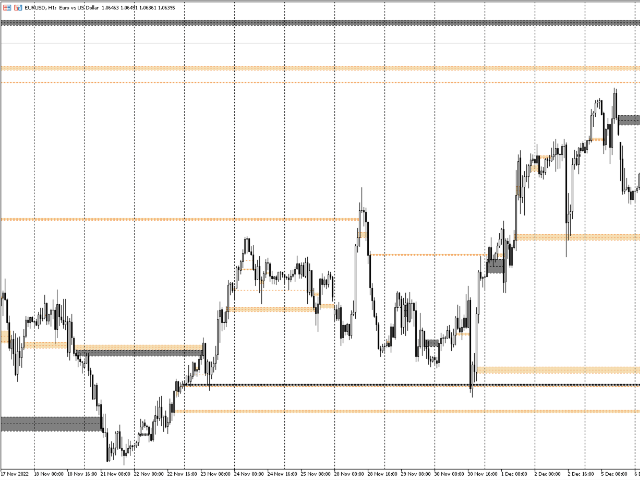
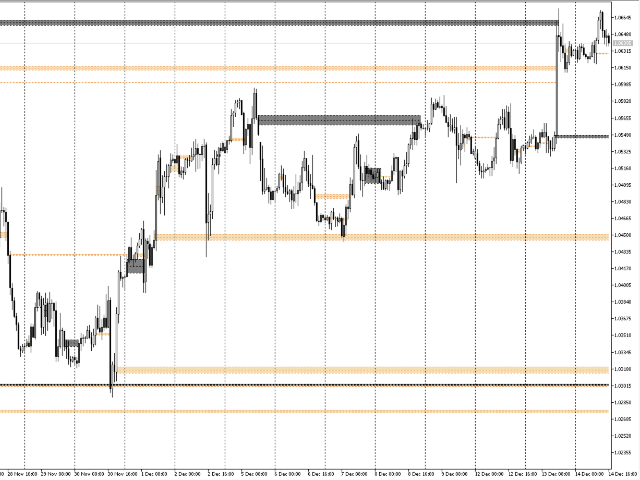
Diamond by MMD est un indicateur avancé qui identifie les endroits importants pour le comportement des prix.
Cet indicateur - sur n'importe quelle période - détecte et marque les zones de réaction des prix sur le graphique.
Les diamants - l'un des éléments de la pyramide des connaissances dans la méthodologie MMD - sont des bougies qui répondent à des conditions très strictes.
Il existe deux principaux types de diamants :
- diamant standard
- démence inversée.
Ces deux modèles sont automatiquement identifiés et marqués sur le graphique.
L'indicateur peut marquer des diamants, par exemple de l'intervalle M5 sur l'intervalle H1. Le paramètre par défaut de l'indicateur affiche des diamants sur la période sur laquelle votre graphique est actuellement ouvert.
Description des paramètres de l'indicateur.
Utiliser le diamant standard - affiche/masque les diamants dans le modèle 00100
Utiliser le diamant inversé - affiche/masque les diamants dans le modèle 0010100
Diamond Time Frame - une option qui vous permet d'indiquer l'intervalle à partir duquel les diamants doivent être affichés. Il est possible d'afficher, par exemple, des diamants de l'intervalle M5 sur le graphique avec des bougies M1 ou H1.
Diamond Look Back Bars - spécifiant le nombre de bougies - sur un intervalle donné - qui seront scannées - à la recherche de bougies répondant aux paramètres sélectionnés pour les diamants.
Min Diamond Range Points - taille minimale du diamant (en points).
Max Diamond Range Points - taille maximale du diamant (en points).
Utiliser Diamond Exclude Time - activation/désactivation du paramètre. Ce paramètre est chargé de déterminer le moment où les bougies qui remplissent les conditions fixées pour les diamants ne seront pas marquées sur le graphique. Cela s'applique en particulier aux heures de nuit.
Exclure l'heure de début - indication du début de la période pendant laquelle les diamants ne seront pas marqués.
Exclure l'heure de fin - indication de la fin de la période pendant laquelle les diamants ne seront pas marqués.
Couleur du diamant standard - la couleur du diamant standard.
Couleur du diamant inversé - la couleur du diamant inversé.